OneKey DeleteOrder

  • Утилиты
  • Yu Zhang
  • Версия: 1.11
  • Обновлено: 23 октября 2021
  • Активации: 20

I see that many tools in the market deal with Position and Order in the form of operation panels. Which is loaded into a Chart in the form of an EA.

However, once the operator panel EA is loaded, no other EAs can be loaded. So, I wrote the one-click operation of Position and Order as a script, so you can load other EAs and easily complete one-click operation of Trade.

1. What is this:

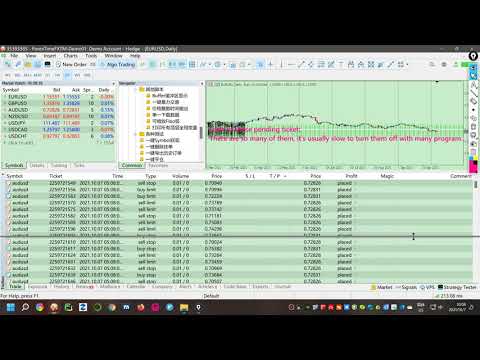
This is a one-click script to delete the pending order.

Now you can delete pending tickets at high speed, for example 1000 pending tickets can be deleted instantaneously.

2. Function:

There are many ways to filter:
  • You can choose the symbol of the pending order.  Default is All.
  • You can choose the type of pending order, Default is All.
  • You can enter magci number, the default is 0.
  • You can enter comment, the default is "".
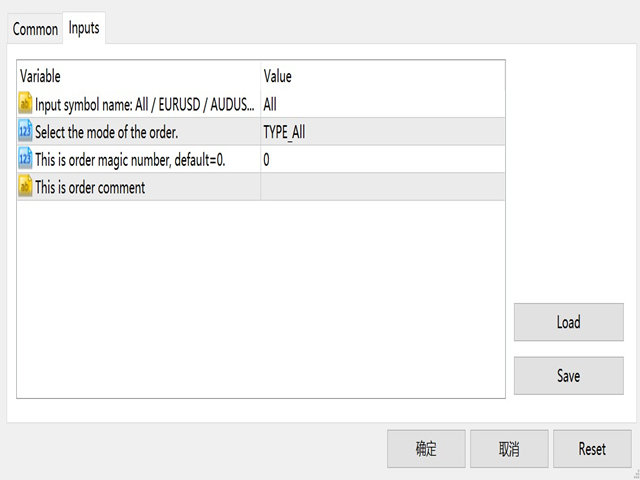
3. Parameters:
  • Input string ForexName="All";                            //Input symbol name: All / EURUSD / AUDUSD / ...
  • Input Enum_OrderType Type_Order=TYPE_All;    //Select the mode of the order.
  • Input int MAGICNUM=0;                                     //This is order magic number, default=0.
  • Input string COMMENT="";                                  //This is order comment
  • Input bool HighSpeed=true; //True represents high speed execution
Thanks for using!


Рекомендуем также
Manual Assistant MT5
Igor Kotlyarov
4.75 (4)
Manual Assistant MT5  -  это профессиональный инструмент для ручной торговли, который сделает ваш трейдинг быстрым и комфортным. Оснащена всеми необходимыми функционалами, которые позволят открывать, сопровождать и закрывать ордера и позиции одним кликом. Имеет простой и понятный интерфейс и подойдет как профессионалу, так и новичку. Панель позволяет выставлять ордера на покупку и продажу одним нажатием на кнопку. Основные возможности панели  Работает с любыми торговыми инструментами. Панель п
FREE
FiT Panel Pro
Thonglak Janyakorn
Overview FiT Panel Pro is a professional-grade trade management panel designed for MetaTrader 5 traders who demand speed, precision, and full control over their trades. Built with a modern dark-theme UI, it combines one-click execution with advanced risk management, visual SL/TP drag lines, automatic Fibonacci-based levels, and comprehensive order management — all in a single, compact panel. Whether you are a scalper, day trader, or swing trader, FiT Panel Pro gives you the edge you need to exec
FREE
BTC Scalper - Automated RSI Breakout Strategy for BTCUSD Unlock the power of automated trading with BTC Scalper! This expert advisor is a fully autonomous trading strategy, designed to capitalize on fast-moving BTCUSD markets. It leverages a potent combination of RSI Breakouts and two Exponential Moving Averages (EMA) to find high-probability trade entries, ensuring optimal confluence for success. Key Features: Fully Automated Trading : Set it, forget it, and let BTC Scalper handle your trades 2
FREE
MAFX Trading Manager
Mark Anthony Noblefranca Nazarrea
5 (1)
MAFX Trading Manager Профессиональная панель ручного управления сделками для MetaTrader 5 Обзор продукта MAFX Trading Manager — это профессиональная панель ручного управления сделками для MetaTrader 5, разработанная для более эффективного открытия и управления позициями. Она обеспечивает быстрое исполнение ордеров и основные инструменты управления сделками в компактном и удобном интерфейсе. Данный продукт предназначен для ручных трейдеров, которым необходимы больший контроль, скорость и стабильн
FREE
This indicator creates a Renko-based custom symbol in MetaTrader 5. Renko charts are built using price movement only, not time, making them useful for analyzing trends and filtering noise. Features Customizable brick size in points. Option to calculate brick size using ATR (adaptive). Ability to show or hide wicks. Creates and updates a custom Renko chart symbol. Automatically opens the chart window (optional). Maintains a limited bar history for performance. Inputs BrickSizePoints – brick size
FREE
Общее описание Этот индикатор — усовершенствованная версия классического канала Дончия с добавлением практических функций для реальной торговли. Помимо стандартных трёх линий (верхняя, нижняя и средняя), система определяет пробои и отображает их на графике стрелками, показывая только линию, противоположную текущему направлению тренда для более чистого восприятия. Индикатор включает: Визуальные сигналы : цветные стрелки при пробое Автоматические уведомления : всплывающие окна, push и email Фильтр
FREE
Are you tired of drawing trendlines every time you're analyzing charts? Or perhaps you would like more consistency in your technical analysis. Then this is for you. This indicator will draw trend lines automatically when dropped on a chart. How it works Works similar to standard deviation channel found on mt4 and mt5. It has 2 parameters: 1. Starting Bar 2. Number of bars for calculation The   starting bar   is the bar which drawing of the trend lines will begin, while the   number of bars for c
FREE
CosmiCLab SMC FIBO CosmiCLab SMC FIBO — это профессиональный торговый индикатор, основанный на концепциях Smart Money Concepts (SMC), анализе структуры рынка и уровнях Fibonacci. Индикатор автоматически определяет свинги рынка и строит уровни Fibonacci по последнему импульсному движению. Также индикатор определяет ключевые изменения структуры рынка: BOS — Break Of Structure CHOCH — Change Of Character Дополнительно отображаются сигнальные стрелки BUY / SELL при пробое структуры. Индикатор подход
Renko Builder GLX1
Eranga Thilina Dhanushka Gallage
GLX1 Renko Builder   Expert Advisor (EA) can create the Renko bar charts on any symbol. The Renko charts are generated as real-time custom symbol charts which can be further used for technical analysis with any MT5 compatible indicator.  Find the free   GLX1 Renko Euro   Expert Advisor from here.  https://www.mql5.com/en/market/product/115074 Included Features: Truly responsive Renko Charting on a custom symbol chart Accurate automatic live chart update Ability to attach any MT5 indicator Abi
Renko Chart
Marcin Konieczny
3.56 (9)
Индикатор Renko Chart позволяет отображать графики "ренко" в окне индикатора. Тип графиков "ренко" показывает лишь движения цены, большие заданного (box size). Он помогает устранить шум и сосредоточиться на основных трендах. При построении графика время не учитывается, используются лишь ценовые движения. По этой причине графики "Ренко" не похожи на графики цены. Индикатор работает в 2 режимах: CLOSE - при построении графика "ренко" используются только цены Close; HIGH_LOW - при построении график
FREE
Core Purpose ​ A permanent crosshair indicator designed exclusively for MetaTrader 5 (MT5). It addresses key limitations of MT5's default crosshair, including the need for manual activation, automatic disappearance on click, and solid lines obscuring price bars. This indicator optimizes chart analysis by delivering a smooth, professional-grade crosshair experience on MT5. ​ Key Features ​ Automatic activation: Enabled immediately after loading, replacing the default Ctrl+F function. The crossha
FREE
Introducing   Order Blocks Breaker , a brand-new way to identify and leverage order blocks in your trading strategy. After developing multiple order block tools with unique concepts, I’m proud to present this tool that takes things to the next level. Unlike previous tools,   Order Blocks Breaker   not only identifies order blocks but also highlights   Breaker Order Blocks —key areas where the price is likely to retest after a breakout. MT4 -  https://www.mql5.com/en/market/product/124101/ This t
Core function Intelligent transaction management one-click opening and closing operation, which supports user-defined lots to set multiple closing modes: all closing, closing by direction and closing by profit and loss status. Professional risk control, real-time risk monitoring and spread control to avoid high-cost trading environment. Visual control panel has an intuitive graphical interface, and all functions can be operated with one button to display position information, profit and loss sta
FREE
OpenAllSymbolsSafe.mq5 — Умный скрипт для MetaTrader 5 Назначение: Автоматически открывает графики всех символов из Обзора рынка с применением шаблона default.tpl на текущем таймфрейме (TF) , предварительно закрывая все открытые графики (кроме текущего). Идеален для быстрого анализа множества инструментов без рутинных действий! Особенности: Автоматизация: Экономит время — открытие десятков графиков в один клик. Безопасность: Аккуратно закрывает лишние графики, сохраняя текущий акти
FREE
Gold Trader Pro is an advanced analytical tool specifically engineered for professional trading on XAUUSD (Gold). It provides an immediate comprehensive overview of market structure across 7 different timeframes, allowing traders to identify flow direction and signal strength through a modern, draggable, and interactive interface. Key Features Multi-Timeframe Analysis: Real-time monitoring of M1, M5, M15, M30, H1, H4, and D1. Two Operational Modes: MODE_SCALPING: Optimized for fast-paced analys
FREE
FREE Prop Firm Navigator EA - Advanced Trend-Following & Protection Developed by the EA Trading Academy team using Expert Advisor Studio , this free trading robot combines powerful trend-following indicators with a robust set of account protection features to secure your trading capital. You can find a detailed documentation about the properties and inputs on our  knowledge base . Key Strategy Features: Uses Bulls Power and Awesome Oscillator indicators for precise entry signals Sophisticat
FREE
Daily Variation Indicator Daily Variation Indicator shows the percentage difference between the current price and the previous day close. The indicator displays the daily market movement directly on the chart, allowing traders to quickly identify whether the market is moving up or down during the current trading session. It is designed to be lightweight, minimal, and highly configurable while providing clear information about the daily price variation. Features • Displays daily percentage variat
Trade Launch   — это интуитивная торговая панель, созданная для трейдеров, которые ценят скорость и контроль при ручном открытии сделок. Она отображается непосредственно на графике и позволяет управлять всеми основными параметрами ордера в одном окне. Ключевые возможности: Мгновенное выставление ордеров:   Открывайте позиции Buy и Sell одним нажатием кнопки. Названия кнопок динамически отображают текущие цены Ask и Bid. Встроенный риск-менеджмент:   Удобные поля для ввода объема лота (Lot), а та
FREE
Order Book, известный также как Market Book, глубина рынка, стакан цен, Level 2, - это предоставляемая брокером динамически обновляемая таблица с данными по текущим объемам торговых заявок на покупку и продажу для различных уровней цен вблизи Bid и Ask конкретного финансового инструмента. MetaTrader 5 предоставляет возможность трансляции стакана цен , но только в реальном времени. Данный индикатор OrderBook Cumulative Indicator позволяет аккумулировать данные стакана онлайн и визуализировать их
Account Info EA It is a tool that presents on the graph all the positions of the account, and specific information concerning the positions, but also the account. It enables the user to have an image of his account at a glance. Use like any expert advisor. You can't attach it in the same chart with other expert advisor. It does not have the ability to open or manage positions. You can attach it on any chart and any timeframe.
FREE
Spread Times Histogram and Stats — индикатор мониторинга спреда для MetaTrader 5. Отображает цветную гистограмму спреда в реальном времени, отслеживает скользящее 24-часовое среднее и отправляет умные уведомления при превышении настраиваемого динамического порога. Основные возможности - Цветная гистограмма: зелёная при сужении спреда, красная при расширении - Скользящая 24-часовая средняя линия для постоянного контекста - Статистика сессии: минимальный, максимальный и средний спред - Умные уве
FREE
VR Color Levels — удобный инструмент для тех, кто применяет технический анализ с использованием таких элементов, как трендовая линия, прямоугольник и текст. Есть возможность добавлять текст непосредственно на график и делать скриншоты. Настройки, set файлы, демо версии, инструкции, решение проблем, можно получить в [блоге] Прочитать или написать отзывы можно по [ссылке] Версия для [MetaTrader 4] Работа с индикатором осуществляется в один клик . Для этого нужно нажать на кнопку с линией, после
FREE
ProTrade Technical Assistant Профессиональный индикатор технического анализа с автоматическим определением зон поддержки/сопротивления, обнаружением справедливых ценовых разрывов (FVG) и уровнями Фибоначчи. Назначение ProTrade Technical Assistant автоматически определяет и отображает ключевые элементы рыночной структуры непосредственно на вашем графике MT5: Зоны поддержки и сопротивления - автоматическое определение по экстремумам Справедливые ценовые разрывы (FVG) - обнаружение паттернов из 3 с
Basic Theme Builder: Упростите Настройку Ваших Графиков Измените ваш торговый опыт с помощью индикатора Basic Theme Builder , универсального инструмента, предназначенного для упрощения настройки внешнего вида графиков в MetaTrader 5. Этот интуитивно понятный индикатор предлагает удобную панель, которая позволяет легко переключаться между различными темами и цветовыми схемами, улучшая как визуальную привлекательность, так и функциональность вашей торговой среды. Free MT4 version Индикатор Basic
FREE
Ratio Indicator
Rafael Gazzinelli
5 (2)
Ratio Indicator - User Guide Special Deal! Leave a review and get the indicator  Long & Short Cointegration Analyzer for free — just send me a message! This Ratio indicator between assets allows you to monitor and trade the price relationship between two assets selected by the user. It calculates the ratio between the prices of two assets, referred to as Asset1 and Asset2 (e.g., "GBPUSD" and "EURUSD"), and plots a moving average of the ratio along with Bollinger Bands . These bands are used to
FREE
AP VWAP Bands Pro (MT5) Volume-weighted average price with ±σ bands for clear intraday bias, mean-reversion zones, and dynamic support/resistance. Works on crypto (incl. BTC) , FX , indices , and metals . Uses tick-volume when real volume isn’t available. What it shows VWAP line (volume-weighted mean price). Two envelopes around VWAP (default ±1σ and ±2σ) to highlight balance vs. extension. Reset modes : Day , Week , or Anchor Time (HH:MM) to start VWAP where you need it (e.g., exchange open).
FREE
Statistical Arbitrage Spread Generator for Cointegration [MT5] What is Pair Trading? Pair trading is a market-neutral strategy that looks to exploit the relative price movement between two correlated assets — instead of betting on the direction of the market. The idea? When two assets that usually move together diverge beyond a statistically significant threshold, one is likely mispriced. You sell the expensive one, buy the cheap one , and profit when they converge again. It’s a statistica
FREE
Gino Renko
Stephane, Andr Valette
1 (1)
Another renko-based indicator. It returns different usable values ​​for an EA, and is directly displayed on the main chart. Its setting is very simple: The size of the renko The number of bars taken into account The falling color The color on the rise Returned values: Buffer 0 : Value of the middle Buffer 1 : Value of the Top Buffer 2 : Value of the Bottom Buffer 3 : Direction of renko (0.0 for top ; 1.0 for bottom) Buffer 4 : Ratio of the renko, for example, if it is twice, 3 times, ro more of
Important Lines
Terence Gronowski
4.88 (24)
Индикатор отображает линии пивот, уровни максимума, минимума и закрытия предыдущего дня, а также минимум и максимум предыдущего часа. Нужно просто установить этот индикатор на график, чтобы отобразить все эти важные линии, нет необходимости настраивать множество отдельных индикаторов. Почему важны определенные линии Максимум и минимум предыдущего дня : эти уровни используются для торговли на дневном графике. Очень часто, если цена становится выше или ниже минимума/максимума предыдущего дня, про
FREE
This indicator will mirror the assets in use in another metatrader, being able to choose the timeframe and a template. This is the Metatrader 5 Client, it needs the Metatrader 4 or 5 Server versions: Metatrader 4 Mirror Chart Server:   https://www.mql5.com/en/market/product/88644 Metatrader 5 Mirror Chart Server: https://www.mql5.com/en/market/product/88652 Details of how it works in the video.
FREE
С этим продуктом покупают
Trade Assistant MT5
Evgeniy Kravchenko
4.42 (208)
Помогает рассчитать риск на сделку, простая установка нового ордера с помощью линий, управление ордерами с функциями частичного закрытия, 7 типов трейлинг-стопа и другие полезные функции. Дополнительные материалы и инструкции Инструкция по установке - Инструкция к приложению - Пробная версия приложения для демо счета Функция Линии   - отображает на графике линию открытия, стоп-лосс, тейк-профит. С помощью этой функции легко установить новый ордер и увидеть его дополнительные характеристики пе
Добро пожаловать в Trade Manager EA — лучший инструмент для управления рисками, предназначенный для упрощения, точности и эффективности торговли. Это не просто инструмент для размещения ордеров; это комплексное решение для удобного планирования торгов, управления позициями и усиленного контроля над рисками. Независимо от того, начинающий вы трейдер, опытный специалист или скальпер, нуждающийся в быстром исполнении, Trade Manager EA адаптируется к вашим потребностям и работает с любыми активами:
Local Trade Copier EA MT5
Juvenille Emperor Limited
4.96 (135)
Опыт экстремально быстрого копирования сделок с помощью Local Trade Copier EA MT5 . Благодаря простой установке в течение 1 минуты этот копировщик сделок позволяет вам копировать сделки между несколькими терминалами MetaTrader на одном компьютере с Windows или на Windows VPS с крайне быстрыми скоростями копирования менее 0.5 секунды. Независимо от того, новичок вы или профессиональный трейдер, Local Trade Copier EA MT5 предлагает широкий спектр опций, чтобы настроить его под ваши конкретные по
TradePanel MT5
Alfiya Fazylova
4.87 (151)
Trade Panel — это многофункциональный торговый помощник. Приложение содержит более 50 торговых функций для ручной торговли и позволяет автоматизировать большинство торговых операций. Внимание! Скидки действуют ограниченное время, каждый вторник цена будет повышаться на 5$ (до 100$). Перед покупкой вы можете протестировать демоверсию на демо-счете. Скачать пробную версию приложения для демонстрационного аккаунта: https://www.mql5.com/ru/blogs/post/750864 . Полная инструкция здесь . Торговля. Позв
Бета-версия Telegram to MT5 Signal Trader почти готов к официальному альфа-релизу. Некоторые функции все еще находятся в разработке, и вы можете столкнуться с небольшими ошибками. Если вы заметите проблемы, пожалуйста, сообщите о них, ваша обратная связь помогает улучшать программное обеспечение для всех. Telegram to MT5 Signal Trader — мощный инструмент, который автоматически копирует торговые сигналы из каналов и групп Telegram прямо в ваш счёт MetaTrader 5 . Поддерживаются как публичные, так
Farmed Hedge Yield Farming | All Markets (Manual - Hybrid - Semi/Automated EA) MULTI-ASSET SUPPORT Trade any asset available on your broker - Forex: Major, Minor, Exotic pairs - Crypto: BTC, ETH, XRP, SOL, BNB - Stocks: Apple, Tesla, Amazon, Google, etc. - Commodities: Gold, Silver, Oil, Gas - Indices: US30, NAS100, SPX500, DAX40 - Any CFD your broker offers VERIFIED TRADING RESULTS - Farmed Hedge Yield Axi Copy:  https://www.mql5.com/en/signals/2356376 - Farmed Hedge Yield Exn Copy:   https:/
Footprint Chart Pro — Professional OrderFlow EA for MetaTrader 5 Version 6.34 | Professional tool for real traders | Institutional-Grade Visualization DEMO USERS - PLEASE SELECT EVERY TICK / REAL TICK WHEN TESTING AND YOU HAVE DOWNLOADED HISTORICAL DATA. IF YOU SEE A WAITING SCREEN AND IT IS NOT DOWNLOADING, IT MEANS YOU HAVE LOW HISTORICAL DATA. TRY 1 MIN AND 5 MIN FIRST ON 1 DAY DATA. ONE DAY DATA SHOULD BE THE NEWEST AND MOST CURRENT DATE. PLEASE WAIT UNTIL THE MARKET HAS ROLLED OVER PERIOD.
Trade Dashboard MT5
Fatemeh Ameri
4.94 (121)
Tired of complex order placement and manual calculations? Trade Dashboard is your solution. With its user-friendly interface, placing orders becomes effortless, by a single click, you can open trades, set stop loss and take profit levels, manage trade lot size, and calculate risk to reward ratios, allowing you to only focus on your strategy. Say goodbye to manual calculations and streamline your trading experience with Trade Dashboard. Download  Demo Version  right now. You can find  Details of
Exp COPYLOT CLIENT for MT5
Vladislav Andruschenko
3.82 (34)
Профессиональный копировщик сделок для MetaTrader 5 Быстрый, профессиональный и надежный копировщик сделок для MetaTrader . COPYLOT позволяет копировать сделки Forex между терминалами MT4 и MT5 с поддержкой счетов Hedge и Netting . Версия COPYLOT для MT5 поддерживает: - MT5 Hedge → MT5 Hedge - MT5 Hedge → MT5 Netting - MT5 Netting → MT5 Hedge - MT5 Netting → MT5 Netting - MT4 → MT5 Hedge - MT4 → MT5 Netting Версия MT4 Полное описание + DEMO + PDF Как купить Как установить Как получить файлы жур
Trade copier MT5
Alfiya Fazylova
4.58 (40)
Trade Copier — это профессиональная утилита, предназначенная для копирования и синхронизации сделок между торговыми счетами. Копирование происходит от счета/терминала поставщика к счету/терминалу получателя, которые установлены на одном компьютере или vps. АКЦИЯ - Если вы уже приобрели "Trade copier MT5", вы можете получить "Trade copier MT4" бесплатно (для копирования MT4 > MT5 и MT4 < MT5). Для получения более подробной информации об условиях, пожалуйста, свяжитесь с нами через личные сообщени
Timeless Charts
Samuel Manoel De Souza
5 (3)
Timeless Charts is an advanced charting solution designed for professional traders seeking for custom charts / custom timeframes , including seconds charts / seconds timeframe, renko charts / renko bars, cluster charts / footprint charts and advanced tools present in most of the popular platforms. Unlike traditional offline charts or simplistic custom indicators, this solution constructs fully custom bars with true timestamp accuracy , down to miliseconds, allowing for a powerful and precise tr
Copy Cat More Trade Copier MT5 (Копи-Кот MT5) — это локальный торговый копировщик и полная система управления рисками и исполнения, разработанная для современных торговых задач. От испытаний проп-фирм до управления личным портфелем, он адаптируется к любой ситуации с сочетанием надежного исполнения, защиты капитала, гибкой настройки и продвинутой обработки сделок. Копировщик работает как в режиме Мастер (отправитель), так и в режиме Слейв (получатель), с синхронизацией в реальном времени рыночны
MT5 to Telegram Signal Provider — это простой в использовании полностью настраиваемый инструмент, который позволяет отправлять определённые сигналы в чат, канал или группу Telegram, превращая вашу учётную запись в провайдера сигналов . В отличие от большинства конкурирующих продуктов, он не использует импорт DLL. [ Демо ]   [ Руководство ] [ Версия MT4 ] [ Версия для Discord ] [ Канал в Telegram ]  New: [ Telegram To MT5 ] Настройка Доступно пошаговое руководство пользователя . Никаких знаний A
The News Filter MT5
Leolouiski Gan
4.77 (22)
Этот продукт фильтрует всех экспертных советников и ручные графики во время новостей, так что вам не нужно беспокоиться о внезапных скачках цены, которые могут разрушить ваши ручные торговые настройки или сделки, введенные другими экспертными советниками. Этот продукт также поставляется с полной системой управления ордерами, которая может обрабатывать ваши открытые позиции и ордера на ожидание перед выпуском новостей. После покупки   The News Filter   вам больше не придется полагаться на встроен
HINN MAGIC ENTRY - лучший инструмент для входа и менеджмента позиций! Выставляет ордера через выбор уровня на графике! полное описание    ::    demo-версия    ::   60-sec-video-description Основные функции: - Рыночные, лимитные и отложенные ордера -  Автоматический подсчет лоттажа  -  Автоматический учет спреда и комиссий -  Неограниченное количество промежуточных тейков для позиций - Перевод в безубыток и трейл стоп-лосса и тейк-профита - Уровни инвалидаций - Интуитивно понятный,  адаптивный,
Ultimate Extractor - Professional Trading Analytics for MT5 *****this is the local HTML version of Ultimate Extractor. !!!!!it is not compatible with Cloud!!!! For the online version please reach out to me directly****** Ultimate Extractor transforms your MetaTrader 5 trading history into actionable insights with comprehensive analytics, interactive charts, and real-time performance tracking. What It Does Automatically analyzes your MT5 trading history across all Expert Advisors and generates
AntiOverfit PRO: неудобная правда о бэктестах Прежде чем покупать этого EA, остановитесь на минуту. Вы только что нашли систему, которая обещает 250% в год. Бэктест выглядит впечатляюще. Продавец просит $399, а может и $1,999. На бумаге всё выглядит идеально. Но есть проблема: этот бэктест не доказывает того, что вы думаете. Исторический тест сам по себе почти ничего не доказывает. Единственное, что он подтверждает, — эта логика сработала в одной конкретной рыночной последовательности. Как толь
The product will copy all telegram signal to MT5 ( which you are member) , also it can work as remote copier.  Easy to set up, copy order instant, can work with almost signal formats, image signal,  s upport to translate other language to English Work with all type of channel or group, even channel have "Restrict Saving Content", work with  multi channel, multi MT5 Work as remote copier: with signal have ticket number, it will copy exactly via ticket number. Support to backtest signal. How to s
Custom Alerts AIO: Универсальный сканер рынка — Без настройки Обзор Custom Alerts AIO — это самый быстрый и простой способ отслеживать рыночные сигналы в реальном времени на множестве инструментов без дополнительной настройки и без необходимости покупать другие продукты. В состав входят все необходимые индикаторы от Stein Investments, что делает этот инструмент идеальным решением «всё в одном» для трейдеров, ценящих простоту и эффективность. Просто установите на график и сразу получайте сигнал
Сканируйте весь список наблюдения на экстремальные бары - в реальном времени. Power Bar Scanner отслеживает все ваши символы одновременно и оповещает вас в момент появления экстремального ценового бара. Больше не нужно переключаться между графиками. Все возможности в одной панели. Работает на любом таймфрейме. Forex, индексы, золото, крипто - все в одном окне. Как это работает Сканер проверяет каждый символ в вашем Market Watch на наличие баров, где тело свечи превышает N x ATR . Когда такой ба
Trade Manager DashPlus
Henry Lyubomir Wallace
5 (13)
DashPlus – это продвинутое средство для управления торговлей, разработанное для повышения эффективности и результативности торговли на платформе MetaTrader 5. Оно предлагает широкий набор функций, включая расчет рисков, управление ордерами, продвинутые системы сеток, инструменты на основе графиков и аналитику производительности. Основные функции Восстановительная Сетка Внедряет систему усреднения и гибкую сетку для управления сделками в неблагоприятных рыночных условиях. Позволяет стратегически
Risk Manager for MT5
Sergey Batudayev
4.31 (16)
Советник Риск Менеджер для МТ5, очень важная и по моему мнению необходимая программа для каждого трейдера. С помощью данного советника вы сможете контролировать  риск на вашем торговом счету. Контроль риска и прибыли может осуществляться как в  денежном $ эквиваленте так и в % процентном. Для работы советника просто прикрепите его на график валютной пары и выставите значения допустимого риска в валюте депозита или в % от текущего баланса.   [ Инструкция с описанием настроек ] Функции советника
Telegram to MT5: Идеальное решение для копирования сигналов Упростите свою торговлю с Telegram to MT5 — современным инструментом, который копирует торговые сигналы прямо из каналов и чатов Telegram на вашу платформу MetaTrader 5, без необходимости использования DLL. Это мощное решение обеспечивает точное исполнение сигналов, широкие возможности настройки, экономит время и повышает вашу эффективность. [ Instructions and DEMO ] [ FAQ ] Ключевые возможности Прямая интеграция с Telegram API Аутенти
Trade Manager DaneTrades
Levi Dane Benjamin
4.36 (28)
Trade Manager, который поможет вам быстро входить и выходить из сделок, автоматически рассчитывая риск. Включает функции, которые помогут предотвратить чрезмерную торговлю, торговлю из мести и эмоциональную торговлю. Сделками можно управлять автоматически, а показатели эффективности счета можно визуализировать в виде графика. Эти функции делают эту панель идеальной для всех трейдеров, занимающихся ручной торговлей, и помогают улучшить платформу MetaTrader 5. Многоязычная поддержка. Версия для МТ
Grid Manual MT5
Alfiya Fazylova
4.9 (21)
Grid Manual — это торговая панель для работы с сеточными стратегиями. Утилита универсальная, имеет гибкие настройки и понятный интерфейс. Работает с сеткой ордеров не только в сторону усреднения убытков, но и в сторону наращивания прибыли. Трейдеру не нужно создавать и сопровождать сетку ордеров, это сделает утилита. Достаточно открыть ордер и Grid manual автоматически создаст ему сетку ордеров и будет сопровождать его до самого закрытия. Полная инструкция и демо-версия здесь . Основные особенно
Poc Breakout Signal: The Ultimate Institutional Order Flow & Price Action System Elevate your trading with Poc Breakout, a comprehensive technical analysis tool designed to bridge the gap between retail trading and institutional market understanding. This all-in-one system combines powerful Buy/Sell signals, advanced Volume Profile analysis, real-time Order Flow (Depth of Market), and critical macroeconomic data to give you a clear, unambiguous edge in the markets. Poc Breakout Signal decodes c
The Ultimate TradingView to MT5 Bridge Automation Прекратите торговлю вручную и избавьтесь от проблем с задержками. TradingView to MT5 Copier PRO — это самый быстрый и надежный мост для исполнения ваших алертов TradingView напрямую в MetaTrader 5. Используете ли вы пользовательские индикаторы, скрипты тестера стратегий или ручную разметку, этот советник (EA) мгновенно исполняет ваши сделки, используя технологию High-Speed WebSocket . В отличие от простых копировщиков, эта PRO-версия включает Are
EA Portfolio Analyzer
Jimmy Peter Eriksson
4 (1)
Инструкция по установке:    Нажмите здесь! Анализ нескольких экспертных советников одновременно. Сравните результаты работы советников по «магическому числу». Отслеживание прибыльности и просадок Фильтрация результатов по диапазону дат Кривая визуальной привлекательности и подробные метрики Готов к использованию менее чем за минуту. EA Portfolio Analyzer EA Portfolio Analyzer — это   профессиональный аналитический инструмент   , предназначенный для мониторинга   текущей эффективности работы нес
Cerberus Equity Watcher
Samuel Bandi Roccatello
5 (3)
Cerberus the Equity Watcher — это инструмент управления рисками, который постоянно отслеживает средства на вашем счете и позволяет избежать крупных просадок, вызванных неисправными советниками или вашим эмоциональным поведением, если вы являетесь дискреционным трейдером. Это чрезвычайно полезно для систематических трейдеров, которые полагаются на советники, которые могут содержать ошибки или могут плохо работать в неожиданных рыночных условиях. Cerberus позволяет вам установить минимальное значе
Ограниченное предложение: скидка 20% действует всего несколько дней!  - годовая подписка 360 вместо 450 $  - лайфтайм тариф 550 вместо 690 $ Суть: используя юзер-интерфейс вы настраиваете параметры, которым должен соответствовать график до входа в позицию(позиции), настраиваете какие входные модели использовать, настраиваете правила по которым надо завершать торговлю и планирование. А всю рутину по наблюдению за графиком и исполнению  Lazy Trader  берет на себя. полное описание  :: 3 ключевых в
Другие продукты этого автора
This product can be used to synchronize multiple Charts, and each Chart can be set to a different sync mode. With this product you can better view and manipulate charts: different time frames for a single Symbol, the same time frame for multiple Symbols... and more. PS: The link below is the FreeDemo product, you can use it on EURUSD/XUAUSD/USDCNH symbol: https://www.mql5.com/en/market/product/38557 Feature: Chart settings  can be synchronized, including : background, indentation, size, etc. M
This product can be used to synchronize multiple Charts, and each Chart can be set to a different sync mode. With this product you can better view and manipulate charts: different time frames for a single Symbol, the same time frame for multiple Symbols, system indicators for single/multiple Symbols... and more. Feature: Chart settings can be synchronized, including : background, indentation, size, etc. Multiple Chart window start times  or end times can be synchronized. Multiple Chart time fr
Have you ever take a long time to watch a Symbol when the network link is not good ? Have you ever wait for a long time when you switch chart between different Symbols or different TimeFrames ? If you do long-term backtesting , Have you ever to be downloaded datas for a long time ? Yes, If there is no data in the system, those will happen.  1. What is this: Download all the Symbol data in Market Watch to the system. PS: This is not outputting data to Files. This Link go to Demo version: https:/
Do you think it's a bit cumbersome when you need to switch symbols or timeframes with mouse click? 1. What is this? This is a program that can switch symbols and timeframes with direction keys. Fast switching, very convenient, no mouse click required. For traders, one symbol with multi-timeframe charts are usually added,  you can change symbol on those charts easily. For multi-currency traders, different symbol charts are usually added, you can also change those timeframes easily. I wrote this p
1. What is this         Rising volatility and falling volatility are not the same, whether it is academic research or actual testing has shown this point.         The original ATR indicator is calculated by putting up and down fluctuations together. This indicator is to calculate separately the upward volatility and the downward volatility, which can better help you study the market. 2. Indicator description          There are two modes for the calculation of this indicator, as shown in the fo
I see that many tools in the market deal with Position and Order in the form of operation panels. Which is loaded into a Chart in the form of an EA. However, once the operator panel EA is loaded, no other EAs can be loaded. So, I wrote the one-click operation of Position and Order as a script, so you can load other EAs and easily complete one-click operation of Trade. 1. What is this: This is a one-click script to close position order. Now you can close position tickets at high speed, for examp
Do you think it's a bit cumbersome when you need to switch symbols or timeframes with mouse click? 1. What is this? This is a program that can switch symbols and timeframes with direction keys. Fast switching, very convenient, no mouse click required. For traders, one symbol with multi-timeframe charts are usually added,  you can change symbol on those charts  easily . For multi-currency traders, different symbol charts are usually added, you can also change those timeframes easily. I wrote thi
According to trading experience: Some symbols are easy to reverse on certain days, such as Monday, or afternoon, and so on. So comparing the current price with the corresponding historical moment price is valuable. If the price coordinate system uses a logarithmic price, you will get a lot of valuable information. 1. What is this? This program can convert the symbol price and add it to your Chart. You can compare it with your major chart. The DEMO version Link: https://www.mql5.com/en/market/pr
What is this: Violent trading: means sending a large number of orders to your brokerage server,  it can conduct a stress test of the trading. In this program you can run a variety of trading tests.  Now you can trade at high speed, For example 1000 orders in an instant. The Demo version's link:  https://www.mql5.com/en/market/product/38431/ Why to use: Whether manual trading or EA trading,  the status of the broker server is very important. So it is beneficial to conduct a trading stress test on
1. Why did I develop this series of indicators I found that most traders need to use multiple time frame indicators. They usually switch time frame to see indicators. However, once the timeframe is switched, you cannot see the  corresponding relationship  between  the price in the smaller timeframe  and  the indicator in the larger timeframe . For example: if your price chart is in H1 timeframe, you can see H4, D1 and W1 indicators in H1 timeframe Chart. This is more helpful for you to find th
Фильтр:
[Удален] 2019.02.14 14:59 
 

Пользователь не оставил комментарий к оценке

[Удален] 2019.02.14 14:08 
 

Пользователь не оставил комментарий к оценке

Ответ на отзыв