TriX MoreTimeFrame

1. Why did I develop this series of indicators

I found that most traders need to use multiple time frame indicators. They usually switch time frame to see indicators.

However, once the timeframe is switched, you cannot see the corresponding relationship between the price in the smaller timeframe and the indicator in the larger timeframe.

For example: if your price chart is in H1 timeframe, you can see H4, D1 and W1 indicators in H1 timeframe Chart. This is more helpful for you to find the structural change of price, so as to better help you make decisions.

2. What is this

MT5 has many system built-in indicators, such as trend, ocillators, volumes, and Bill Williams. They are all commonly used. And they can meet the needs of most traders.

For all these built-in indicators, I have all developed the multi timeframe version. Any indicator you can switch the time frame through the GUI. So you can choose what you need.

3. How to use

Add the indicator to Chart and you will see the GUI.

  • Up button means switching to a higher time frame;
  • Down button means switching to a lower time frame;
  • Refresh button means refreshing, because sometimes your MT5 needs to load and download symbol price data, Refresh button can show indicators faster.

4. Parameter Description

General parameters:

  • Input_ForexName="";                          // Input your symbol. Default is Chart Symbol.
  • Input_TimeFrame=PERIOD_CURRENT;  // Choose TimeFrame. Default is Chart TimeFrame.
  • TimeModeAll=true;                             // Whether to use all TimeFrame: m1/m2/m3/m4/.../H1/H2/H3/H4/......
  • GUICorner = CORNER_RIGHT_UPPER;   // the corner of GUI. Usually you don't need to change it. 

Specific parameters:
  • Parameters equivalent to system built-in indicators, very simple and easy to understand.

5. Other instructions

You can choose the indicators you like. Due to word limit on web pages, below are the links to the category of current indicator.

The indicators are divided into DEMO version and unlimited version. The DEMO version is free and can only be used for EURUSD / AUDUSD / GBPUSD / NZDUSD / USDCHF / USDJPY / USDCAD / XAUUSD. 

Thanks!


DEMO Unlimited
Oscillators ATR _MoreTF https://www.mql5.com/en/market/product/45113

BearsPower_MoreTF https://www.mql5.com/en/market/product/45115

BullsPower_MoreTF https://www.mql5.com/en/market/product/45117

CCI_MoreTF https://www.mql5.com/en/market/product/45119

Chaikin_MoreTF https://www.mql5.com/en/market/product/45121

DeMarker_MoreTF  https://www.mql5.com/en/market/product/45123

Force_MoreTF https://www.mql5.com/en/market/product/45125

MACD_MoreTF

https://www.mql5.com/en/market/product/45127

Momentum_MoreTF https://www.mql5.com/en/market/product/45129

OsMA_MoreTF https://www.mql5.com/en/market/product/45131

RSI_MoreTF https://www.mql5.com/en/market/product/45133

RVI_MoreTF https://www.mql5.com/en/market/product/45135

Stochastic_MoreTF https://www.mql5.com/en/market/product/45137

TriX_MoreTF https://www.mql5.com/en/market/product/45139

WPR_MoreTF https://www.mql5.com/en/market/product/45141


Volumes AD_MoreTF https://www.mql5.com/en/market/product/45143


Trend ADX_MoreTF https://www.mql5.com/en/market/product/45151

Ichimoku 
https://www.mql5.com/en/market/product/45164

BillWilliams  AC_MoreTF  https://www.mql5.com/en/market/product/45102


Рекомендуем также
1. Why did I develop this series of indicators I found that most traders need to use multiple time frame indicators. They usually switch time frame to see indicators. However, once the timeframe is switched, you cannot see the  corresponding relationship  between  the price in the smaller timeframe  and  the indicator in the larger timeframe . For example: if your price chart is in H1 timeframe, you can see H4, D1 and W1 indicators in H1 timeframe Chart. This is more helpful for you to find th
Why use it A simple, readable rule: the EA trades when the MACD and its signal line both cross the zero line. Every position gets a stop loss and a take profit when you set them. Daily gain and daily loss limits in money: when one is hit, the EA closes its positions and stops for the day. A trading-hours window, plus a clear message if the volume does not fit the symbol. How the rule works MACD is calculated on every tick and the EA keeps the last three values. When the latest MACD value is abo
FREE
1. Why did I develop this series of indicators I found that most traders need to use multiple time frame indicators. They usually switch time frame to see indicators. However, once the timeframe is switched, you cannot see the  corresponding relationship  between  the price in the smaller timeframe  and  the indicator in the larger timeframe . For example: if your price chart is in H1 timeframe, you can see H4, D1 and W1 indicators in H1 timeframe Chart. This is more helpful for you to find th
Core Scalper RSI
Ignacio Agustin Mene Franco
CORE SCALPER RSI A gold scalper that trades in the direction of momentum Core Scalper RSI gauges market strength using the RSI indicator, triggering only when momentum is clearly leaning in one direction. Designed for XAUUSD on the M5 timeframe—where gold moves rapidly and every second counts. The concept in 3 steps 1️⃣ Take the pulse The RSI determines who’s in control: if the momentum is bullish, it enables buy trades; if bearish, it enables sell trades. If the market is indec
1. Why did I develop this series of indicators I found that most traders need to use multiple time frame indicators. They usually switch time frame to see indicators. However, once the timeframe is switched, you cannot see the  corresponding relationship  between  the price in the smaller timeframe  and  the indicator in the larger timeframe . For example: if your price chart is in H1 timeframe, you can see H4, D1 and W1 indicators in H1 timeframe Chart. This is more helpful for you to find th
MACD Signal Pro
Albert Kassina Diatta
5 (1)
MACD Signal Pro – Многовременной сканер MACD Signal Pro – это продвинутый индикатор, разработанный для трейдеров, которым нужны четкие, отфильтрованные и подтвержденные сигналы на разных таймфреймах. Он сочетает в себе мощь классического MACD с интеллектуальным многовременным сканером, отображаемым в современном визуальном интерфейсе, чтобы избежать ложных сигналов и повысить точность входа. Идеально подходит для Форекс, индексов, криптовалют и металлов. ОСНОВНЫЕ ХАРАКТЕРИСТИКИ
FREE
Super MACD Pro
Ebrahim Mohamed Ahmed Maiyas
5 (7)
The expert uses 3 MACD indicators to open trades. Advantages of the expert : You have full control over all three indicators. Use advanced stop loss and advanced trade closing. Risk Management. You can use the Grid . You can handle the news. You can control the number of trades and the conditions for opening a trade such as (Margin Limit , Spread Limit , Slippage , Timer Interval , Magic Number) It is preferable to use a small time frame.
FREE
1. Why did I develop this series of indicators I found that most traders need to use multiple time frame indicators. They usually switch time frame to see indicators. However, once the timeframe is switched, you cannot see the  corresponding relationship  between  the price in the smaller timeframe  and  the indicator in the larger timeframe . For example: if your price chart is in H1 timeframe, you can see H4, D1 and W1 indicators in H1 timeframe Chart. This is more helpful for you to find th
Breadwinner EMA Pro
Isidro Jr Rosalada Dadula
Автоматическая торговля на Форекс с акцентом на управление рисками Это автоматический перевод на ваш язык. Пожалуйста, учтите, что возможны некоторые ошибки. (Обновленные файлы настроек в сообществе DFX MQL5, ссылка ниже) Раскройте потенциал EMA кроссоверов с дисциплинированным подходом к прибыльности EMA Pro от DFX - это мощный и удобный в использовании экспертный советник (EA) для автоматизации ваших торговых стратегий на Форекс. Он построен на проверенной стратегии кроссовера EMA (экспонен
Этот мультитаймфреймовый индикатор продолжает традиции Giant на платформе MT5. Он основан на авторских индикаторах, которые собирают сигналы с разных графиков. Очень часто цена начинает двигаться в указанном направлении через несколько минут. Частое повторение сигналов в одном направлении говорит о сложившемся тренде. Сигналами для трейдера являются стрелки на графике и алерты. Всё настроено для торговли. Необходимо только указать нужную валютную пару. Рекомендуется устанавливать индикатор на
1. Why did I develop this series of indicators I found that most traders need to use multiple time frame indicators. They usually switch time frame to see indicators. However, once the timeframe is switched, you cannot see the  corresponding relationship  between  the price in the smaller timeframe  and  the indicator in the larger timeframe . For example: if your price chart is in H1 timeframe, you can see H4, D1 and W1 indicators in H1 timeframe Chart. This is more helpful for you to find th
Бесплатный MACD с пропорциями Фибоначчи для внутридневных трендов. Нужны оповещения и полный набор? MACD Intraday Trend PRO MACD Intraday Trend - это индикатор, разработанный на основе адаптации оригинального MACD, созданного Джеральдом Аппелем в 1960-х годах. За годы торговли было замечено, что, изменяя параметры MACD с пропорциями Фибоначчи, мы достигаем лучшего представления непрерывности движений тренда, что позволяет более эффективно определять начало и конец ценового тренда. Благодаря св
FREE
1. Why did I develop this series of indicators I found that most traders need to use multiple time frame indicators. They usually switch time frame to see indicators. However, once the timeframe is switched, you cannot see the  corresponding relationship  between  the price in the smaller timeframe  and  the indicator in the larger timeframe . For example: if your price chart is in H1 timeframe, you can see H4, D1 and W1 indicators in H1 timeframe Chart. This is more helpful for you to find th
Il WaveForce Indicatorsu un sistema di doppia envelope esponenziale e smussamento dinamico, WaveForce separa matematicamente l'energia rialzista e ribassista, tracciando due curve (Bull e Bear) e una linea di segnale centrale. Questo consente al trader di percepire con chiarezza quale delle due forze stia guidando il mercato.  Caratteristiche principali: Calcola la pressione rialzista e ribassista separatamente Include una linea di segnale EMA adattiva per confermare inversioni Oscillatore fluid
FREE
Caicai L&S Yield Histogram Important Notice: This indicator is an integral tool of the automated EA Caicai Long and Short Pair Trading . This indicator visually displays the percentage deviation (Yield %) of a pair's current spread relative to its own historical mean. It is an excellent tool for quickly visualizing the gross financial potential of a market distortion in Long & Short operations. Main Features: Percentage Visualization: Understand the size of the distortion in palpable percentage
KT Psar Arrows MT5
KEENBASE SOFTWARE SOLUTIONS
5 (1)
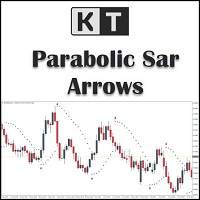
KT Psar Arrows строит стрелки на графике с использованием стандартного индикатора Parabolic SAR. Восходящая стрелка отображается, когда максимум свечи касается линии SAR. Нисходящая стрелка появляется, когда минимум свечи касается линии SAR. Сигналы генерируются в реальном времени без ожидания закрытия бара.  Особенности Полезный инструмент для трейдеров, которые хотят экспериментировать с торговыми стратегиями, включающими использование индикатора Parabolic SAR.  Можно использовать для поиска
TVSM – TREND VOLUME STRUCTURE MATRIX Institutional Trend, Volume & Market Structure Analysis for MetaTrader 5 TVSM – Trend Volume Structure Matrix is a professional market-reading indicator developed for traders who want to combine trend direction, volume, structural price zones, VWAP context and multi-timeframe analysis in a single clean interface. Instead of relying on a single moving average or isolated signal, TVSM analyzes several market dimensions simultaneously to identify the dominant
FREE
TrendSync MACD Pro Zero Lag MACD signals, synchronized with the higher-timeframe trend, with a live multi-timeframe panel. Non-repainting. For MetaTrader 5. The classic MACD lags, so its crossovers often arrive after a move has already started. TrendSync MACD Pro rebuilds the MACD with a Zero Lag smoothing technique for earlier, cleaner crossovers, and then synchronizes those signals with the higher-timeframe trend so you stay on the right side of the dominant move. A built-in multi-timeframe
FREE
С этим продуктом покупают
Trend Sniper X
Sarvarbek Abduvoxobov
4.86 (44)
Trend Sniper X — это трендовый индикатор для MetaTrader 5, работающий на нескольких таймфреймах, который помогает трейдерам точно и ясно определять направление тренда и потенциальные точки разворота. для MT4: https://www.mql5.com/en/market/product/193245 Информация о цене: Текущая цена является промо-ценой и может измениться по мере выхода предстоящих обновлений и новых функций. Бонусное предложение: Чтобы получить БЕСПЛАТНЫЙ авто-трейд советник Assistant EA для этого индикатора, пожалуйста, на
Новый король в городе — Индикатор + управление ордерами (TP1 + TP2 + TP3) + опциональный Telegram-сигнал-сендер ВКЛЮЧЁН (БЕСПЛАТНО) (ПОЛНОЦЕННАЯ ТОРГОВАЯ И СИГНАЛЬНАЯ СИСТЕМА) Gold Slayer EA Этот индикатор включает в себя продвинутую стратегию, торговую систему с настраиваемым управлением ордерами и систему mean reversion, которая сочетает расширения Envelope и поддерживается несколькими интеллектуальными фильтрами подтверждения, такими как RSI, для поиска высоковероятных точек разворота с сигн
Smart Trend Trading System — MetaTrader 5 После покупки напишите мне на MQL5, чтобы БЕСПЛАТНО получить Smart Universal Expert Advisor, а также доступ к онлайн-курсу, руководство в формате PDF и доступ к закрытой группе. STTS объединяет направление тренда, сигналы входа и выхода, зоны разворота и важные ценовые уровни прямо на графике. Торгуйте по системе вручную или подключите отдельный совместимый советник для автоматического исполнения с выбранными вами настройками. ОДНА СИСТЕМА. ЧЕТЫРЕ ТОРГОВ
Zoryk Gold
Reda El Koutbane
4.79 (19)
Скидка заканчивается через 24 часа — следующая цена $ 69 ZORYK — продвинутая сигнальная система для XAUUSD в MetaTrader 5 Вам знакомо это чувство. Вы долго анализируете золото. Ждёте подходящего момента для входа. Наконец открываете сделку — и цена сразу начинает двигаться против вас. Вы закрываете позицию слишком рано, передвигаете Stop Loss или сомневаетесь всего несколько секунд. После этого рынок достигает именно той цели, которую вы ожидали изначально, но уже без вас. Проблема не всегда за
Получите своё торговое преимущество в поле зрения! M5 Sniper — это новый индикатор от MeanFX. Он сочетает точные торговые сигналы с адаптивными уровнями TP/SL — в результате создавая лучшие возможные статистические сделки! Цена увеличивается каждые 5 покупок, следующая цена — 69$ Напишите мне после покупки, чтобы получить советы/руководство и бонусного EA Что выделяет его среди других? Проверенная статистическая эффективность на Gold XAUUSD ( работает практически на каждом активе , с акцентом н
Entry Points Pro показывает, где входить, где ставить стоп и каким лотом торговать — до того, как вы поставите ордер. ЦЕНА Сейчас 199 USD: 10 копий по этой цене, затем 249 USD. Финальная цена — 349 USD. Я зарабатываю торговлей на рынке и показываю это, поэтому мне не нужно продавать этот индикатор всем подряд. Это инструмент для трейдеров, которые думают своей головой, а не волшебная кнопка. Нет пробоя — нет сделки. Серая стрелка — отменённый сигнал: цена не пробила сигнальную свечу, значит,
ULTRA - это технический индикатор, который который работает по принципу “Все включено” - самостоятельно анализирует рынок, дает торговые сигналы, показывает уровни для установки стоп лосс, а также подсказывает когда нужно закрывать сделки, чтобы получить профит или минимизировать убыток. То есть, не важно, что ты не умеешь анализировать рынок, определять уровни - где поставить SL или плохо совладаешь с мани-менеджментом. ULTRA все это сделает вместо тебя! БОНУС ДЛЯ ПОКУПАТЕЛЯ : После покупки ULT
Gann Made Easy   - это профессиональная, но при этом очень простая в применении Форекс система, основанная на лучших принципах торговли по методам господина У.Д. Ганна. Индикатор дает точные BUY/SELL сигналы, включающие в себя уровни Stop Loss и Take Profit. ПОЖАЛУЙСТА, СВЯЖИТЕСЬ СО МНОЙ ПОСЛЕ ПОКУПКИ, ЧТОБЫ ПОЛУЧИТЬ ТОРГОВЫЕ ИНСТРУКЦИИ И ОТЛИЧНЫЕ ДОПОЛНИТЕЛЬНЫЕ ИНДИКАТОРЫ БЕСПЛАТНО! Вероятно вы уже не раз слышали о торговли по методам Ганна. Как правило теория Ганна отпугивает от себя не только
SuperScalp Pro
Van Minh Nguyen
4.54 (37)
SuperScalp Pro - Professional Multi-Layer Confluence Scalping System SuperScalp Pro — это продвинутый индикатор для скальпинга, который расширяет возможности классического Supertrend с помощью нескольких интеллектуальных фильтров подтверждения. Он помогает выявлять торговые возможности Buy/Sell с более высокой вероятностью успеха и значительно сокращать количество ложных сигналов. Чёткие стрелки Buy и Sell отображаются непосредственно на графике вместе с автоматически рассчитываемыми в реальном
GoldenX Entry MT5
VividMind Digital Solutions
5 (17)
GoldenX Entry — это индикатор для MT5 с адаптивным алгоритмом Smart Entry Trend, системой оценки сигналов, детектором рыночных режимов и фильтром волатильности. Каждый сигнал включает рассчитанный уровень входа, три уровня Take-Profit (TP1, TP2, TP3) и уровень Stop-Loss. Он построен на нескольких аналитических слоях, предназначенных для адаптации к различным рыночным условиям, объединяя многоуровневую аналитическую систему со встроенным оптимизатором и системой статистического отслеживания. Инди
Gold Trend Coach MT5
Cristhian Alexander Gaibor Cuasquer
4.27 (11)
Сигналы на покупку и продажу по золоту (XAUUSD) для MetaTrader 5 без перерисовки. У каждого сигнала есть stop loss и три take profit. Фильтр Smart Money Concepts с BOS и CHoCH, чтобы вы торговали по структуре, а не против неё. Живой Ментор на панели ведёт вас на каждом шаге, от входа до TP3. И алерты прямо на телефон и в ваш собственный Telegram-канал. Это Gold Trend Coach. Больше никакой торговли в одиночку. БЕСПЛАТНЫЙ НАБОР ПОКУПАТЕЛЯ к вашей покупке: 1. Telegram Alert Bridge: ваши сигналы пр
SMC Intraday Formula
VividMind Digital Solutions
5 (26)
Давайте сначала будем честны. Ни один индикатор сам по себе не сделает вас прибыльным. Если кто-то говорит вам обратное — он продаёт вам мечту. Любой индикатор, который показывает идеальные стрелки покупки/продажи, можно сделать безупречным — просто увеличьте нужный участок истории и сделайте скриншот успешных сделок. Мы так делать не будем. SMC Intraday Formula — это инструмент. Он считывает структуру рынка за вас, определяет зоны с наивысшей вероятностью движения цены и точно показывает, как
Boba Analysis Suite
Trade Ready Solutions LLC
5 (2)
Boba Analysis Suite Boba Analysis Suite — аналитический индикатор для MetaTrader 5. Он объединяет структуру рынка, значимые ценовые зоны и общий рыночный контекст в одном представлении на графике. Индикатор разработан на основе практического опыта трейдера и наставника по трейдингу. Он помогает выстроить последовательный процесс анализа: оценивать направление рынка, определять важные уровни и рассматривать несколько таймфреймов в совокупности. Анализ с учётом контекста Значение отдельных сигнало
Следующее обновление — версия 2.52 уже скоро! [НОВОЕ] Приготовьтесь к 4 новым важным функциям, призванным улучшить ваш анализ рынка и торговый процесс. Мы выводим анализ рынка на новый уровень с помощью 4 новых функций, разработанных с учётом ваших потребностей в трейдинге. Представляем: 1. TRADE OVERVIEW DASHBOARD 2. CONFLUENCE AT ZONE 3. STRONG & WEAK HIGH/LOW 4. OTE 1. TRADE OVERVIEW DASHBOARD Панель, которая помогает легче понимать общую картину рынка, предоставляя рекомендации для поддержк
FX Power: Анализируйте силу валют для более эффективной торговли Обзор FX Power — это ваш незаменимый инструмент для понимания реальной силы валют и золота в любых рыночных условиях. Определяя сильные валюты для покупки и слабые для продажи, FX Power упрощает принятие торговых решений и выявляет высоковероятные возможности. Независимо от того, хотите ли вы следовать за трендами или предсказывать развороты с использованием экстремальных значений дельты, этот инструмент идеально адаптируется под
M1 SNIPER   — это простая в использовании торговая система. Это стрелочный индикатор, разработанный для тайм фрейма M1. Индикатор можно использовать как отдельную систему для скальпинга на тайм фрейме M1, а также как часть вашей существующей торговой системы. Хотя эта торговая система была разработана специально для торговли на M1, ее можно использовать и с другими тайм фреймами. Первоначально я разработал этот метод для торговли XAUUSD и BTCUSD. Но я считаю этот метод полезным и для торговли на
FiboSniper Pro – Multi-Filter Fibonacci System with Auto SL/TP and Control Panel FiboSniper Pro — это технический индикатор, который объединяет динамические Fibonacci Envelopes с несколькими фильтрами подтверждения для формирования отборных сигналов Buy и Sell. Уровни Fibonacci рассчитываются на основе Moving Average и ATR, а затем фильтруются с помощью ADX, EMA, RSI, ATR, Volume, Time и структуры свечи. Индикатор отображает на графике автоматические уровни Stop Loss и Take Profit на основе ATR,
Auto Optimized SpeedAngle — это система векторизации импульса институционального уровня, которая исключает подгонку под исторические данные (curve-fitting) за счет непрерывной форвард-оптимизации (Walk-Forward Optimization, WFO). Вместо того чтобы полагаться на статические входные параметры, которые теряют эффективность при смене рыночных режимов, индикатор динамически перекалибрует свои настройки, используя валидацию на вневыборочных данных (Out-of-Sample, OOS). Это гарантирует, что отображаемы
Sqn Max Indicator Sqn Max is an exclusive indicator to trade the market with high effectiveness. The indicator is based on price action, volatility and trend. This indicator is as simple as possible but not too simple. The indicator can generate alerts to ease the trading process. You don't have to stay all day in front of your screen. The indicator can be used with any class of assets and with any time frame. It is possible to achieve better results trading our list of selected assets. We achi
Smc Pro ToolKit
Talal N Z Aljarusha
5 (14)
SMC PRO TOOLKIT — SMART MONEY ANALYSIS & STRUCTURED TRADE PLANNING SMC Pro ToolKit is a professional Smart Money Concepts analysis workspace for MetaTrader 5. It combines market structure, multi-timeframe analysis, institutional price zones, setup evaluation, confirmation tools, volume context, alerts, and risk planning inside one organized chart environment. One workspace. Multiple layers of confirmation. One structured trading plan. OPEN COMPLETE USER GUIDE MULTI-CONDITION SETUP ENGINE At
SIO Oscillator: самооптимизирующийся осциллятор дисбаланса семивариаций Купите индикатор и получите советник (EA) на его основе БЕСПЛАТНО. Большинство осцилляторов воспринимают любое движение цены одинаково. SIO разделяет давление покупателей и продавцов и измеряет дисбаланс между ними, показывая, какая сторона действительно контролирует рынок. Когда дисбаланс достигает экстремума, SIO выдаёт чёткий сигнал с уровнями входа, Stop Loss и Take Profit. Главное отличие SIO в том, что он не полагается
Power Candles V3 — самооптимизирующийся индикатор силы Power Candles V3 преобразует силу валюты и инструмента в готовый к использованию торговый план на каждом графике, к которому он прикреплен. Вместо того, чтобы просто раскрашивать свечи, он выполняет автоматическую оптимизацию в режиме реального времени в фоновом режиме и предоставляет вам оптимальные значения Stop Loss, Take Profit и порог сигнала для выбранного вами символа. Один клик — и все готово для реальной торговли: на графике появляю
Atomic Analyst — MetaTrader 5 После покупки напишите мне на MQL5, чтобы БЕСПЛАТНО получить Smart Universal Expert Advisor, а также доступ к онлайн-курсу, руководство в формате PDF и доступ к закрытой группе. Atomic Analyst объединяет анализ ценового движения, направление тренда, сигналы входа и выхода, уровни Stop Loss и несколько уровней Take Profit прямо на графике. УВИДЬТЕ СИГНАЛ. ОЦЕНИТЕ ТОРГОВУЮ СИТУАЦИЮ. Atomic Analyst представляет результаты анализа в понятном визуальном виде: • Стрелки п
Unix Scalper — MetaTrader 5 После покупки напишите мне на MQL5, чтобы БЕСПЛАТНО получить Smart Universal Expert Advisor, а также доступ к онлайн-курсу, руководство в формате PDF и доступ к закрытой группе. Найдите торговую ситуацию. Оцените план. Выберите способ торговли. UNIX Scalper объединяет анализ рынка, решения BUY/SELL/WAIT и уровни Entry, Stop Loss, TP1 и TP2 в одной удобной панели. УВИДЬТЕ СИГНАЛ И ТОРГОВЫЙ ПЛАН • Понятные решения: BUY, SELL или WAIT. • Определённые уровни: Entry, Stop
Индикатор Tokyo Indicator обеспечивает наглядное представление о направлении тренда, потенциальных торговых сигналах и текущей рыночной ситуации. Его ступенчатая линия тренда с цветовой индикацией позволяет различать «бычьи» фазы (выделены синим цветом) и «медвежьи» фазы (выделены пурпурным цветом). Соответствующие стрелки указывают на возможные точки входа в рынок (покупку или продажу) при смене тренда. Встроенная информационная панель объединяет данные о текущем сигнале, рыночном настроении,
Astral Structure Оцените сетап. Посмотрите его первоначальный план. Специальная цена запуска - $99. $149 после запуска. Структурный сетап ставит сразу несколько вопросов: согласуется ли общая картина, где находится ориентир стопа и как определены цели? Astral Structure объединяет эти вопросы в одном рабочем пространстве для трейдеров, самостоятельно принимающих решения на основе структуры рынка. Сосредоточьтесь на актуальном сетапе. Рассматривайте последний подходящий сетап, его направление и кв
Crystal Heikin Ashi Signals—Professional Trend & Signal Detection Indicator Advanced Heikin Ashi Visualization with Intelligent Signal System for Manual & Automated Trading Final Price: $149 ---------> Price goes up $10 after every 10 sales . Limited slots available — act fast . Overview User Guide PDF Crystal Heikin Ashi Signals is a professional-grade MetaTrader 5 indicator that combines pure Heikin Ashi candle visualization with an advanced momentum-shift detection system. Designed for both m
Trend Catcher   анализирует движения рыночных цен, используя комбинацию собственных и индивидуально разработанных адаптивных индикаторов анализа тренда. Он определяет истинное направление рынка, отфильтровывая краткосрочные шумы и фокусируясь на силе импульса, расширении волатильности и поведении ценовой структуры. Он также использует комбинацию сглаживающих и фильтрующих тренд индикаторов, таких как скользящие средние, RSI и фильтры волатильности. Мониторинг реальных операций, а также другие
Мультивалютный индикатор силы и импульса MT5 Dynamic Forex28 Navigator — развитие наших давно популярных индикаторов, объединяющее силу пяти в одном: Advanced Currency Strength28 Indicator (700 отзывов) Advanced Currency IMPULSE with ALERT (530 отзывов) Currency Strength EXOTICS GOLD Impulse with Alert CS28 Combo Signals (текущий бонус) Не нужно покупать четыре индикатора и ставить их на графики. Всё объединено в одном мощном индикаторе: сила 28 пар Forex, импульс рынка, который их ведёт, и опов
Scalper Vault — это мощная, полноценная торговая система, созданная для трейдеров, которые стремятся к стабильным результатам в внутридневной торговле. Этот высокоточный индикатор представляет собой комплексное, самостоятельное торговое решение, обеспечивающее аналитику профессионального (институционального) уровня как для торговли на рынке Forex, так и для работы с бинарными опционами. Пожалуйста, свяжитесь со мной после покупки, чтобы получить мои торговые советы, а также отличный бонус! Исклю
Другие продукты этого автора
This product can be used to synchronize multiple Charts, and each Chart can be set to a different sync mode. With this product you can better view and manipulate charts: different time frames for a single Symbol, the same time frame for multiple Symbols... and more. PS: The link below is the FreeDemo product, you can use it on EURUSD/XUAUSD/USDCNH symbol: https://www.mql5.com/en/market/product/38557 Feature: Chart settings  can be synchronized, including : background, indentation, size, etc. M
Do you think it's a bit cumbersome when you need to switch symbols or timeframes with mouse click? 1. What is this? This is a program that can switch symbols and timeframes with direction keys. Fast switching, very convenient, no mouse click required. For traders, one symbol with multi-timeframe charts are usually added,  you can change symbol on those charts easily. For multi-currency traders, different symbol charts are usually added, you can also change those timeframes easily. I wrote this p
1. What is this         Rising volatility and falling volatility are not the same, whether it is academic research or actual testing has shown this point.         The original ATR indicator is calculated by putting up and down fluctuations together. This indicator is to calculate separately the upward volatility and the downward volatility, which can better help you study the market. 2. Indicator description          There are two modes for the calculation of this indicator, as shown in the fo
Have you ever take a long time to watch a Symbol when the network link is not good ? Have you ever wait for a long time when you switch chart between different Symbols or different TimeFrames ? If you do long-term backtesting , Have you ever to be downloaded datas for a long time ? Yes, If there is no data in the system, those will happen.  1. What is this: Download all the Symbol data in Market Watch to the system. PS: This is not outputting data to Files. This Link go to Demo version: https:/
This product can be used to synchronize multiple Charts, and each Chart can be set to a different sync mode. With this product you can better view and manipulate charts: different time frames for a single Symbol, the same time frame for multiple Symbols, system indicators for single/multiple Symbols... and more. Feature: Chart settings can be synchronized, including : background, indentation, size, etc. Multiple Chart window start times  or end times can be synchronized. Multiple Chart time fr
I see that many tools in the market deal with Position and Order in the form of operation panels. Which is loaded into a Chart in the form of an EA. However, once the operator panel EA is loaded, no other EAs can be loaded. So, I wrote the one-click operation of Position and Order as a script, so you can load other EAs and easily complete one-click operation of Trade. 1. What is this: This is a one-click script to close position order. Now you can close position tickets at high speed, for examp
I see that many tools in the market deal with Position and Order in the form of operation panels. Which is loaded into a Chart in the form of an EA. However, once the operator panel EA is loaded, no other EAs can be loaded. So, I wrote the one-click operation of Position and Order as a script, so you can load other EAs and easily complete one-click operation of Trade. 1. What is this: This is a one-click script to delete the pending order . Now you can delete pending tickets at high speed, for
Do you think it's a bit cumbersome when you need to switch symbols or timeframes with mouse click? 1. What is this? This is a program that can switch symbols and timeframes with direction keys. Fast switching, very convenient, no mouse click required. For traders, one symbol with multi-timeframe charts are usually added,  you can change symbol on those charts  easily . For multi-currency traders, different symbol charts are usually added, you can also change those timeframes easily. I wrote thi
According to trading experience: Some symbols are easy to reverse on certain days, such as Monday, or afternoon, and so on. So comparing the current price with the corresponding historical moment price is valuable. If the price coordinate system uses a logarithmic price, you will get a lot of valuable information. 1. What is this? This program can convert the symbol price and add it to your Chart. You can compare it with your major chart. The DEMO version Link: https://www.mql5.com/en/market/pr
What is this: Violent trading: means sending a large number of orders to your brokerage server,  it can conduct a stress test of the trading. In this program you can run a variety of trading tests.  Now you can trade at high speed, For example 1000 orders in an instant. The Demo version's link:  https://www.mql5.com/en/market/product/38431/ Why to use: Whether manual trading or EA trading,  the status of the broker server is very important. So it is beneficial to conduct a trading stress test on
1. Why did I develop this series of indicators I found that most traders need to use multiple time frame indicators. They usually switch time frame to see indicators. However, once the timeframe is switched, you cannot see the  corresponding relationship  between  the price in the smaller timeframe  and  the indicator in the larger timeframe . For example: if your price chart is in H1 timeframe, you can see H4, D1 and W1 indicators in H1 timeframe Chart. This is more helpful for you to find th
Фильтр:
Нет отзывов
Ответ на отзыв