BalanceCurve

1. 这是什么

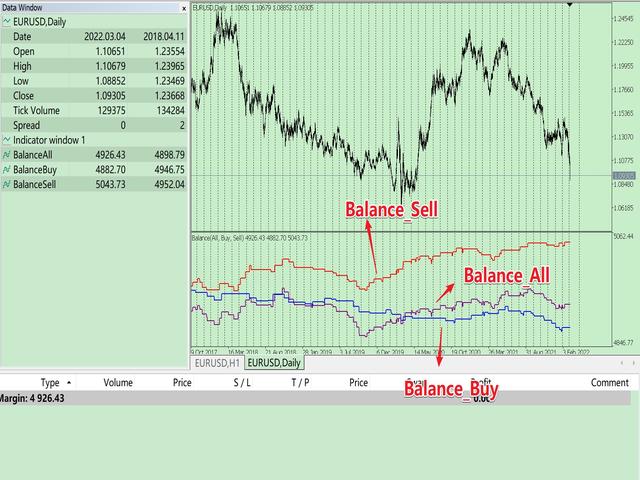
这是一个用于实时显示资金曲线的工具。MT5软件的历史订单只有表格的,当你的订单很多时,它看起来很麻烦。这个程序可以把你的历史交易订单以资金曲线图的形式画出来。这样你可以一目了然自己的交易水平怎么样,以及在哪里地方出的问题。

同时,MT5的策略回测虽然有资金曲线图,但是它并没有与价格一一匹配。所以使用起来非常麻烦。这个程序让价格曲线与资金曲线一一匹配,使用非常方便。

2. 特色

  • 可以把你的历史交易订单以资金曲线图的形式画出来,它可以根据不同的时间框画出不同的资金曲线。
  • 它可以用于策略回测,用于实时显示你的EA策略怎么样。
  • 它分为三条资金曲线。一条为仅显示做多,一条为仅显示做空,一条为包括所有。
  • 以指标形式编程,不影响叠加其他的EA或指标。

3. 参数说明

  • InitDeposit = 5000; // Initial Deposit
  • Inp_StartTime = 0; // History start time, 0 - all time
  • Inp_ProfitNorm = false; // Is corrected position to 1.0 lots, default false.
  • Inp_Symbol = NULL; // Select Symbol, default is all symbol.

4. 怎么使用

直接加载到图表上即可。

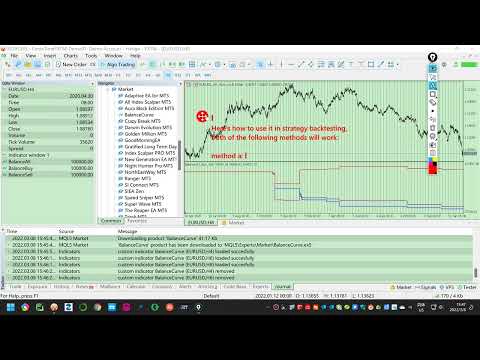
下面说下策略回测中怎么使用,以下两种方法都是:

  • a. 加载下面一句代码到你的EA的OnInit()中,它会在历史测试中自动加载该指标。首先你要把下载的程序复制到Indicator目录下。
    //---First you have to copy the program to the Indicator directory.
    iCustom(_Symbol, _Period, "BalanceCurve", 5000, 0, false);
  • b. 把该指标保存到模板中,然后在策略回测中加载该模板即可。


推荐产品
Before installing the HeatMap indicator make sure you are using a broker that gives you access to the Depth of market (DOM) !! This indicator creates a heatmap on your chart allowing you to see the buy or sell limit orders easily and in real time. You have the possibility to change the setting and the colors of the HeatMap in order to adapt to all markets and all charts. Here is an example of a setting you can use with the NASDAQ100 on the AMPGlobal broker :  https://www.youtube.com/watch?v=x0Y
Renko Logic
Ahmed Mohammed Bakr Bakr
MetaTrader 5 Renko Expert Advisor - User Guide Overview This Expert Advisor implements a complete Renko-based trading system with custom brick calculation, visual display, and automated trading logic. -The EA only for Rent unlimited Version coming soon. Features 1. Renko Engine Custom Renko Calculation : Built from scratch, no offline charts needed No Repainting : Uses only closed Renko bricks Configurable Brick Size : Set in points via input parameters Real-time Brick Formation : Automatically
Copy Local Pro — Ultra Fast MT5 Local Trade Copier Copy Local Pro is a high-speed local trade copier for MetaTrader 5 that instantly replicates trades between multiple MT5 accounts on the same PC or VPS. Overview Execute trades on one account and automatically copy them to multiple accounts in real time. The copier runs entirely locally, providing ultra-low latency, stable execution, and full control over risk management without external servers. Key Features Fast local trade copying with near-
KT Renko Patterns MT5
KEENBASE SOFTWARE SOLUTIONS
KT Renko Patterns 会逐砖扫描整个 Renko 图表,寻找那些在各种金融市场中被交易者频繁使用的著名图表形态。 与基于时间的图表相比,Renko 图由于其简洁清晰的特性,更容易识别图表形态,尤其适合基于形态的交易策略。 KT Renko Patterns 包含多种常见的 Renko 图形模式,其中许多都在 Prashant Shah 所著的《用 Renko 图表实现盈利交易》一书中有详细说明。 基于 KT Renko Patterns 指标开发的 100% 自动交易EA已发布,点击这里了解 - KT Renko Patterns EA 。 特点 可交易多达八种清晰明确的 Renko 图形模式,无任何模糊。 每种模式都配有止损位和斐波那契目标位,确保交易策略客观明确。 KT Renko Patterns 实时监测每种模式的准确率,并将关键统计信息显示在图表上。 当 Renko 砖块发生反转时会自动标记并提醒,有助于在行情突变时提前计划退出。 已识别的图形不会重绘或重新绘制,信号稳定可靠。 包含的图形模式 W-M 形态 强势旗形 AB=CD 形态 三顶/三底 双顶
Title: Institutional Bias Automator PRO Automate Your Top-Down Analysis. Align Your Trades with Institutional Order Flow by Dawe Trading! The biggest mistake retail traders make is executing setups against the Higher Timeframe (HTF) market bias.   Institutional Bias Automator PRO , engineered by   Dawe Trading , is a sophisticated, fully automated trading system designed to completely eliminate this error. It ensures your execution is always mathematically aligned with high-probability institut
Cumulative Delta NG
Anton Polkovnikov
Cumulative delta indicator As most traders believe, the price moves under the pressure of market buying or selling. When someone redeems an offer standing in the cup, the deal is a "buy". If someone pours into the bid standing in the cup - the deal goes with the direction of "sale". The delta is the difference between purchases and sales. A cumulative delta - the difference between the cumulative sum of purchases and sales for a certain period of time. It allows you to see who is currently contr
Exclusive Imperium MT5 — 自动化交易系统 Exclusive Imperium MT5 是一款用于 MetaTrader 5 的智能交易顾问(EA),基于市场分析算法和风险管理。该顾问完全自动运行,几乎不需要交易者的干预。 注意!购买后请立即联系我 ,以获取安装和设置说明! 重要提示: 所有示例、截图和测试仅用于演示目的。如果某个货币对在某个经纪商处表现良好,并不意味着在其他经纪商处也会如此。每个经纪商都有自己的报价、点差和交易条件。因此, 每个货币对必须由用户自行优化 ,并且在真实账户上 只能以单一货币模式运行 —— 每个货币对单独运行。多货币模式的截图仅供参考。建议至少 每年优化一次 ,因为市场条件会发生变化。 重要信息: 顾问的演示版本仅供试用。未经优化的测试结果不能反映算法的真实表现。完整使用需要针对经纪商、资金和所选工具进行个性化优化。无论如何,优化必须由用户自行完成,并且至少 每年重复一次 。 请记住:最终结果直接取决于您的经验以及您在优化后设置的参数。 主要特点 分析算法: 指标与过滤器的组合,用于寻找交易机会。 灵活性: 可适应不断变化的市场条件
SMC Venom 模型 BPR 指標是針對在智慧貨幣 (SMC) 概念內工作的交易者的專業工具。它會自動辨識價格圖表上的兩種關鍵模式: FVG (公平價值缺口)是三根蠟燭的組合,其中第一根和第三根蠟燭之間存在缺口。它在水平之間形成一個沒有成交量支撐的區域,這通常會導致價格調整。 BPR (平衡價格區間)是兩種 FVG 模式的組合,形成一個「橋樑」 - 當價格以低成交量活動移動時,突破並返回到水平的區域,從而在蠟燭之間產生間隙。 這些模式可協助交易者透過分析圖表上的交易量和價格動態(大型市場參與者和普通參與者之間的互動)來識別關鍵的支撐/阻力位、突破區域和切入點。 此指標以矩形和箭頭的形式可視化模式,也支援靈活的警報設定。 主要特點: 模式顯示模式:選擇顯示 BPR 模式(看漲和看跌)或 FVG 模式(看漲和看跌)。 可以隱藏所有圖表分析模式。 以條數過濾:BPR 結構中 FVG 之間的最小/最大距離。 訊號的附加視覺化: 箭頭有 9 種類型可供選擇(標準、細、分形等)或手動輸入 Wingdings 代碼,其表格可以選擇性地顯示在圖表上。 設定顏色、尺寸及其縮放時相對於價格的動態
| Fully-automated Smart Money Concept (ICT) inspired trading solution with multi-strategy capabilities | Built by a grid trader >> for grid traders.  This is MT5 version, click  here  for  Blue CARA MT4  (settings and logics are same in both versions)     Real monitoring signal  -->  Cara Gold Intro Blue CARA EA   ('CARA') - short for  C omprehensive  A lgorithmic   R esponsive   A dvisor is a next-gen  multi-currency    multi-timeframe  EA base on the widely known (and perhaps the most popul
简介 这是一款做回调的EA,检测趋势的背离,也就是缠中说禅理论的第一类买卖点,这个EA的盈利因子非常高,长期是稳定盈利的,这款EA使用动态网格交易,可以自适应行情。 新EA促销价: $99 → $149 Live信号2215353 https://www.mql5.com/en/signals/1080741 配置文件 https://c.mql5.com/6/954/Profit.set https://c.mql5.com/6/954/Low_Risk.set 特点 采用虚拟订单,可以自动调节 自适应行情 对点差和平台要求不高 采用动态网格,不使用马丁(程序可以设置) 可以和其它EA一起使用 面向对象编程,程序框架经过5年优化 使用 周期:M15 主要品种:GBPUSD,AUDUSD,AUDCAD 最小入金:$1000 账户: ECN Hedge   推荐经纪商:IC Markets, Pepperstone ,Tickmill,Darwinex等平台 建议使用VPS 我们的EA只在MQL5.com销售,其它地方的都是盗版。 购买后请及时联系我们。
YOLO Gold go go
Inrexea Limited
5 (2)
YOLO最有价值的是:VIP服务,精准的每日预测和趋势变化提醒。将所有信息直接连接到我的数据库中以保护版权和共享。所以我们的 VIP 消息和逻辑将受到保护,只有在 MQL 上购买的人才能使用该服务。 如果你想提高你的手动交易技巧,YOLO是你训练手动交易的好工具,如果你的决定不是太可怕,YOLO会帮助你TP,你可以开始你的下一个决定 信号监视器:在这里我们为 MQL 用户提供信号服务。购买后PM我。 交易员您好, 这是来自香港的 JoanneYip 和 HusonChow。我们从 2016 年开始学习构建交易系统,并在过去 15 年中交易我们自己的基金。 我们开发了上百个交易系统来管理我们自己的基金,我们将部分基金投资于作为实验室测试新策略,然后再出售给市场。 我们的经验告诉我们,回测和模拟账户是不可信的,尤其是我的最新产品 {TripleH} 同时管理 24 对,并且这 24 对之间保持相互沟通以找出“真实趋势”。此外,我们对我们的产品进行了大量压力测试,以避免来自市场或经纪商的“陷阱”,例如巨大的滑点、不同的数据馈送、掉期变化、点差。 YOLO的概念: 您每天
Classic SNR EA MetaTrader 5 智能交易系统 | 多品种支撑阻力交易,基于趋势逻辑 概述 Classic SNR Breakout EA 是一款专业的交易机器人,使用日线摆动点识别结构性支撑与阻力水平(Support & Resistance),并根据 H1 价格行为相对于这些水平的表现执行交易。EA 应用 双重逻辑 :在上涨趋势中,当 H1 收盘于 SNR 水平下方(拒绝信号)时做空;在下跌趋势中,当 H1 收盘于 SNR 水平上方(拒绝信号)时做多。当 H1 收盘价果断突破水平时,也会交易突破信号。 EA 可同时扫描多达 14 个交易品种,自动解析经纪商特定的品种名称和后缀。 本策略适用于理解结构性水平可根据市场环境既充当支撑/阻力又充当突破触发器的交易者。 工作原理 EA 分析日线收盘价,在可配置的回溯期内识别高点和低点。这些摆动点成为结构性的支撑和阻力水平。然后 EA 监控 H1 K线收盘价相对于每个 SNR 水平的表现,并应用 基于趋势的逻辑 来确定交易方向。 核心交易逻辑 EA 并非简单地单向交易突破。相反,它会评估价格位置和 H1 收盘行为: 价格
SPECIAL LAUNCH OFFER: $30 (1-Month Rent) Limited time offer to build our community and gather feedback! AmbM GOLD Institutional Scalper A high-precision M5 algorithm for XAUUSD (Gold) , engineered to trade exclusively at Institutional Liquidity Levels ($5/$10 psychological marks). PERFORMANCE DATA (BUY ONLY) • Win Rate: 87.09%. • Safe Growth: +$4,113 profit on $10k (13.75% Max Drawdown). • Extreme Stress Test: Successfully generated +$22,997 in a 5-year stress test (2020-2026), proving
Volume Profile V6
Andrey Kolesnik
4.75 (4)
市场的成交量曲线指标+一个智能振荡器. 它适用于几乎所有工具-货币对,股票,期货,加密货币,实际交易量和报价。 您可以设置配置文件范围的自动定义,例如,一周或一个月等。,并通过移动边界(两条垂直线红色和蓝色)手动设置范围。 示为直方图。 此级别直方图的宽度有条件地意味着在其上进行的交易数量。 使用"模式水平线颜色"参数,您可以设置自动显示价格可能会击退的最重要交易量水平,而最大颜色参数则分别显示整个设定范围内最大交易量的水平。     智能振荡器显示超买和超卖区域,它分析来自多个指标的信息,并根据处理的数据,以适当的颜色为超买和超卖区域着色。     在Volume every day中,您可以使用Range period参数设置构建配置文件的时间范围,并使用Range count参数设置这些范围的配置文件数量。 例如,Range period=1day,Range count=10表示配置文件将基于一天的周期,即最后十天。 重要的是,切换图表的时间框架不会影响配置文件的构建,这也是该指标的一个额外优势。      该指标非常简单易用,同时尽可能提供信息。 有了这个指标,做市商将
Equinox Gold
Dmitriq Evgenoeviz Ko
Equinox Gold is a high-tech trading expert advisor (EA) specifically designed for the gold market ( XAUUSD ). The system is based on a unique Market Equilibrium algorithm that identifies areas of imbalance between supply and demand during extreme volatility. Unlike most robots that use dangerous sit-and-wait methods, Equinox Gold relies on mathematical momentum confirmation and strict risk control for every trade. MAIN ADVANTAGES VRP Filter (Volatility Range Filter): The robot automatically ada
Trend Sentry Pro
K2021665571 (SOUTH AFRICA)
产品描述 Trend Sentry Pro 是一个复杂的全自动长线交易专家顾问 (EA),通过先进的趋势线指标来把握上升趋势。当价格收盘高于趋势线时,该 EA 会开立买单,表明一个确认的看涨趋势;当价格低于趋势线时则会平仓,标志着潜在的趋势反转。这种方法使 Trend Sentry Pro 能够充分捕捉上升的市场波动,同时最大限度地减少损失。通过自适应的 ATR 止损管理和灵活的仓位大小设置,Trend Sentry Pro 可无缝调整至市场条件,目标是优化回报并保护资金。 主要特点包括: 趋势跟随策略 :仅在上涨趋势中进行买入操作,以捕捉看涨的市场波动。 基于 ATR 的止损 :自适应止损会根据市场波动调整,在高波动期降低风险。 灵活的仓位大小设置 :可以选择账户余额风险百分比、固定手数或固定货币金额,以适应您的风险偏好。 点差过滤 :在点差过高时避免交易,最大限度地减少滑点和交易成本。 魔术号码 :每笔 EA 交易的唯一标识符,允许在同一账户上无缝使用多个 EA。 该 EA 适合寻找具有自适应风险管理和可自定义设置的强大趋势跟随策略的交易者,以匹配个人的交易风格。 用户输入参数 T
Gann Time–Price Square Cycles (MT5) This indicator applies the concept of time–price balance introduced by W.D. Gann. It detects price swings on the chart and projects Quarter, Half, and Full cycle time intervals forward, marking them with vertical lines. The tool is designed to help traders study the relationship between swing size and elapsed time directly on MT5 charts. Functions Detects swing highs and lows based on pivot depth and minimum swing size. Projects Quarter, Half, and Full harmon
Scalping Lines System MT5 是一款专为交易黄金 (XAUUSD) 而设计的短线交易系统,适用于 M1-H1 时间框架。 它整合了趋势、波动率和超买/超卖市场分析指标,并将其集成到一个振荡器中,用于识别短期信号。 信号线的主要内部参数已预先配置。 部分参数可供手动调整:“趋势波持续时间”,用于根据趋势移动平均线 (MA) 调整趋势方向上一系列信号的持续时间;以及“信号线平滑处理”,用于调整信号线的生成方式。 该指标在开盘价计算信号线时不会重绘。在其他价格下,信号箭头可能会闪烁。 信号在蜡烛图收盘后出现,并提供多种警报类型。 推荐使用的时间框架:M1-M5-M15-M30-H1。 该指标最初设计用于黄金交易,但也适用于交易波动性高、点差低的资产,例如比特币和加密货币、白银以及股票指数差价合约(如纳斯达克100指数等)。 对于某些其他交易品种(例如欧元/美元、英镑/美元),该指标可用于15分钟及以上的时间框架。 如何使用该指标进行交易。 对于“卖出”信号: 蓝色下降箭头位于顶部。 震荡指标顶部会出现一个蓝色箭头,箭头后的蓝线表示信号支撑持续时间
Level Volume Pro
John Samfel Bucton Josol
HAT IT DOES   MONTHLY HIGH & LOW — AUTO-DRAWN EVERY MONTH Draws the High and Low of every month for the current year (or any year you set). Each level extends as a horizontal ray into the future so you always see where price is reacting to historical monthly extremes. Color-coded (blue = high, red = low), labeled (JAN HIGH, FEB LOW etc.), fully customizable width and style. Toggle individual months on or off.   WEEKLY HIGH & LOW
Protocol
Vincent Georges David Ferrier
PROTOCOL - Institutional Liquidity Grab & SMC Elite Liquidity Grab & Advanced SMC Execution ( MT4 Available here ) Dynamic Trend Sniper MT5 (available here) LIMITED RELEASE & PRICING NOTICE Launch Special: Available for $299 USD for the first 7 days only . After this period, the price will strictly increase to $399 USD. Prop Firm Protection Protocol: Major Prop Firms enforce strict copy-trading and trade-crowding policies. To protect the statistical edge of this algorithm and ensure our
TW Western Scalper MT5 – 终极黄金日内交易与XAUUSD智能EA 您最聪明的黄金剥头皮与日内利润伙伴 TW Western Scalper MT5 结合精准趋势检测、自适应市场逻辑以及多层风险控制,捕捉黄金价格的短期盈利机会。 针对高波动的 XAUUSD 交易优化,确保稳定表现、严格的资金保护以及智能资金管理——在盈利与安全之间实现完美平衡。 为什么选择 TW Western Scalper EA 独特的黄金剥头皮策略 专为每日 XAUUSD 交易设计,专注于短期精确度与高概率交易。 精准趋势检测 智能移动平均线和自定义指标识别真实市场方向,同时过滤噪音。 自适应市场逻辑 自动适应波动性与市场动态,实现精准入场。 智能风险控制 每次只开一笔交易。 多层资金保护机制。 使用隐藏止损与灵活止盈。 自动手数系统随账户增长而扩展。 验证的表现 胜率高达85%。 月增长潜力约30%。 集成回撤控制。 终身更新与专属支持。 智能逻辑,带来稳定交易结果 TW Western Scalper MT5 适应真实市场条件,过滤虚假信号,专注高质量日内交易机会。 专
Surf Board
Mohammadal Alizadehmadani
Benefits of the Surfboard indicator : Entry signals without repainting If a signal appears and is confirmed, it does NOT disappear anymore, unlike indicators with repainting, which lead to major financial losses because they can show a signal and then remove it. perfect opening of trades The indicator algorithms allow you to find the Peak and floor position to enter a deal (buy or sell an asset), which increases the success rate for each and every trader using it. Surfboard works with any asset
BTC Master Pro
Farzad Saadatinia
4.58 (12)
BTC Master Pro —— 您值得信赖的比特币纪律化交易伙伴。 全新版本现已集成 OpenAI 人工智能技术 ,在高波动的加密市场环境中,实现更智能的执行与更精准的交易过滤。 本专业级交易机器人专为 Bitcoin (BTCUSD) 在 MetaTrader 5 平台上的交易而设计,专注于结构化执行、风险暴露控制以及智能化风险管理。 当前价格: $499  →  下一阶段: $699  →  最终价格: $999 LIVE SIGNAL HERE 基于 OpenAI 的执行过滤系统 最新版本集成 OpenAI 技术,用于实时分析市场环境并过滤低质量或弱势交易信号。 AI 安全层(AI Safety Layer): 人工智能模块作为交易执行前的第二层审核机制。其功能严格限定为执行过滤工具(而非市场预测工具)。每一笔交易都必须通过结构化逻辑与智能验证流程,以减少不必要的回撤并避免低质量入场。 为什么选择 BTC Master Pro? 加密货币市场——尤其是比特币——具有高度波动性。情绪化决策往往导致不稳定的交易结果。本系统旨在帮助交易者在快速市场变化中保持结构化、纪律性与
用於自動訂單和風險管理的實用程序。讓您從利潤中獲得最大收益並限制您的損失。由執業交易員為交易員創建。該實用程序易於使用,適用於交易者手動打開的任何市場訂單或在顧問的幫助下。可以按幻數過濾交易。該實用程序可以同時處理任意數量的訂單。 具有以下功能: 1. 設置止損和止盈水平; 2. 通過追踪止損位平倉; 3. 設定盈虧平衡水平。 該實用程序可以: 1. 分別處理每個訂單(為每個訂單單獨設置級別) 2. 處理一籃子單向訂單(所有訂單的水平設置相同,買入和賣出分開) 3. 處理一籃子多向訂單(所有訂單的級別都設置為通用的,BUY 和 SELL 一起) 選項: STOPLOSS - 如果不使用 =-1,則以點為單位止損; TAKEPROFIT - 以點為單位獲利,不與 -1 一起使用; TRAILING_STOP - 價格變動的點數,如果不使用 =-1; TRAILING_STEP - 每一步利潤將增加的點數; BREAKEVEN_STOP - 將訂單轉移到盈虧平衡點的點數,如果不使用 =-1; BREAKEVEN_STEP - 關閉訂單時的利潤點數;
BeansAssist
Ivanvielle Bonifacio Dupaya
BeansAssist Gives you fruitful information of the price of the symbol that you are trading. Improve your trades simply by following the suggestion that it gives you. Tracks deal stats daily so you keep track of your performance. Don't let emotions take control, be a better and profitable trader with BeansAssist to guide you. *Note: This utility is not for free 
Rainbow EA MT5
Jamal El Alama
Description : Rainbow EA MT5 is a simple Expert advisor based on   Rainbow MT5 indicator witch is based on Moving average with period 34. The indicator is incorporated in the EA, therefore, it is not required for the EA to operate, but if you wish, you can download it from   my product page . The Expert Advisor settings are as follows : Suitable for Timeframes up to H1 The parameters below can be set according to your trading rules. StopLoss ( Stop Loss in pips) TakeProfit ( Take Profit in pips
##   ONLY GOLD ##   Тiльки Золото ## **Mercaria Professional Trading Zones - Complete Guide** ## **Mercaria Professional Trading Zones - Повний посібник** ### **How Mercaria Zones Work / Як працюють зони Mercaria** **English:** Mercaria Zones is an advanced trading indicator that identifies high-probability support and resistance areas using ZigZag extremes combined with mathematical zone calculations. The indicator works on multiple timeframes simultaneously, providing a comprehensive view
AUTOMATIC TRADE COPIER for local *   use . (copy trades between several metatrader terminals on the local computer/ *or GLOBALLY after setting your network /server !) Can copy trades from one or   several main MT5 accounts   to several MT5 and MT4 accounts   (no limit). For MT5 to MT4 copy you have to also get version for Metatrader 4 here : https://www.mql5.com/en/market/product/80842 - very fast execution (theoretically up to 5ms delay, depends on computer speed) - user can set speed of copy
该产品的买家也购买
Trade Assistant MT5
Evgeniy Kravchenko
4.42 (209)
它有助于计算每笔交易的风险,容易安装新的订单,具有部分关闭功能的订单管理, 7 种类型的追踪止损和其他有用的功能。   附加材料和说明 安装说明   -   应用程序说明   -   模拟账户应用程序的试用版 线条功能  - 在图表上显示开仓线、止损线、止盈线。 有了这个功能,就可以很容易地设置一个新的订单,并在开仓前看到它的附加特性。   风险管理  - 风险计算功能在考虑到设定的风险和止损单的大小的情况下,计算新订单的成交量。它允许你设置任何大小的止损,同时观察设定的风险。 批量计算按钮 - 启用 / 禁用风险计算。 在 " 风险 " 一栏中设置必要的风险值,从 0 到 100 的百分比或存款的货币。 在 " 设置 " 选项卡上选择风险计算的变量: $ 货币, % 余额, % 资产, % 自由保证金, % 自定义, %AB 前一天, %AB 前一周, %AB 前一个月。   R/TP 和 R/SL - 设置止盈和止损的关系。 这允许你设置相对于损失的利润大小。 例如, 1 : 1 - 这决定了 TP = SL 的大小。 2 : 1 - 这意味着 TP 是 SL 的两倍。 RR -
欢迎来到 Trade Manager EA——这是一个终极风险管理工具,旨在使交易变得更直观、精准和高效。它不仅仅是一个下单工具,而是一个用于无缝交易计划、仓位管理和风险控制的全面解决方案。不论您是新手交易员、资深交易员,还是需要快速执行的剥头皮交易员,Trade Manager EA 都可以满足您的需求,适用于外汇、指数、大宗商品、加密货币等各种市场。 借助 Trade Manager EA,复杂的计算已成过去。只需分析市场,在图表上用水平线标记入场、止损和止盈,设置您的风险水平,Trade Manager 就会立即计算出理想的头寸规模,并实时显示以点、账户货币计价的止损和止盈。每笔交易都得以轻松管理。 主要功能: 头寸规模计算器 :根据定义的风险瞬间确定交易规模。 简单的交易计划 :在图表上用可拖动的水平线直接计划交易,设置入场、止损和止盈。 实时显示 SL 和 TP :以账户货币、点或分显示止损和止盈,便于分析。 高级保护工具 盈亏平衡选项 : 基本盈亏平衡 :当您的交易达到设定水平时自动保护利润。 多级盈亏平衡 :设置多达 4 个级别以逐步保护利润。 尾随止损选项 : 基本尾随
Local Trade Copier EA MT5
Juvenille Emperor Limited
4.96 (136)
通过 Local Trade Copier EA MT5 获得非常快速的交易复制体验。它的简单1分钟设置,使您可以在同一台Windows计算机或Windows VPS上在多个MetaTrader终端之间复制交易,具有闪电般快速的复制速度,低于0.5秒。 无论您是初学者还是专业交易者, Local Trade Copier EA MT5 都提供了广泛的选项,可根据您的特定需求进行自定义。对于任何希望增加利润潜力的人来说,这都是终极解决方案。 今天就尝试一下,看看为什么它是市场上最快、最简单的贸易复印机! 提示: 您可以在您的模拟账户中下载并试用 Local Trade Copier EA MT5 模拟版: 这里 将下载的免费演示文件粘贴到您的 MT5 >> 文件 >> 打开数据文件夹 >> MQL5 >> 专家文件夹并重新启动您的终端。  免费演示版本每次可在 4 小时内发挥全部功能,仅限演示帐户。 要重置试用期,请转至 MT5 >> 工具 >> 全局变量 >> Control + A >> 删除。 请仅在非关键模拟账户上执行此操作,不要在挑战道具公司账户中执行此操作。 如果您无法
TradePanel MT5
Alfiya Fazylova
4.87 (153)
交易面板是一款多功能交易助手。该应用包含超过50种手动交易功能,并允许您自动执行大多数交易任务。 注意!优惠有效至2026年5月5日。从2026年5月6日起,价格将为100美元。 在购买之前,您可以在演示账户上测试演示版本。下载用于演示账户的试用版应用程序: https://www.mql5.com/zh/blogs/post/762579 。 完整说明 这里 。 贸易. 只需单击一下即可执行交易操作: 打開掛單和頭寸,並自動計算風險。 一鍵打開多個訂單和頭寸。 打開訂單網格。 按組別關閉掛單和頭寸。 反轉頭寸方向(關閉買入>打開賣出,關閉賣出>打開買入)。 鎖定頭寸(通過開啟缺少的頭寸,使買入和賣出頭寸的數量相等)。 一鍵部分關閉所有頭寸。 將所有頭寸的止盈和止損設置在同一價格水平。 將所有頭寸的止損設置在盈虧平衡水平。 開倉時,可使用以下功能: 在多個訂單或倉位之間分配計算出的數量(在單擊一次時開啟多個訂單和倉位)。 在開啟訂單前在圖表上可視化交易水平。 僅在當前點差不超過設定值時才開啟倉位。 止盈和止損之間的自動比例。 虛擬止損和止盈。 自動將止損和止盈的大小增加為當前點差的大小
测试版发布 Telegram to MT5 Signal Trader 即将进入正式的 Alpha 版本。一些功能仍在开发中,您可能会遇到一些小错误。如果您遇到问题,请反馈,您的意见将帮助我们改进软件。 Telegram to MT5 Signal Trader 是一款强大的工具,能够将 Telegram 频道或群组的交易信号自动复制到您的 MetaTrader 5 账户。 支持公开和私人频道,可将多个信号提供者连接至一个或多个 MT5 账户。软件优化、高效、稳定,精准控制每笔复制交易。 界面简洁,仪表盘美观,图表交互性佳,导航直观。您可以管理多个信号账户,自定义每个提供者的设置,并实时监控所有操作。 系统需求 由于 MQL 限制,EA 需要配合 PC 端应用与 Telegram 通信。 安装程序可通过官方 安装指南 获取。 核心功能 多提供者支持: 从多渠道复制信号至多个 MT5 帐户 高级信号识别: 关键词、模式和标签全面自定义 逐提供者控制: 可启用/禁用特定信号类型、平仓策略等 灵活风险管理: 固定手数、固定金额、余额/权益百分比、部分平仓设置 可定制 SL/TP: 覆盖信号
Farmed Hedge Yield Farming | All Markets (Manual - Hybrid - Semi/Automated EA) MULTI-ASSET SUPPORT Trade any asset available on your broker - Forex: Major, Minor, Exotic pairs - Crypto: BTC, ETH, XRP, SOL, BNB - Stocks: Apple, Tesla, Amazon, Google, etc. - Commodities: Gold, Silver, Oil, Gas - Indices: US30, NAS100, SPX500, DAX40 - Any CFD your broker offers VERIFIED TRADING RESULTS - Farmed Hedge Yield Axi Copy:  https://www.mql5.com/en/signals/2356376 - Farmed Hedge Yield Exn Copy:   https:/
Power Candles 策略扫描器——自优化多符号设置查找器 Power Candles策略扫描器 采用与Power Candles指标相同的自优化引擎,可同时扫描您“市场观察”中的所有交易品种。一个面板即可显示当前哪些品种在统计上具备交易价值、每种策略的最佳应用方向、最优止损/止盈组合,并在新信号触发时立即向您发送提醒。 本工具是 Stein Investments 生态系统的一部分 - 18+ 款工具,加上 Max,您的一对一 AI 交易导师。  随时在线,深入了解每一款指标,在您需要梳理思路的那一刻就在那里。  立即认识他: https://stein.investments 您的全面市场监控。每个交易品种超过3,000次自动优化。2种警报类型。一键切换图表并采取行动。 为何您需要此工具 大多数多标的扫描器仅展示价格 波动 。每只股票的波动率、百分比变化、RSI。您仍需自行摸索正确的策略、合适的止损位以及理想的入场阈值。Power Candles策略扫描器针对每只股票自动解答这些问题,仅在数学验证过的交易设置中触发实际入场信号时才会向您发出提示。这就是全部卖点。 自动
ABQ Visual Risk Sizer
Cristian David Castillo Arrieta
ABQ Visual Risk Sizer - 机构级风险管理与交易执行工具 类别:实用工具 / 风险管理 手动计算手数既耗时又费钱。 在现代交易中,特别是在操作自营交易账户(Prop Firms)时,手数计算错误或下单延迟5秒都可能意味着违反每日回撤规则,或错过完美的入场价格。 ABQ Visual Risk Sizer 是一款专为彻底解决这一问题而设计的机构级工具。它将复杂的风险数学计算转化为直观、快速且100%准确的视觉体验,直接在您的 MetaTrader 5 图表上运行。 忘记外部计算器或 Excel 表格吧。只需在图表上拖动线条,即可实现一键交易。 为什么您需要 ABQ Visual Risk Sizer 为自营交易公司提供全面保护: 确保每笔交易的风险完全符合您设定的百分比(或金额)。在黄金或纳斯达克等高波动性资产中,再也不会开错手数。 反应速度: 当您用鼠标移动止损位时,毫秒级计算风险、所需保证金和风险回报比。 通用资产计算: 内部算法自动读取交易商的报价步长(Tick Size)和报价价值(Tick Value)。完美适用于外汇、指数、大宗商品、股票和加密货币。 主要
Trade Dashboard MT5
Fatemeh Ameri
4.94 (123)
疲于复杂的订单下达和手动计算?Trade Dashboard 是您的解决方案。凭借其用户友好的界面,订单下达变得轻而易举,只需点击一下,您就可以开设交易、设置止损和止盈水平、管理交易手数,并计算风险回报比,让您只需专注于您的策略。告别手动计算,使用 Trade Dashboard 简化您的交易体验。 立即下载演示版本 。 您可以在这里找到仪表盘功能和特性的详细信息 。 加入 Telegram 频道 。 购买后请给我发消息以获取支持。如果您需要添加更多功能,可以在产品的评论区留下您的想法,我愿意听取任何建议,希望您能在使用我的产品时获得最佳体验 。 这是 MT4 版本。 风险管理:使用 Trade Dashboard,可以将您的风险设置为账户余额或权益的百分比,或将风险设置为总金额。在图表上直观地定义您的止损,让工具准确计算每个货币对的适当手数。该工具还可以根据您期望的风险回报比自动设置止盈水平。它甚至可以在手数计算中涵盖佣金和点差费用。此外,您的止损和止盈可以转变为虚拟水平,隐藏于经纪商。通过 Trade Dashboard 的高级风险管理功能,掌控风险,保护您的资本。 交易线
Exp COPYLOT CLIENT for MT5
Vladislav Andruschenko
3.82 (34)
适用于 MetaTrader 5 的专业交易复制器 快速、专业、稳定可靠的 交易复制器 ,适用于 MetaTrader 。 COPYLOT 可在 MT4 和 MT5 终端之间复制 Forex 交易,并支持 Hedge 和 Netting 账户。 COPYLOT 的 MT5 版本支持: - MT5 Hedge → MT5 Hedge - MT5 Hedge → MT5 Netting - MT5 Netting → MT5 Hedge - MT5 Netting → MT5 Netting - MT4 → MT5 Hedge - MT4 → MT5 Netting MT4 版本 完整说明 + DEMO + PDF 如何购买 如何安装 如何获取日志文件 如何测试和优化 Expforex 的所有产品 您也可以将交易复制到 MT4 终端(MT4 → MT4,MT5 → MT4): COPYLOT CLIENT for MT4 COPYLOT 是一款专业的交易和持仓复制器,可同时与 2、3 甚至 10 个终端协同工作。 支持从 模拟账户和投资者账户 复制,也支持同时在多个终端上运行。 您可以使
Footprint Chart Pro — Professional OrderFlow EA for MetaTrader 5 Version 6.34 | Professional tool for real traders | Institutional-Grade Visualization DEMO USERS - PLEASE SELECT EVERY TICK / REAL TICK WHEN TESTING AND YOU HAVE DOWNLOADED HISTORICAL DATA. IF YOU SEE A WAITING SCREEN AND IT IS NOT DOWNLOADING, IT MEANS YOU HAVE LOW HISTORICAL DATA. TRY 1 MIN AND 5 MIN FIRST ON 1 DAY DATA. ONE DAY DATA SHOULD BE THE NEWEST AND MOST CURRENT DATE. PLEASE WAIT UNTIL THE MARKET HAS ROLLED OVER PERIOD.
AntiOverfit PRO MT5
Enrique Enguix
5 (4)
在购买 EA 之前,先确认它到底是真的扛得住,还是只是刚好在回测里走运。 大多数机器人都是靠一份漂亮的回测卖出去的。 曲线一路向上。 Profit Factor 很好看。 看起来几乎没有疑点。 但即便如此,很多 EA 只要市场不再按照那段历史那样运行,很快就会出问题。 为什么? 因为回测只能证明一件事: 这个策略曾经在某一条特定的价格路径上有效。 它不能证明它在其他路径下也能扛住。 不能证明它足够稳健。 更不能证明它值得你花钱。 因为你买 EA,不是为了欣赏过去那条漂亮的曲线。 你买它,是为了在会变化的市场里使用它。 AntiOverfit PRO 是做什么的 AntiOverfit PRO 帮你判断一个 MetaTrader 5 Expert Advisor 到底是真的够扎实,还是只是恰好适配某一段特定历史。 它的原理其实很容易理解: 它拿真实历史数据,生成许多与原始历史相似、但路径不同的版本,然后让你看到当市场不再完全照着原来的路线走时,这个 EA 会有什么表现。 如果你只是稍微改变一下市场路径,这个机器人就开始失效,那就是个坏信号。 而如果它在许多与原始历史相似的场景里都能稳住
Timeless Charts
Samuel Manoel De Souza
5 (4)
Timeless Charts is an advanced charting solution designed for professional traders seeking for custom charts / custom timeframes , including seconds charts / seconds timeframe, renko charts / renko bars, cluster charts / footprint charts and advanced tools present in most of the popular platforms. Unlike traditional offline charts or simplistic custom indicators, this solution constructs fully custom bars with true timestamp accuracy , down to miliseconds, allowing for a powerful and precise tr
Copy Cat More Trade Copier MT5 (复制猫MT5) 是一个本地跟单软件,也是一个完整的风险管理和执行框架,专为当今的交易挑战而设计。从资金管理公司挑战到个人投资组合管理,它能适应各种情况,结合了稳健的执行、资本保护、灵活配置和高级交易处理功能。 该跟单软件可在主端(发送方)和从端(接收方)模式下工作,实时同步市价单和挂单、交易修改、部分平仓和对冲平仓操作。它兼容模拟和实盘账户、交易或投资者登录,并通过持久的交易记忆系统确保恢复功能,即使EA、终端或VPS重启也不例外。可以同时管理多个主端和从端,使用唯一ID,并通过前缀/后缀调整或自定义品种映射自动处理跨经纪商差异。 手册/设置  | Copy Cat More MT4 | 频道  特色功能: 易于设置——快至30秒(见视频)。 快速、稳定、准确——Turbo模式下低延迟复制(见截图)。 高安全性——不使用潜在危险的DLL或WebRequest。 持久交易记忆,避免孤立、丢失或不准确的交易。 可从手动或EA复制,支持所有账户类型。 品种自动前缀/后缀,快速设置;支持MT4和MT5之间复制。 非常灵活的多主端
Trade Manager DashPlus
Henry Lyubomir Wallace
5 (13)
DashPlus 是一款先进的交易管理工具,旨在提升您在 MetaTrader 5 平台上的交易效率和效果。它提供一整套功能,包括风险计算、订单管理、先进的网格系统、基于图表的工具和绩效分析。 主要功能 1. 恢复网格 实施一个平均和灵活的网格系统,以在不利的市场条件下管理交易。 允许设置战略性进出点,以优化交易恢复。 2. 叠加网格 通过在强劲的市场波动中增加仓位,最大化有利交易的潜在回报。 帮助您通过扩展获利交易来利用趋势市场。 3. 盈亏线 在图表上直接提供潜在利润和损失场景的可视化表示。 调整设置并拖动盈亏线,以在执行之前评估各种交易结果。 4. 篮子模式 简化同一交易品种的多仓位管理,将它们合并为一个聚合仓位。 基于平均价格,便于监控和应用止损、止盈以及其他订单修改。 5. 图表上的新闻 将预定的经济新闻事件整合到您的交易图表中。 帮助您随时掌握可能影响市场波动的即将发生的事件,从而更好地规划交易。 6. 警报 设置基于时间或价格的警报,通知会显示在 MT5 中,或通过 MT5 应用发送到您的移动设备。 对监控关键价格水平或重要的交易时段非常有用。 7. 绩效统计 提供详细的
Custom Alerts AIO:多市场智能监控,一键启动,无需设置 概述 Custom Alerts AIO 是一款“开箱即用”的高级市场扫描工具,无需额外安装任何其他指标或进行复杂设置。它内置了 Stein Investments 的所有核心指标(FX Power、FX Volume、FX Dynamic、FX Levels 和 IX Power),可帮助您轻松监控所有主要资产类别,如外汇、黄金、指数和加密货币。如果您的经纪商支持股票,您也可以手动添加个股进行监控。 1. 为什么选择 Custom Alerts AIO? 无需额外购买任何指标 • 所有关键指标均已内置,开箱即用。 • 专注于实时预警,不包含任何图形元素,性能高效,界面简洁。 全面覆盖所有主要市场 • 支持监控外汇、金属、加密货币和指数市场。 • 无需手动输入任何交易品种,只需在设置中勾选资产类别即可启用。 • 股票并不属于默认类别,如有需要可手动通过参数输入添加。 高效、专业、便捷 • 无需图表模板和手动加载,适合自动化或远程交易环境。 • 非常适合 VPS 上长期运行,或作为后台市场预警工具使用。 2
MetaTrader 5 专业交易面板 —— 图表与键盘一键交易的高效控制中心 一款面向主动交易者的专业 Trading Panel,可让您比标准 MetaTrader 操作方式更快、更直观地完成开仓、平仓、修改、管理与控制。 这不是一个普通的小工具,而是一个为高频手动操作、仓位管理、挂单控制与利润管理而设计的完整交易工作台。 通过这套面板,您可以直接在图表上一键执行交易,通过键盘快速触发核心操作,并借助自动参数计算、图形提示、信息标签以及可视化管理功能,大幅减少重复性操作,让整个交易流程更加流畅、高效且专业。 使用我们的交易面板,您可以直接从图表上一键下单,执行交易操作的速度可比标准 MetaTrader 控件快约 30 倍。 MT4 版本 | 完整说明 + DEMO + PDF | 如何购买 | 如何安装 | 如何获取日志文件 | 如何测试与优化 | Expforex 的所有产品 为什么交易者会选择这套面板 图表一键交易 ,并支持键盘快速操作 快速完成开仓、平仓、修改、反转、锁仓与部分平仓 深度控制仓位、挂单、总利润与风控逻辑 自动参数计算,减少手动输入与重复劳动 图表可视化管理
Telegram to MT5 Coppy
Sergey Batudayev
5 (8)
Telegram 到 MT5: 终极信号复制解决方案 使用 Telegram 到 MT5 简化您的交易,这款现代化工具可直接从 Telegram 频道和聊天室复制交易信号到您的 MetaTrader 5 平台,无需 DLL 文件。这款强大的解决方案可确保精准的信号执行、丰富的自定义选项,节省时间并提高您的效率。 [ Instructions and DEMO ] 主要特点 直接 Telegram API 集成 通过电话号码和安全码进行身份验证。 通过用户友好的 EXE 桥轻松管理聊天 ID。 添加、删除和刷新多个频道/聊天以同时复制信号。 使用高级过滤器进行信号解析 跳过包含异常词(例如“报告”、“结果”)的不需要的信号。 支持灵活的 SL 和 TP 格式:价格、点数或点数。 自动计算指定点而不是价格的信号的切入点。 订单定制和灵活性 使用多种模式配置订单大小:固定手数、动态手数(% 风险)或特定符号手数。 使用信号数据或自定义参数调整 SL/TP。 设置滑点限制、挂单到期时间和重试参数,以实现无缝执行。 综合符号管理 排除特定符号或映射到特定经纪人的符号。 自定义信号和经纪商符号之间
Telegram To MT5 Receiver
Levi Dane Benjamin
4.31 (16)
将信号从您所属的任何渠道(包括私人和受限渠道)直接复制到您的 MT5。 该工具在设计时充分考虑了用户的需求,同时提供了管理和监控交易所需的许多功能。 该产品采用易于使用且具有视觉吸引力的图形界面。 自定义您的设置并在几分钟内开始使用该产品! 用户指南 + 演示  |   MT4版本  |   不和谐版本 如果您想尝试演示,请参阅用户指南。 Telegram To MT5 接收器在策略测试器中不起作用! Telegram 至 MT5 功能 一次复制多个通道的信号 从私人和受限频道复制信号 不需要机器人令牌或聊天 ID(如果出于某种原因需要,您仍然可以使用这些) 使用风险百分比或固定手数进行交易 排除特定符号 选择复制所有信号或自定义要复制的信号 配置单词和短语以识别所有信号(默认值应适用于 99% 的信号提供商) 配置时间和日期设置以仅在需要时复制信号 设置一次打开的最大交易量 交易和头寸管理 使用信号或自动设置的管理 通过设置每月、每周、每天、每小时或每分钟的最大交易次数,停止过度交易和报复性交易。 支持市价订单和挂单 每日最大利润目标(以美元为单位)以确保头寸并停止过度交易 确
Anchor Trade Manager
Kalinskie Gilliam
5 (2)
Anchor: The EA Manager Run your full EA portfolio without conflicts, without stacked risk, and without watching every chart yourself. Anchor coordinates up to 64 Expert Advisors on a single account so only one trades at a time. Attach Anchor to any chart. Type your EA names and magic numbers in one line. Anchor handles the rest. Built for portfolios. Built for discipline. Built for prop firms. The Problem Running multiple EAs on the same account creates risk. Two gold EAs can open opposite posit
Ultimate Extractor
Clifton Creath
5 (9)
Ultimate Extractor - Professional Trading Analytics for MT5 *****this is the local HTML version of Ultimate Extractor. !!!!!it is not compatible with Cloud!!!! For the online version please reach out to me directly****** Ultimate Extractor transforms your MetaTrader 5 trading history into actionable insights with comprehensive analytics, interactive charts, and real-time performance tracking. What It Does Automatically analyzes your MT5 trading history across all Expert Advisors and generates
Seconds Chart MT5
Boris Sedov
4.59 (17)
秒级图表 (Seconds Chart) - 一款专为 MetaTrader 5 设计的独特工具,用于创建秒级时间框架的图表。 通过 秒级图表 ,您可以构建以秒为单位的时间框架图表,获得标准分钟或小时图表无法提供的极致灵活性和分析精度。例如,时间框架 S15 表示每根蜡烛图持续15秒。您可以使用任何支持自定义交易品种的指标和EA交易系统。操作它们就像在标准图表上交易一样方便。 与标准工具不同, 秒级图表 让您能够在超短时间框架下进行高精度交易,无延迟干扰。 秒级图表的优势 支持 1至900秒 的时间框架图表。 基于内置的实时报价数据库, 即时加载 历史数据。 数据实时更新, 无延迟或滞后 。 可同时创建 多个秒级图表 。 秒级图表的理想应用场景 剥头皮交易 和高频交易。 精确的入场和出场时机。 在短时间框架下测试交易策略。 时间框架设置 默认设置包含以下时间框架: S1、S2、S3、S4、S5、S6、S10、S12、S15、S20、S30 。 您可轻松自定义时间框架组合,只需按升序列出 1至900秒 的数值且避免重复即可。 其他免费工具 快速交易管理器 ( Quick Trade Ma
HINN MagicEntry Extra
ALGOFLOW OÜ
4.71 (14)
HINN MAGIC ENTRY – the ultimate tool for entry and position management! Place orders by selecting a level directly on the chart! full description   ::  demo-version  :: 60-sec-video-description Key features: - Market, limit, and pending orders - Automatic lot size calculation - Automatic spread and commission accounting - Unlimited partitial take-profits  - Breakeven and trailing stop-loss and take-profit  functions - Invalidation leves - Intuitive, adaptive, and customizable interface - Works
HINN Lazy Trader
ALGOFLOW OÜ
5 (2)
The core idea: using the user interface, you configure the parameters the chart must meet before entering a position (or positions), choose which entry models to use, and set the rules for when trading and planning should end. Lazy Trader  handles the rest: it  takes over all the routine chart watching and execution! full description  :: 3 key videos [1] ->  [2]   ->  [3] What can it do? - Understands Larry Williams market structure - Understands swing market structure by Michael Huddleston
Cerberus Equity Watcher
Samuel Bandi Roccatello
5 (3)
Cerberus the Equity Watcher 是一种风险管理工具,可以持续监控您的账户资产并避免因错误的 EA 或您的情绪行为(如果您是全权交易者)导致的重大亏损。对于依赖 EA 的系统交易者来说,它非常有用,EA 可能包含错误,或者在意外的市场条件下可能表现不佳。 Cerberus 允许您设置最小净值和(可选)最大值,如果达到其中任何一个,则所有头寸都被平仓,所有挂单被关闭,所有 EA 被“杀死”。在展平所有位置后,将向用户手机发送通知,并在屏幕上显示一条清晰的消息。在“扁平化”之后, Cerberus 继续关注股权价值,并继续扼杀任何进一步的交易尝试,直到它被重新初始化。 Cerberus 执行的任何操作都清楚地显示在屏幕上,报告在“专家顾问”选项卡上,并向用户发送通知。为了避免用户错误,对用户输入的输入值和自动交易的当前状态进行了多次检查。 ****** 特征 最小和最大权益值可以以账户货币或初始权益的百分比设置 最大净值是可选的 如果达到最小/最大净值,则所有 EA 将独立于它们交易的符号被终止 第一次压扁后几秒钟进行双重检查 Cerberus 在拉平后也继续监控股权
The product will copy all telegram signal to MT5 ( which you are member) , also it can work as remote copier.  Easy to set up, copy order instant, can work with almost signal formats, image signal,  s upport to translate other language to English Work with all type of channel or group, even channel have "Restrict Saving Content", work with  multi channel, multi MT5 Work as remote copier: with signal have ticket number, it will copy exactly via ticket number. Support to backtest signal. How to s
Poc Breakout Signal: The Ultimate Institutional Order Flow & Price Action System Elevate your trading with Poc Breakout, a comprehensive technical analysis tool designed to bridge the gap between retail trading and institutional market understanding. This all-in-one system combines powerful Buy/Sell signals, advanced Volume Profile analysis, real-time Order Flow (Depth of Market), and critical macroeconomic data to give you a clear, unambiguous edge in the markets. Poc Breakout Signal decodes c
MT5 to Telegram Signal Provider 是一个易于使用且完全可自定义的工具,它允许向 Telegram 的聊天室、频道或群组发送 指定 的信号,将您的账户变为一个 信号提供商 。 与大多数竞争产品不同,它不使用 DLL 导入。 [ 演示 ] [ 手册 ] [ MT4 版本 ] [ Discord 版本 ] [ Telegram 频道 ]  New: [ Telegram To MT5 ] 设置 提供了逐步的 用户指南 。 不需要了解 Telegram API;开发者提供了您所需的一切。 关键特性 能够自定义发送给订阅者的订单详情 您可以创建分层的订阅模型,例如铜、银、金。其中金订阅获得所有信号等。 通过 id、符号或评论过滤订单 包括执行订单的图表截图 在发送的截图上绘制已关闭的订单,以便额外核实 延迟发送新订单消息的可能性,以便在发送前对位置进行调整 订单详情完全透明: 新的市场订单*带截图 订单修改(止损、获利) 已关闭的订单*带截图 部分关闭的订单** 新的挂单 修改的挂单(进场价格) 挂单激活(作为新的市场订单附加) 已删除的挂单 历史订单报告
Trade Assistant 38 in 1
Makarii Gubaydullin
4.91 (23)
多功能工具:手数计算器,网格订单,风险回报比,交易管理器,供求区域,价格行为等等 演示版本   |   用户手册 交易助手   不能在策略测试器中工作 :您可以下载   此处的演示版本  来测试此 工具 。 联系我   如有任何问题  / 改进建议 / 发现错误 如需MT4版本,请访问 此处 简化、加速并自动化您的交易   流程 。通过此   仪表板 扩展标准终端功能。 交易面板  适用于任何交易品种:外汇、股票、指数、加密货币等。 1. 开立新交易 :手数 / 风险 / 风险回报比计算 :手动交易的风险管理 手数计算器(根据风险大小计算交易量) 风险计算器(根据手数大小计算风险金额) 风险回报   比率 网格订单:  + 动态距离选项,及拆分手数选项 订单激活触发器,+ 买入止损限价 / 卖出止损限价 虚拟止损,虚拟止盈(隐藏止损,隐藏止盈:经纪商不可见) 智能止损 / 入场价位:若K线收盘突破则避免虚假触发 隐藏订单(虚拟挂单) 计划订单:即使市场休市也可挂单交易(周末计划器) 额外多级止盈价位 具有不同ID的OCO(一单取消另一单)订单 图表上的交易可视化 + 调整 止损 /
Bots Builder Pro MT5
Andrey Barinov
4.17 (6)
This is exactly what the name says. Visual strategy builder . One of a kind. Turn your trading strategies and ideas into Expert Advisors without writing single line of code. Generate mql source code files with a few clicks and get your fully functional Expert Advisors, which are ready for live execution, strategy tester and cloud optimization. There are very few options for those who have no programming skills and can not create their trading solutions in the MQL language. Now, with Bots Builde
作者的更多信息
1. Why did I develop this series of indicators I found that most traders need to use multiple time frame indicators. They usually switch time frame to see indicators. However, once the timeframe is switched, you cannot see the  corresponding relationship  between  the price in the smaller timeframe  and  the indicator in the larger timeframe . For example: if your price chart is in H1 timeframe, you can see H4, D1 and W1 indicators in H1 timeframe Chart. This is more helpful for you to find th
This product can be used to synchronize multiple Charts, and each Chart can be set to a different sync mode. With this product you can better view and manipulate charts: different time frames for a single Symbol, the same time frame for multiple Symbols... and more. PS: The link below is the FreeDemo product, you can use it on EURUSD/XUAUSD/USDCNH symbol: https://www.mql5.com/en/market/product/38557 Feature: Chart settings  can be synchronized, including : background, indentation, size, etc. M
1.这是什么: 下载Market Watch中所有的Symbol数据到系统。PS:不是把数据输出到文档。 2.为什么要用这个: 如果系统中没有数据:网络链接不好的时候,用MT5看一个Symbol需要等待很长时间;在不同Symbol或不同TimeFrame切换,如果系统没有数据也需要等待很久;如果进行长时间回测,系统没有数据,需要下载很长时间。 所以提前把历史数据下载到系统中,能提高工作效率。 3.怎么使用: parameters: input bool bool_usualtimeframe=true; //true-系统默认TimeFrames; || false-所有的TimeFrames. input bool bool_allSymbol=true; //true-Market Watch中所有品种; || false-根据你的输入 input string input_Symbol=NULL; //上面参数为false时,输入你的Symbol名称 input datetime time_Start=D'2017.01.01'; //默认数据下载开始时间 input int s
Do you think it's a bit cumbersome when you need to switch symbols or timeframes with mouse click? 1. What is this? This is a program that can switch symbols and timeframes with direction keys. Fast switching, very convenient, no mouse click required. For traders, one symbol with multi-timeframe charts are usually added,  you can change symbol on those charts easily. For multi-currency traders, different symbol charts are usually added, you can also change those timeframes easily. I wrote this p
1.这是什么         上涨波动和下降波动是不一样的,无论是学术研究还是实际检验都说明了这一点。         原始的ATR指标是把上涨波动和下降波动放在一起进行计算。本指标则是把上涨波动和下降波动分开进行计算,这样能更好的帮助你研究市场。 2.指标说明         本指标的计算有两种模式,如下表所示: 0 1 2 3 4 5 波动方向 + - + + - + TR 15 20 17 5 16 8 原始ATR (15+20+17+5+16+8)/6=13.5 模式1 不以0填充位置,周期数改变 模式1上涨TR 15 17 5 8 模式1下跌TR 20 16 模式1上涨ATR (15+17+5+8)/4=11.25 模式1下跌ATR (20+16)/2=18 模式2 以0填充位置,周期数不变 模式2上涨TR 15 0 17 5 0 8 模式2下跌TR 0 20 0 0 16 0 模式2上涨ATR (15+0+17+5+0+8)/6=7.5 模式2下跌ATR (0+20+0+0+16+0)/6=6         如上表。比如周期为6的序列中,有4个上涨2个下跌。模式1不
Do you think it's a bit cumbersome when you need to switch symbols or timeframes with mouse click? 1. What is this? This is a program that can switch symbols and timeframes with direction keys. Fast switching, very convenient, no mouse click required. For traders, one symbol with multi-timeframe charts are usually added,  you can change symbol on those charts  easily . For multi-currency traders, different symbol charts are usually added, you can also change those timeframes easily. I wrote thi
According to trading experience: Some symbols are easy to reverse on certain days, such as Monday, or afternoon, and so on. So comparing the current price with the corresponding historical moment price is valuable. If the price coordinate system uses a logarithmic price, you will get a lot of valuable information. 1. What is this? This program can convert the symbol price and add it to your Chart. You can compare it with your major chart. The DEMO version Link: https://www.mql5.com/en/market/pr
What is this: Violent trading: means sending a large number of orders to your brokerage server,  it can conduct a stress test of the trading. In this program you can run a variety of trading tests.  Now you can trade at high speed, For example 1000 orders in an instant. The Demo version's link:  https://www.mql5.com/en/market/product/38431/ Why to use: Whether manual trading or EA trading,  the status of the broker server is very important. So it is beneficial to conduct a trading stress test on
1. Why did I develop this series of indicators I found that most traders need to use multiple time frame indicators. They usually switch time frame to see indicators. However, once the timeframe is switched, you cannot see the  corresponding relationship  between  the price in the smaller timeframe  and  the indicator in the larger timeframe . For example: if your price chart is in H1 timeframe, you can see H4, D1 and W1 indicators in H1 timeframe Chart. This is more helpful for you to find th
筛选:
无评论
回复评论