AlgoTrade ATR Stop Levels

AlgoTrade ATR Stop Levels displays the average true range (ATR) of the chart symbol and the stop distance: ATR times a multiplier. It draws the stop for a buy and the stop for a sell on the chart, and shows the ATR on four timeframes on a card. It reads data only.

What it does

  • The ATR of the last closed bars (14 by default), on the chart timeframe or on M15, H1, H4 or D1.
  • Stop distance equals ATR times the multiplier (1.5 by default), rounded up to whole ticks.
  • Two dashed lines from the newest bar: the stop for a buy below the bid, and the stop for a sell above the ask, with their prices.
  • A card with the ATR in points and as a % of price, compared with the usual range of the last 100 bars.
  • The loss at the stop for 1.00 lot in your account currency, including the current spread, from the broker's tick value.
  • A table with the ATR and the stop distance on M15, H1, H4 and D1, and the loss for 1.00 lot on each.
  • Short Sunday daily candles are skipped on symbols that close for the weekend (can be turned off).

How to use

  • Attach the indicator to any chart. Set the ATR period, the multiplier and the timeframe of the lines in the inputs.
  • Click "Fold" to show a single line, or "Show" to display the full card. The card corner and the line colors can be changed in the inputs.
  • The loss does not include commission or swap.

Inputs: ATR period, multiplier, timeframe of the lines, Sunday candle skipping, lines, line colors, card corner.

Please read

  • This indicator reads data only and does not open, modify, or close trades.
  • For questions or feature requests, please post in the comments section on this page. Your reviews help us plan updates.

Made by AlgoTrade Pte. Ltd. Trading always carries risk. Past results do not guarantee future results.

Рекомендуем также
Value Chart Candlesticks
Flavio Javier Jarabeck
4.57 (14)
The idea of a Value Chart indicator was presented in the very good book I read back in 2020 , " Dynamic Trading Indicators: Winning with Value Charts and Price Action Profile ", from the authors Mark Helweg and David Stendahl. The idea is simple and the result is pure genius: Present candlestick Price analysis in a detrended way! HOW TO READ THIS INDICATOR Look for Overbought and Oversold levels. Of course, you will need to test the settings a lot to find the "correct" one for your approach. It
FREE
Trade Behavior Mirror читает только уже закрытую историю сделок вашего собственного счёта и считает один конкретный паттерн: открытие новой позиции вскоре после зафиксированного убытка, с лотом больше вашего обычного объёма. Инструмент ничего не прогнозирует и не даёт советов. Каждая цифра на панели - это то, что уже произошло на этом счёте. Как строятся цифры: инструмент читает до 31 дня закрытых сделок по всем символам и всем магическим номерам - это картина всего счёта, а не только символа,
FREE
Sierra Capital Session Sweep Scanner maps out the Asian, London, and New York trading sessions directly on your chart, then watches for a specific price-action pattern: a candle that spikes through the Asian session's high or low and closes back inside it — a classic liquidity sweep. What it shows: Colour-coded boxes marking the Asian, London, and NY session ranges, with the Asian high/low projected forward as reference lines Arrows marking each qualifying sweep-and-reject candle, with projected
FREE
Zaxti Trend Levels [SORSAWO]: Where Algorithmic Precision Meets Visual Elegance Step into a new era of technical analysis. Zaxti Trend Levels is not just another charting tool; it is a comprehensive trend-visualization engine crafted for the discerning trader. By seamlessly blending the mathematical rigor of advanced adaptive filtering with intuitive visual mapping, this indicator transforms chaotic price action into a clear, actionable roadmap. Designed to eliminate noise and highlight what tru
FREE
Blahtech VWAP - Volume Weighted Average Price (VWAP) is the ratio of price to total volume. It provides an average price over a specified time interval.  Links [  Install  |  Update  |  Documentation   ] Feature Highlights Configurable VWAP Line Sessions, intervals, anchored or continuous Previous day settlement line Standard Deviation bands Alerts at bar close or real time Automatic Broker or Tick volumes Significantly reduced CPU usage Input Parameters Expert Advisor Mode  - Reserved for iCu
FREE
Mae Pla Green Pen Analysis Framework The Mae Pla Green Pen Analysis Framework is a multi-timeframe price action scanner for XAUUSD (Gold Spot) . It monitors all 9 timeframes simultaneously — M1, M5, M15, M30, H1, H4, D1, W1, and MN — and displays pattern detection results on a real-time dashboard drawn directly on the chart. The indicator is based on the Mae Pla Green Pen trading methodology, which uses structured price action patterns to identify potential trade setups. Pattern Detection Three
FREE
QuantumAlert Stoch Navigator is a free indicator available for MT4/MT5 platforms, its work is to provide "alerts" when the market is inside "overbought and oversold" regions in the form of "buy or sell" signals. This indicator comes with many customization options mentioned in the parameter section below, user can customise these parameters as needful. Join our   MQL5 group , where we share important news and updates. You are also welcome to join our private channel as well, contact me for the p
FREE
Smart Flow - Institutional Aggression Tracker Smart Flow is a powerful and intuitive indicator designed to read the true market order flow and identify zones of strong institutional aggression. Instead of guessing tops and bottoms, Smart Flow directly paints your chart's candles whenever it detects a relevant directional capital injection, making your trading decisions highly objective. Working Principle The indicator performs an advanced mathematical calculation on every candle to estimate the
FREE
SMC LIQUIDITY Advanced Institutional-Grade Smart Money and Liquidity Analysis Suite for MT5 SMC LIQUIDITY is a comprehensive institutional toolkit engineered for traders who require precise liquidity mapping, market structure intelligence, smart money concepts, and order flow awareness in a single integrated interface. It is designed for professional workflow, multi-timeframe clarity, and seamless execution in fast-moving conditions. This indicator combines several institutional methodologies in
FREE
RSI back arrows
Smaylle Rafael Coelho Mariano
The   RSI Back Arrows   indicator is a powerful tool designed for traders who rely on the Relative Strength Index (RSI) to identify potential market reversals. This indicator specifically highlights when the RSI has exited the   oversold   or   overbought   zones, providing clear visual signals to inform trading decisions. Key Features: Visual Cues : The indicator marks arrows on the chart when the RSI crosses back into a neutral zone, making it easy to spot potential entry and exit points. Over
FREE
Этот мощный инструмент предназначен для того, чтобы помочь трейдерам идентифицировать на своих графиках ключевые модели разворота, в том числе фигуры «молот» и «звезда». С помощью этого индикатора вы можете быстро и легко обнаруживать эти модели по мере их формирования, что позволяет вам совершать хорошо информированные сделки и потенциально увеличивать свою прибыль. Индикатор Hammer Start настраивается, что позволяет вам устанавливать собственные параметры для выявления паттернов и предупреж
FREE
Wave Box Market Frenquency
Jean Jacques Huve Ribeiro
4.75 (4)
Totally linked to the result of a movement and the duration he had. Its height records how many ticks the asset walked during a given movement, its width shows us the duration that movement had. Its configuration must be in line with the Weis Wave Indicator configuration to observe the movement force and can indicate a possible accumulation or distribution of the movement;
FREE
High Low Open Close
Alexandre Borela
4.98 (46)
Если вам нравится этот проект, оставьте 5-звездочный обзор. Данный показатель рисует открытые, высокие, низкие и закрывающие цены на указанные период и его можно отрегулировать для специфического часового пояса. Это важные уровни, которые выглядят многие институциональные и профессиональные трейдеры и могут быть полезны для вас, чтобы знать места, где они могут быть больше активный. Доступные периоды: Предыдущий день. Предыдущая неделя. Предыдущий месяц. Предыдущий квартал. Предыдущий год. Или
FREE
PZ Penta O MT5
PZ TRADING SLU
3.8 (5)
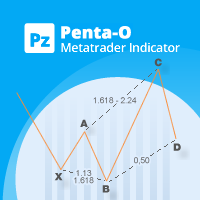
The Penta-O is a 6-point retracement harmonacci pattern which usually precedes big market movements. Penta-O patterns can expand and repaint quite a bit. To make things easier this indicator implements a twist: it waits for a donchian breakout in the right direction before signaling the trade. The end result is an otherwise repainting indicator with a very reliable trading signal. The donchian breakout period is entered as an input. [ Installation Guide | Update Guide | Troubleshooting | FAQ | A
FREE
Общее описание Этот индикатор — усовершенствованная версия классического канала Дончия с добавлением практических функций для реальной торговли. Помимо стандартных трёх линий (верхняя, нижняя и средняя), система определяет пробои и отображает их на графике стрелками, показывая только линию, противоположную текущему направлению тренда для более чистого восприятия. Индикатор включает: Визуальные сигналы : цветные стрелки при пробое Автоматические уведомления : всплывающие окна, push и email Фильтр
FREE
Вчерашние максимум и минимум, недельное открытие, диапазон прошлой недели: ровно те линии, которые большинство трейдеров каждое утро перерисовывает вручную.   Daily Weekly Monthly Key Levels   строит их автоматически по свечам вашего собственного брокера и показывает, насколько цена отстоит от каждой. Приближайте сколько угодно, ничего не пропадёт, потому что   любой уровень за пределами видимой области прижимается к краю графика   подписанной ценовой меткой со стрелкой. Никаких сигналов, без пе
FREE
Midpoint Magnet MT5 — индикатор уровней 50% ценового импульса, FVG и Smart Money Midpoint Magnet MT5 — технический индикатор для MetaTrader 5, предназначенный для анализа ценовых импульсов и уровней равновесия в рамках концепций Smart Money Concepts (SMC) и ICT. Индикатор автоматически обнаруживает зоны Fair Value Gap (FVG), определяет начало импульса по подтверждённым фракталам и строит динамический уровень 50% (Equilibrium) между началом импульса и его текущим экстремумом. Уровень используется
FREE
Добро пожаловать в наш   паттерн ценовой волны   MT5 --(паттерн ABCD)-- Паттерн ABCD является мощным и широко используемым торговым паттерном в мире технического анализа. Это гармонический ценовой паттерн, который трейдеры используют для определения потенциальных возможностей покупки и продажи на рынке. С помощью паттерна ABCD трейдеры могут предвидеть потенциальное движение цены и принимать обоснованные решения о том, когда открывать и закрывать сделки. Версия советника:   Price Wave EA MT5
FREE
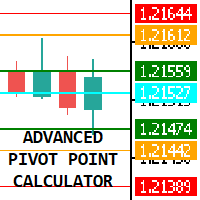
The Advanced Pivot Point Indicator is a powerful tool designed to help traders identify key support and resistance levels in the market. This versatile indicator offers a customizable and user-friendly interface, allowing traders to select from five different pivot point calculation methods: Floor, Woodie, Camarilla, Tom DeMark, and Fibonacci. With its easy-to-read lines for pivot points (PP), support (S1, S2, S3, S4), and resistance (R1, R2, R3, R4) levels, the Advanced Pivot Point Indicator pr
FREE
Описание индикатора ST Pure Path для Metatrader Описание индикатора ST Pure Path для Metatrader Этот документ призван предоставить четкое и доступное описание индикатора ST Pure Path , разработанного для платформы Metatrader. Он предназначен для помощи трейдерам, особенно тем, у кого мало опыта, в визуальном и интуитивном определении рыночных тенденций и точек принятия решений. 1. Визуальная идентификация ST Pure Path отображается на графике как непрерывная, сплошная линия толщиной 2 пикселя, ко
FREE
Индикатор Shadow Flare — это не перерисовывающийся инструмент для работы с трендом и ликвидностью в MetaTrader 5. Он строит настраиваемую базовую скользящую среднюю (HMA, EMA, SMA или RMA), обёрнутую в Envelope на основе Average True Range, и формирует «липкое» трендовое состояние, которое меняется только тогда, когда цена закрытия пробивает верхнюю или нижнюю границу диапазона. Та же тренд‑логика управляет автоматическим модулем зон спроса/предложения: он находит локальные максимумы и минимумы,
FREE
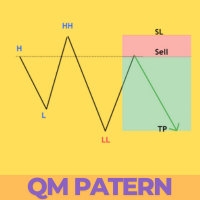
Simple QM Pattern   is a powerful and intuitive trading indicator designed to simplify the identification of the Quasimodo (QM) trading pattern. The QM pattern is widely recognized among traders for effectively signaling potential   reversals   by highlighting key market structures and price action formations. This indicator helps traders easily visualize the QM pattern directly on their charts, making it straightforward even for those who are new to pattern trading. Simple QM Pattern includes d
FREE
Friend of the Trend: Ваш Трекер Трендов Освойте рынок с помощью Friend of the Trend — индикатора, который упрощает анализ трендов и помогает определить лучшие моменты для покупки, продажи или ожидания. С интуитивно понятным и визуально привлекательным дизайном, Friend of the Trend анализирует движения цен и предоставляет четкие сигналы через цветной гистограмму: Зеленые полосы : Указывают на восходящий тренд, сигнализируя о возможностях для покупки. Красные полосы : Предупреждают о нисходящем тр
FREE
OmniSignal Navigator – Умный скальпинг на ключевых уровнях Торгуйте как профессионал с этим дневным/еженедельным индикатором High-Low-Close, разработанным для скальпинга и точной торговли на пробой. Почему это работает Идеально подходит для скальпинга: Ориентируется на ключевые зоны (PDH/PDL/PDC и PWH/PWL/PWC) на таймфреймах M2, M3, M5 и M15. (Меньшие таймфреймы = больше сигналов, большие таймфреймы = меньше сигналов) Не требуется анализ графика: просто ждите push-уведомлений (телефо
FREE
Nebula Gold Strike – Micro-Noise Heatmap + Hybrid Direction Logic + Tick Anomaly Detector   Version 1.3 | Copyright 2025 Bob's Channel | t.me/BobsGoldCrusherVIP "See the market in ticks — not bars."  What You Get in 1 Minute   - Hybrid Heatmap: Real-time color shows **direction + noise level** (green = bullish clean, dark red = bearish chaos).   - Tick Anomaly Dot: Yellow alert **the moment** a statistically weird tick arrives — no bar-close delay.   - DOM Imbalance Line: Buyer vs seller pr
FREE
Free automatic Fibonacci is an indicator that automatically plots a Fibonacci retracement based on the number of bars you select on the BarsToScan setting in the indicator. The Fibonacci is automatically updated in real time as new highest and lowest values appears amongst the selected bars. You can select which level values to be displayed in the indicator settings. You can also select the color of the levels thus enabling the trader to be able to attach the indicator several times with differe
FREE
Cybertrade Keltner Channels - MT5 Created by Chester Keltner, this is a volatility indicator used by technical analysis. It is possible to follow the trend of financial asset prices and generate support and resistance patterns. In addition, envelopes are a way of tracking volatility in order to identify opportunities to buy and sell these assets. It works on periods longer than the period visible on the chart. All values ​​are available in the form of buffers to simplify possible automations.
FREE
Smart Zones V1
Esmelindro Gedeao Rios Jacobsen
SMART ZONES is an advanced institutional indicator for MetaTrader 5 designed for traders who want to identify real market decision zones with precision and clarity. The indicator automatically plots: Previous day high Previous day low 50% range level POC (Point of Control) based on highest traded volume Main institutional value zones SMART ZONES helps traders identify: liquidity areas institutional defense zones possible reversals true breakouts market balance levels price acceptance and rejecti
FREE
Laser Trend Scalping Arrows
Carlos Mario Escobar Valderrama
5 (2)
Laser Trend Scalping Arrows draws a bright neon laser trend line through the middle of the candles so you can read the current trend at a glance: green for an uptrend, red for a downtrend. On top of the trend it marks the swing pivots and plots a clean white arrow every time the trend flips. This is the free edition. It gives you the laser trend engine and the visual signals, with no time limit, no account limit and no instrument limit. HOW IT WORKS - Laser trend line: a thick neon halo with a
FREE
Little useful tool - you manually select range on chart by dragging vertical blue lines and indicator shows support and resistance zones for this range and extends them outside of selected range.  Useful for: * Range trading * Range breakout * Range breakout & retest * Good entry during pullback in trend phase when previous high is retested * Good for scalping on short timeframes * Good for trades on longer timeframes around selected important zones like daily high or low
FREE
С этим продуктом покупают
Trend Sniper X
Sarvarbek Abduvoxobov
4.86 (43)
Trend Sniper X — это трендовый индикатор для MetaTrader 5, работающий на нескольких таймфреймах, который помогает трейдерам точно и ясно определять направление тренда и потенциальные точки разворота. для MT4: https://www.mql5.com/en/market/product/193245 Информация о цене: Текущая цена является промо-ценой и может измениться по мере выхода предстоящих обновлений и новых функций. Бонусное предложение: Чтобы получить БЕСПЛАТНЫЙ авто-трейд советник Assistant EA для этого индикатора, пожалуйста, на
Smart Trend Trading System — MetaTrader 5 После покупки напишите мне на MQL5, чтобы БЕСПЛАТНО получить Smart Universal Expert Advisor, а также доступ к онлайн-курсу, руководство в формате PDF и доступ к закрытой группе. STTS объединяет направление тренда, сигналы входа и выхода, зоны разворота и важные ценовые уровни прямо на графике. Торгуйте по системе вручную или подключите отдельный совместимый советник для автоматического исполнения с выбранными вами настройками. ОДНА СИСТЕМА. ЧЕТЫРЕ ТОРГОВ
Новый король в городе — Индикатор + управление ордерами (TP1 + TP2 + TP3) + опциональный Telegram-сигнал-сендер ВКЛЮЧЁН (БЕСПЛАТНО) (ПОЛНОЦЕННАЯ ТОРГОВАЯ И СИГНАЛЬНАЯ СИСТЕМА) Gold Slayer EA Этот индикатор включает в себя продвинутую стратегию, торговую систему с настраиваемым управлением ордерами и систему mean reversion, которая сочетает расширения Envelope и поддерживается несколькими интеллектуальными фильтрами подтверждения, такими как RSI, для поиска высоковероятных точек разворота с сигн
Zoryk Gold
Reda El Koutbane
4.78 (18)
Скидка заканчивается через 24 часа — следующая цена $ 69 ZORYK — продвинутая сигнальная система для XAUUSD в MetaTrader 5 Вам знакомо это чувство. Вы долго анализируете золото. Ждёте подходящего момента для входа. Наконец открываете сделку — и цена сразу начинает двигаться против вас. Вы закрываете позицию слишком рано, передвигаете Stop Loss или сомневаетесь всего несколько секунд. После этого рынок достигает именно той цели, которую вы ожидали изначально, но уже без вас. Проблема не всегда за
ULTRA - это технический индикатор, который который работает по принципу “Все включено” - самостоятельно анализирует рынок, дает торговые сигналы, показывает уровни для установки стоп лосс, а также подсказывает когда нужно закрывать сделки, чтобы получить профит или минимизировать убыток. То есть, не важно, что ты не умеешь анализировать рынок, определять уровни - где поставить SL или плохо совладаешь с мани-менеджментом. ULTRA все это сделает вместо тебя! БОНУС ДЛЯ ПОКУПАТЕЛЯ : После покупки ULT
Получите своё торговое преимущество в поле зрения! M5 Sniper — это новый индикатор от MeanFX. Он сочетает точные торговые сигналы с адаптивными уровнями TP/SL — в результате создавая лучшие возможные статистические сделки! Цена увеличивается каждые 5 покупок, следующая цена — 69$ Напишите мне после покупки, чтобы получить советы/руководство и бонусного EA Что выделяет его среди других? Проверенная статистическая эффективность на Gold XAUUSD ( работает практически на каждом активе , с акцентом н
В 2019 году я показал всему миру, на что способен этот индикатор. Я торговал по его сигналам вручную, на реальном счёте, в открытую — счёт был замониторен на Myfxbook, и я подробно освещал свой эксперимент в Facebook. Итог: 10 000 долларов за четыре месяца превратились в 941 411. Риск был сознательно экстремальным — просадка доходила до 54%, ведь в нашей профессии прибыль и риск всегда идут рука об руку. Скрин с Myfxbook — первая картинка в галерее. Похоже, вас можно поздравить: ваши поиски окон
SuperScalp Pro
Van Minh Nguyen
4.54 (37)
SuperScalp Pro - Professional Multi-Layer Confluence Scalping System SuperScalp Pro — это продвинутый индикатор для скальпинга, который расширяет возможности классического Supertrend с помощью нескольких интеллектуальных фильтров подтверждения. Он помогает выявлять торговые возможности Buy/Sell с более высокой вероятностью успеха и значительно сокращать количество ложных сигналов. Чёткие стрелки Buy и Sell отображаются непосредственно на графике вместе с автоматически рассчитываемыми в реальном
Gann Made Easy   - это профессиональная, но при этом очень простая в применении Форекс система, основанная на лучших принципах торговли по методам господина У.Д. Ганна. Индикатор дает точные BUY/SELL сигналы, включающие в себя уровни Stop Loss и Take Profit. ПОЖАЛУЙСТА, СВЯЖИТЕСЬ СО МНОЙ ПОСЛЕ ПОКУПКИ, ЧТОБЫ ПОЛУЧИТЬ ТОРГОВЫЕ ИНСТРУКЦИИ И ОТЛИЧНЫЕ ДОПОЛНИТЕЛЬНЫЕ ИНДИКАТОРЫ БЕСПЛАТНО! Вероятно вы уже не раз слышали о торговли по методам Ганна. Как правило теория Ганна отпугивает от себя не только
SMC Intraday Formula
VividMind Digital Solutions
5 (26)
Давайте сначала будем честны. Ни один индикатор сам по себе не сделает вас прибыльным. Если кто-то говорит вам обратное — он продаёт вам мечту. Любой индикатор, который показывает идеальные стрелки покупки/продажи, можно сделать безупречным — просто увеличьте нужный участок истории и сделайте скриншот успешных сделок. Мы так делать не будем. SMC Intraday Formula — это инструмент. Он считывает структуру рынка за вас, определяет зоны с наивысшей вероятностью движения цены и точно показывает, как
M1 SNIPER   — это простая в использовании торговая система. Это стрелочный индикатор, разработанный для тайм фрейма M1. Индикатор можно использовать как отдельную систему для скальпинга на тайм фрейме M1, а также как часть вашей существующей торговой системы. Хотя эта торговая система была разработана специально для торговли на M1, ее можно использовать и с другими тайм фреймами. Первоначально я разработал этот метод для торговли XAUUSD и BTCUSD. Но я считаю этот метод полезным и для торговли на
GoldenX Entry MT5
VividMind Digital Solutions
5 (17)
GoldenX Entry — это индикатор для MT5 с адаптивным алгоритмом Smart Entry Trend, системой оценки сигналов, детектором рыночных режимов и фильтром волатильности. Каждый сигнал включает рассчитанный уровень входа, три уровня Take-Profit (TP1, TP2, TP3) и уровень Stop-Loss. Он построен на нескольких аналитических слоях, предназначенных для адаптации к различным рыночным условиям, объединяя многоуровневую аналитическую систему со встроенным оптимизатором и системой статистического отслеживания. Инди
Gold Entry Sniper – Профессиональная Мульти-Таймфрейм ATR Панель для Скальпинга и Свинг-Трейдинга на Золоте Gold Entry Sniper — это передовой индикатор для MetaTrader 5, разработанный для точных сигналов на покупку/продажу по XAUUSD и другим инструментам. Основан на логике ATR Trailing Stop и мульти-таймфрейм анализе , этот инструмент идеально подходит как для скальперов, так и для среднесрочных трейдеров, обеспечивая чёткие точки входа с высокой вероятностью . Основные возможности и преимуществ
Gold Trend Coach MT5
Cristhian Alexander Gaibor Cuasquer
5 (4)
Gold Trend Coach — трендовый индикатор по золоту (XAUUSD) для MetaTrader 5 с сигналами на покупку и продажу, стоп-лоссом и тремя тейк-профитами, подтверждёнными на закрытии свечи (без перерисовки), коучем, который ведёт вас от входа до TP3, мультитаймфреймовой панелью и оповещениями на телефон и в Telegram. Создан для скальпинга на M1 и M5 и интрадея на M15 в лондонскую и нью-йоркскую сессии. БОНУС: БЕСПЛАТНЫЙ советник для автоторговли по Gold Trend Coach. Напишите мне после покупки, и я отправл
Следующее обновление — версия 2.52 уже скоро! [НОВОЕ] Приготовьтесь к 4 новым важным функциям, призванным улучшить ваш анализ рынка и торговый процесс. Мы выводим анализ рынка на новый уровень с помощью 4 новых функций, разработанных с учётом ваших потребностей в трейдинге. Представляем: 1. TRADE OVERVIEW DASHBOARD 2. CONFLUENCE AT ZONE 3. STRONG & WEAK HIGH/LOW 4. OTE 1. TRADE OVERVIEW DASHBOARD Панель, которая помогает легче понимать общую картину рынка, предоставляя рекомендации для поддержк
Atomic Analyst — MetaTrader 5 После покупки напишите мне на MQL5, чтобы БЕСПЛАТНО получить Smart Universal Expert Advisor, а также доступ к онлайн-курсу, руководство в формате PDF и доступ к закрытой группе. Atomic Analyst объединяет анализ ценового движения, направление тренда, сигналы входа и выхода, уровни Stop Loss и несколько уровней Take Profit прямо на графике. УВИДЬТЕ СИГНАЛ. ОЦЕНИТЕ ТОРГОВУЮ СИТУАЦИЮ. Atomic Analyst представляет результаты анализа в понятном визуальном виде: • Стрелки п
Adaptive Price Action Engine Купи индикатор — получи советник (EA) к нему бесплатно Самооптимизирующийся мульти-таймфреймовый анализ тренда и свечных моделей Рынок постоянно меняется — и не каждая модель Price Action имеет одинаковую ценность в разных рыночных режимах. Adaptive Price Action Engine создан для адаптации к изменяющимся рыночным условиям, объединяя трендовую структуру, мульти-таймфреймовый анализ, свечные модели и статистическую оптимизацию в единой аналитической системе. Два адапти
ARICoin is a powerful trading companion designed to generate high-probability entry signals with dynamic TP/SL/DP levels based on volatility. Built-in performance tracking shows win/loss stats, PP1/PP2 hits, and success rates all updated live. Key Features: Buy/Sell signals with adaptive volatility bands Real-time TP/SL/DP levels based on ATR Built-in MA Filter with optional ATR/StdDev volatility Performance stats panel (Success, Profit/Loss, PP1/PP2) Alerts via popup, sound, push, or email Cust
Boba Analysis Suite
Trade Ready Solutions LLC
5 (2)
Boba Analysis Suite Boba Analysis Suite — аналитический индикатор для MetaTrader 5. Он объединяет структуру рынка, значимые ценовые зоны и общий рыночный контекст в одном представлении на графике. Индикатор разработан на основе практического опыта трейдера и наставника по трейдингу. Он помогает выстроить последовательный процесс анализа: оценивать направление рынка, определять важные уровни и рассматривать несколько таймфреймов в совокупности. Анализ с учётом контекста Значение отдельных сигнало
ScalpPoint is a powerful trading companion designed to generate high-probability entry signals with dynamic TP/SL/DP levels based on volatility. Built-in performance tracking shows win/loss stats, PP1/PP2 hits, and success rates — all updated live. Key Features: Buy/Sell signals with adaptive volatility bands Real-time TP/SL/DP levels based on ATR Built-in MA Filter with optional ATR/StdDev volatility Performance stats panel (Success, Profit/Loss, PP1/PP2) Alerts via popup, sound, push, or emai
Auto Optimized SpeedAngle — это система векторизации импульса институционального уровня, которая исключает подгонку под исторические данные (curve-fitting) за счет непрерывной форвард-оптимизации (Walk-Forward Optimization, WFO). Вместо того чтобы полагаться на статические входные параметры, которые теряют эффективность при смене рыночных режимов, индикатор динамически перекалибрует свои настройки, используя валидацию на вневыборочных данных (Out-of-Sample, OOS). Это гарантирует, что отображаемы
Zain Gold Scalping
Ahmed Gamal Abdel Nasser Mohamed
Комплексный инструмент анализа Price Action, основанный на двух независимых алгоритмах входа (каждый из которых подтверждается границей волатильности) и дополненный набором из девяти настраиваемых фильтров, позволяющих гибко регулировать степень консервативности или агрессивности торговых сигналов. Базовая стратегия Два независимых сценария входа, каждый из которых срабатывает только при выходе цены за пределы динамической границы волатильности. Это обеспечивает два различных способа выявления
Индикатор Tokyo Indicator обеспечивает наглядное представление о направлении тренда, потенциальных торговых сигналах и текущей рыночной ситуации. Его ступенчатая линия тренда с цветовой индикацией позволяет различать «бычьи» фазы (выделены синим цветом) и «медвежьи» фазы (выделены пурпурным цветом). Соответствующие стрелки указывают на возможные точки входа в рынок (покупку или продажу) при смене тренда. Встроенная информационная панель объединяет данные о текущем сигнале, рыночном настроении,
Azimuth Pro
Ottaviano De Cicco
5 (7)
Azimuth Pro V2: Синтетический фрактальный структурный анализ и подтверждённые входы для MT5 Обзор Azimuth Pro — многоуровневый индикатор свинговой структуры от Merkava Labs . Четыре вложенных уровня свингов, привязанный к свингам VWAP, определение ABC-паттернов, трёхтаймфреймная структурная фильтрация и подтверждённые входы на закрытой свече — один график, один рабочий процесс от микро-свингов до макро-циклов. Это не слепой сигнальный продукт. Это рабочий процесс, основанный на структуре, для т
Superhero
Ihor Otkydach
5 (3)
SUPERHERO индикатор - это мультивалютная торговая система, которая создана по принципу "Все включено". Индикатор самостоятельно анализирует рынок и дает сигналы когда открывать и когда закрывать сделки. Используются ордера Стоп Лосс и Тейк профит. Соотношение R:R = 1:1 Эта система может присылать на смартфон PUSH-уведомления, так что вы сможете делать сделки "на ходу" без привязки к ПК. Отлично подходит для Проп Фирм трейдинга. БОНУС ДЛЯ КАЖДОГО ПОКУПАТЕЛЯ: Каждый покупатель этого индикатора пол
Мультивалютный индикатор силы и импульса MT5 Dynamic Forex28 Navigator — это развитие наших давних популярных индикаторов, объединяющее силу трёх в одном: Advanced Currency Strength28 Indicator (700 отзывов) Advanced Currency IMPULSE with ALERT (530 отзывов) CS28 Combo Signals (недавний бонус) Оба индикатора-предшественника вместе получили более 1,200 отзывов на MQL5 Market и с 2016 года являются неотъемлемой частью сообщества MT4. Dynamic Forex28 Navigator MT5 переносит ту же проверенную логику
Volatility Master for MetaTrader is a real-time dashboard tool that scans up to  50 symbols  to identify high-volatility , trending markets instantly. With bullish/bearish signals, customizable alerts, and a user-friendly interface, it helps you avoid range-bound conditions and focus on high-probability trades. Clarity leads to confidence. Trade confidently and protect your capital effectively with this powerful dashboard. We don't offer free or bonus indicators in exchange of reviews from you.
Apex Patterns PRO Купите индикатор — получите Expert Advisor на его основе БЕСПЛАТНО. Самооптимизирующаяся система анализа графических паттернов и пробоев Традиционные сканеры паттернов полагаются на фиксированные входные параметры, что часто приводит к снижению их эффективности при изменении рыночной волатильности и структуры. Apex Patterns PRO разработан для адаптации к меняющимся рыночным условиям, объединяя распознавание структурных графических паттернов, фильтрацию по моментуму и статистич
Neuro Poseidon - новый индикатор от Дарьи Резуевой. Он сочетает точные торговые сигналы с адаптивными уровнями TP/SL , в результате создавая максимально выгодные сделки! TO SWITCH TO   ENG   PLEASE CHOOSE IT IN THE UPPER-RIGHT CORNER OF THE WEBSITE Напишите мне и получите  Neuro Poseidon Assistant  в подарок для автоматизации вашей торговли! Что отличает его от других индикаторов? 1. Доказанная прибыльность на всех активах и таймфреймах 2. На графике присутствуют только подтвержденные сигналы н
Break and Retest Hunter is a powerful MetaTrader 5 indicator designed to automatically identify support and resistance levels, breakout structures, and potential retest opportunities in real time. Bonus Indicator: After purchasing Break and Retest Hunter , contact me to receive Trade Indicator Assistant EA completely free as a bonus utility. $65 for the next 10 copies . Next price is $120.  Combining adaptive market analysis, clear BUY/SELL signals, Fibonacci-based profit targets, and a premiu
Другие продукты этого автора
AlgoTrade Margin Call Levels shows the prices where your broker's margin call and stop out would start for open positions on the active chart symbol. It draws horizontal lines at each level and shows the distance to them. What it shows The current margin level, used margin and free margin. The margin call price and stop out price for the symbol, based on the account settings from your broker. The distance to each level in points, percentage and average daily ranges. The potential loss before rea
FREE
AlgoTrade Gold Range Meter shows how far the price has moved today compared with an average day. It is made for XAUUSD and works on any symbol. What it shows The average daily range of the last 20 closed days (high minus low; weekend bars and flat bars are left out). Today's range so far and the percentage of an average day it has reached, with a bar marked at 100% and 150%. Two dotted lines: today's low plus the average range, and today's high minus the average range. Today becomes an average-s
FREE
AlgoTrade Position Size Panel works out the lot size for the risk you choose. Drag three lines on the chart (entry, stop loss and take profit) and the panel shows the result at once. What it shows Lot size for a risk in percent of balance, percent of equity or a fixed amount in the account currency, rounded down to the broker lot step so the loss stays within your risk. Loss at the stop and profit at the target, in money and in percent of the balance. Reward to risk, margin needed and free margi
FREE
AlgoTrade News on Chart displays the MetaTrader 5 economic calendar directly on your chart. It draws vertical lines for events affecting the currencies of the chart symbol and lists upcoming events on a compact card, including forecast, previous, and actual values. What it shows A dotted vertical line at each event: red for high importance, orange for medium importance, and grey for low importance. Hover over a line to view the event name, time, and values. The next high-importance event with a
FREE
AlgoTrade News Impact Statistics shows how your closed trades performed around economic news. It runs on any chart and reads account data only. What it shows Trades opened near news: an event of the symbol's currencies within 30 minutes before or after entry (1 to 240 minutes). Trades held through news: an event occurring later while the trade was open. Trades away from news. For each group: the number of trades, the share of winning trades, the net result, and the average trade. The net result
FREE
AlgoTrade Basket Manager treats your open trades as one basket. It shows the net result of the basket and closes all of its trades at the net profit or the net loss you choose. It never opens a trade. What it shows The net result of the basket: floating profit, swaps and the commission paid when the trades were opened. The number of buy trades and sell trades and their lots. The break-even price of the trades on the chart symbol, drawn as a line on the chart. The prices where the basket would cl
FREE
AlgoTrade Round Number Levels draws round price levels around the price and shows on a card the levels just above and below, the distance to each, and how many times the price visited each one today. It reads data only. What it does Major levels: 100 pips on forex pairs, or a step of about 1% of the price on other symbols (for example 50 on gold). You can also set the step yourself. Minor levels: 50 pips on forex, or a smaller step such as 10 on gold. Quarter levels (25 and 75 pips) can be turne
FREE
AlgoTrade Currency Strength Meter shows the strength of each of the 8 major currencies (USD, EUR, GBP, JPY, CHF, CAD, AUD, NZD) against the other 7, ranked on a card with the strongest and the weakest. It reads data only. What it does Strength is the average move of each currency against the other 7 across the 28 pairs: since the open of today's, this week's, or this month's candle in server time, or over the last hours (4 by default). Displays a ranked list with a bar for each currency, stronge
FREE
AlgoTrade Previous Day High Low draws the previous day's high, low, and close, today's open, and the previous week's and month's high and low on the chart, displaying the price position relative to these levels on a card. It reads data only. What it does Lines for each level from the start of the current day, week, or month, showing the level's name and price. Colors adapt to dark or light charts or can be set in the inputs. A card showing the price position relative to yesterday's range (above
FREE
AlgoTrade Pivot Points draws the daily, weekly, or monthly pivot point, resistance, and support levels on the chart and shows the current price position on a card. It reads data only. What it does Five formulas: Classic, Fibonacci, Camarilla, Woodie and DeMark, based on the previous day's, week's or month's high, low and close (DeMark also uses the open). Levels from R1 and S1 up to R3 and S3, or up to R4 and S4 with Camarilla. Lines for the current period from its start, showing each level's na
FREE
AlgoTrade Line Alerts monitors the lines drawn on the chart and alerts you when the price crosses a line or when a vertical line's time is reached. A card lists each line with its level, distance from the price, and alert status. It reads data only and does not modify your lines. What it does Works with horizontal, trend, and vertical lines. Draw them as usual from Insert > Objects > Lines; each new line is watched immediately. Alerts when the chart price crosses or touches a horizontal or trend
FREE
AlgoTrade Spread and Slippage Monitor displays the chart symbol spread and fill slippage on the chart. It runs on any chart and reads account data only. What it shows Current spread in points, along with the average and widest spread since the indicator started, updated on every new tick. Today's average and widest spread based on 1-minute bars. Hourly spread over the last 7 days (1 to 60 days), showing the widest hour, narrowest hour, and usual spread for the current hour. Slippage in points: t
FREE
AlgoTrade Trading Sessions draws the Sydney, Tokyo, London and New York sessions as boxes on the chart from the high to the low of each session, and shows on a card which sessions are open, when the next one opens, and each session's range against its average. It reads data only. What it does Boxes for the sessions of recent days (5 by default) on charts up to H4, with the session name and its range in points. Colors fit a dark or a light chart, or can be set in the inputs. A card with each sess
FREE
AlgoTrade Swap and Commission Tracker shows what your trades paid in commission, swap and fees, and what the next rollover may cost your open positions. It runs on any chart and reads account data only. What it shows Four periods with one click: today (from 00:00 server time), the last 7 days, the last 30 days and all history. For the period: the price result of closed trades, commission, swap, fees and charges, the net result, the number of closing deals and lots, and the cost per closed lot. T
FREE
AlgoTrade Loss Streak Guard helps you take a break after losing trades. It monitors your closed trades and pauses trading according to your rules. A trade opened during a pause is closed immediately or only reported, depending on your settings. The rules A wait after every losing trade (5 minutes by default). A longer pause after a specified number of losing trades in a row (3 losses and 1 hour by default). Each subsequent loss restarts the pause until a winning trade occurs. An optional stop fo
FREE
AlgoTrade Prop Guard watches the loss limits of your prop firm account in real time and shows them in one table: the limit, where you are now, a bar and the result. It warns you near a limit (70% by default). At the level you choose (90% by default) it closes all positions, deletes pending orders and keeps trading paused. What it checks Daily loss: from the balance at the daily reset, or from the higher of balance and equity. The limit is a % of the account size or of the start-of-day value. Max
AlgoTrade Drawdown Recovery Planner shows how far your account is below its high-water mark and the gain needed to recover. It runs on any chart and reads account data only. What it shows The high-water mark: the highest balance in the account history or the highest equity seen while the indicator runs, adjusted for deposits and withdrawals. You can also enter a custom value. Current equity, the drawdown in money and percentage, and the gain needed to return to the mark. A plan based on your inp
FREE
AlgoTrade Trading Hours Heatmap shows how your closed trades performed by the weekday and hour they were opened. It runs on any chart and reads account data only. What it shows A grid of weekdays and hours (broker server time). Saturday and Sunday rows appear when they have trades. Three measures with one click: net result, share of winning trades, and number of trades. All symbols or only the chart symbol, for the last 30 days, 90 days, 1 year or all history. The number of closed trades, the sh
FREE
AlgoTrade Account Statistics displays closed trade statistics on the chart. It runs on any chart and reads account data only. What it shows The net result of closed trades and the gain as a percentage of the starting balance. The number of closed trades, trades per week, the share of winning trades, and the profit factor. The average win, average loss, average trade, best trade, and worst trade. The longest runs of winning and losing trades. The deepest drop in closed-trade results, in money and
FREE
AlgoTrade Trade Journal records your trades automatically without manual typing. It runs on any chart and reads account data only. What it does Writes one row to a CSV file for every trade open, addition, partial close, close, and reversal. Each row includes the time, symbol, side, volume, price, stop loss, take profit, deal result, total trade result on close, magic number, reason (manual, Expert Advisor, stop loss, take profit), and comment. Takes a screenshot of the trade's symbol chart when
FREE
AlgoTrade Multi-Account Monitor shows all your MT5 accounts on one panel. Run it in each MetaTrader 5 terminal on the same computer: every copy shares its own account and shows all of them. It reads account data only. What it does Shows each account's equity and currency, floating result, margin level, today's closed result, and number of open positions. A headline at the top states "All accounts OK" or indicates how many accounts need attention. Warns when the margin level is below your limit,
FREE
AlgoTrade Weekly Trading Review displays a weekly summary of your closed trades directly on the chart, comparing the current or previous week to the preceding one alongside notes on notable patterns. It also saves each week as an HTML report. It reads account data only. What it does Displays the week's net result, number of closed trades, winning share, average win, average loss, profit factor, best day, and worst day, alongside the same metrics for the prior week. Provides notes based on your t
FREE
AlgoTrade Candle Timer displays the time remaining for the current candle next to the price, and on a card showing candles from M1 to monthly, the spread, server time, and when the symbol's market opens or closes. It reads data only. What it does Displays the time remaining for this chart's candle next to the latest candle in your chosen color and size. Shows "closed" when the market is closed. A card displaying the time remaining for M1, M5, M15, M30, H1, H4, daily, weekly, and monthly candles,
FREE
AlgoTrade Correlation Matrix shows how the symbols of your list move together, as a colored matrix on a card, with the symbols that move most with and most against the chart symbol. It reads data only. What it does Up to 10 symbols from a comma separated list (by default EURUSD, GBPUSD, USDJPY, AUDUSD, USDCAD, USDCHF, NZDUSD, XAUUSD). The chart symbol is added when it is not in the list. Finds each symbol at your broker, with the chart symbol's prefix and suffix (for example EURUSD.pc). Tabs for
FREE
Фильтр:
Нет отзывов
Ответ на отзыв