Dynamic Volume Profile MT4

Box Volume Profile

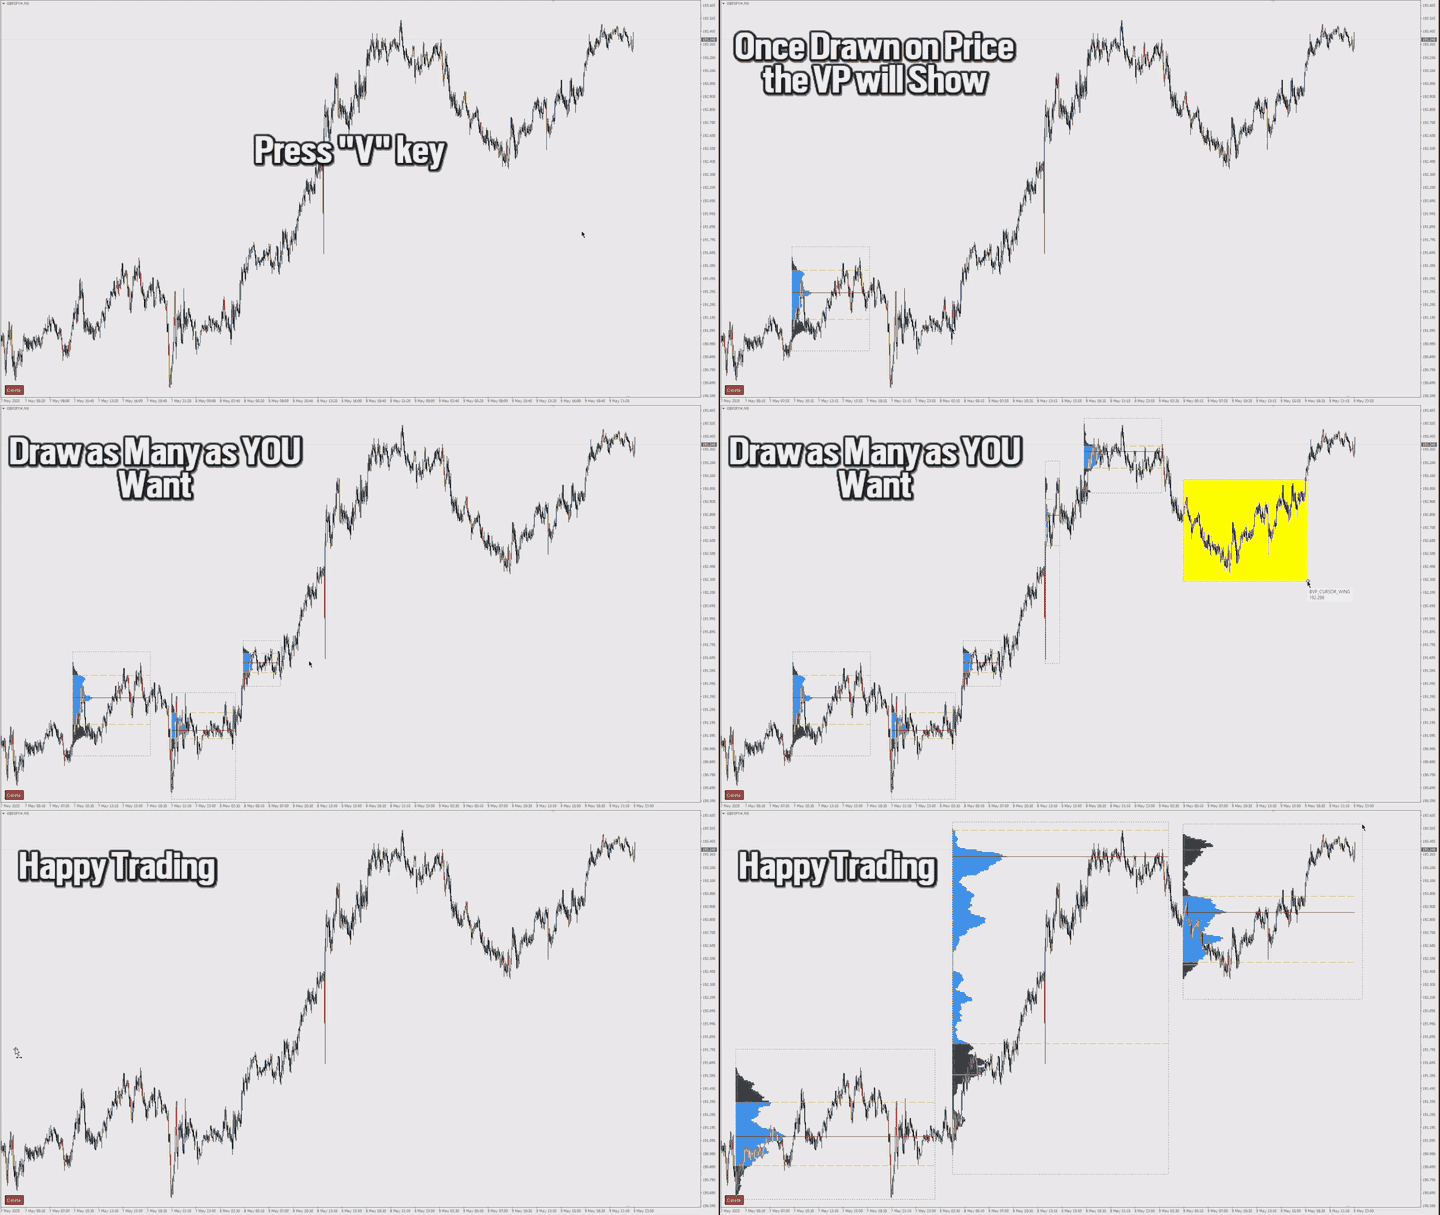
Box Volume Profile draws a volume histogram inside any rectangle you place on the chart. Choose a time window and a price range, and the indicator shows how much volume was traded at each price level inside that zone. It also plots the Point of Control (POC) and the Value Area boundaries (VAH and VAL).

How to use

Press the draw hotkey (the letter V by default) and drag a rectangle anywhere on the chart. The volume profile appears immediately inside the box. Move or resize the box at any time and the profile, POC and Value Area lines update on the fly. New bars that fall inside the box are added to the profile automatically.

What the profile shows

- A volume histogram with rows aligned to a fixed price step, so rows have the same height on every box.
- The POC line marking the price level with the highest traded volume inside the box.
- The Value Area (VAH and VAL) containing the percentage of volume you select, expanded from the POC in both directions.

- Each bar's volume is distributed evenly across its high-to-low range, so the profile follows the actual price action inside the box.

Features

- Place unlimited boxes on one chart, each with its own independent profile.
- Live recalculation when a box is moved, resized, or when new bars arrive.
- A one-click Clear button removes all boxes and their drawings. Boxes deleted by hand are cleaned up automatically, with no leftover objects.

- Works on any symbol and any timeframe.

Settings

Profile calculation:
- Price Step — the price height of one histogram row.
- Ticks Per Row — how many price steps form one row.
- Value Area % — percentage of volume inside the Value Area, 70 percent by default.
Appearance:
- Colors for the profile bars, Value Area bars, POC, VAH and VAL lines, the box and its frame.
Interface:
- Draw Hotkey — the key that starts box placement.
- Profile Width % — maximum histogram width as a percentage of the box width.
- Box Name Prefix — name prefix for placed boxes.

- Show Clear Button — show or hide the Clear button.

Notes

The profile is built from tick volume, which is the volume data MetaTrader 4 provides. On symbols and timeframes with low activity, increase Ticks Per Row to get fewer, wider rows. All settings apply to every box on the chart, and each profile is recalculated from the chart history when the indicator reloads.
Produtos recomendados
Here   our more valuable tools SMC Trend Trading   ,  Easy SMC Trading  ,  Institutional SMC Architect Volume Analysis Tools  ,  Volume flow Profile  ,  Market volume profile  , FVG with Volume  , Liquidity Heatmap Profile  ,  Volume Spread Analysis The Market Profile & Volume Profile Indicator is a powerful technical analysis tool designed to visualize market activity and price distribution over specific timeframes. Unlike standard technical indicators that focus solely on price over time, th
BoxChart MT4
Evgeny Shevtsov
4.4 (5)
The market is unfair if only because 10% of participants manage 90% of funds. An ordinary trader has slim changes to stand against these "vultures". This problem can be solved. You just need to be among these 10%, learn to predict their intentions and move with them. Volume is the only preemptive factor that faultlessly works on any timeframe and symbol. First, the volume appears and is accumulated, and only then the price moves. The price moves from one volume to another. Areas of volume accumu

O indicador cria cotações atuais, que podem ser comparadas com as históricas e, com base nisso, fazer uma previsão do movimento dos preços. O indicador possui um campo de texto para navegação rápida até a data desejada. Opções: Símbolo - seleção do símbolo que o indicador exibirá; SymbolPeriod - seleção do período do qual o indicador coletará dados; IndicatorColor - cor do indicador; HorisontalShift - deslocamento das cotações desenhadas pelo indicador pelo número especificado de barras; I
ZBubbles Delta
Vadim Verkhovtsev
ZBubbles Delta — Professional Volume Indicator for MT4 See volume the way institutions see it. Trade where smart money enters. ZBubbles Delta is an advanced volume analysis indicator for MetaTrader 4, combining statistical anomaly detection, ADX trend filtering, and built-in binary options statistics with Martingale tracking. Unlike standard volume histograms, ZBubbles Delta draws dynamic colored bubbles directly on price action, showing where institutional volume entered and how strong the
Blahtech Supply Demand
Blahtech Limited
4.58 (36)
Was: $299  Now: $99   Supply Demand uses previous price action to identify potential imbalances between buyers and sellers. The key is to identify the better odds zones, not just the untouched ones. Blahtech Supply Demand indicator delivers functionality previously unavailable on any trading platform. This 4-in-1 indicator not only highlights the higher probability zones using a multi-criteria strength engine, but also combines it with multi-timeframe trend analysis, previously confirmed swings
Money Flow Profile MT5 HERE   Here   our more valuable tools SMC Trend Trading   ,  Easy SMC Trading  ,  Institutional SMC Architect Volume Analysis Tools  ,  Volume flow Profile  ,  Market volume profile  , FVG with Volume  , Liquidity Heatmap Profile  ,  Volume Spread Analysis This Master Edition is engineered for clarity and speed, featuring a unique Auto-Theme Sync system that instantly beautifies your chart layout upon loading. Key Features: True Money Flow Calculation: Goes beyond stand
Delta Single Volume
Chantal Sala
3.67 (3)
Volume Delta is a very powerful indicator that reads the supply on the Market. It calculates the Delta from movement of the price and the difference of BUY and SELL Tick volumes. Its special structure allows you to get all timeframe values available on the MT4 platform. A good observation of this instrument can suggest great entry points and possible reversal. We are confident that this tool will help you to improve your trading timing. See also for MT5:  https://www.mql5.com/en/market/product/5
The "MR Volume Profile 4" indicator is a charting tool that displays trading volume at different price levels rather than time intervals. A key concept in volume profile is the point of control (POC)—the price level with the highest volume traded during the session or time range. While tools like VWAP or OBV provide volume trends, the "MR Volume Profile 4" indicator offers granular detail about where the most market activity occurs at specific price levels. This makes it a more precise tool for
Intraday Volume Profile Forex MT4   Intraday Volume Profile  - This is a visualization tool for understanding the high activity zone and low activity zone, as part of the  D1  senior timeframe. The volume profile provides an excellent visual image of supply / demand at each price for the selected timeframe. Introducing  POC  - Point of Control, which indicates the price at which the maximum volume was sold, as well as Value Area - the area where 68% of the instrument's assets are traded. POC  -
Volume Compair
Thiago Pereira Pinho
5 (1)
Indicador Profissional de Delta Cumulativo e Mediana de Volume Acompanhe a pressão real de compra/venda com esta poderosa ferramenta de análise de volume. O Volume Compare Indicator combina o Delta Cumulativo e as Medianas de Volume para ajudar você a identificar a atividade institucional, desequilíbrios e potenciais reversões. Principais Recursos:  Histograma de Delta Cumulativo – Visualiza o volume líquido de compra vs. venda em tempo real.  Medianas de Volume de Compra/Venda – Linhas horizont
Blahtech Market Profile
Blahtech Limited
4.53 (15)
Was: $249  Now: $99   Market Profile defines a number of day types that can help the trader to determine market behaviour. A key feature is the Value Area, representing the range of price action where 70% of trading took place. Understanding the Value Area can give traders valuable insight into market direction and establish the higher odds trade. It is an excellent addition to any system you may be using. Blahtech Limited presents their Market Profile indicator for the MetaTrader community. Ins
Trend Scan Friend
Israr Hussain Shah
Here   our more valuable tools SMC Trend Trading   ,  Easy SMC Trading  ,  Institutional SMC Architect Volume Analysis Tools  ,  Volume flow Profile  ,  Market volume profile  , FVG with Volume  , Liquidity Heatmap Profile  ,  Volume Spread Analysis Trend Identification: Look for the color change. When candles turn Green , look for Buy opportunities. When they turn Red , look for Sell opportunities. Entry: Enter on the break of the trend line or on the pullback to the line. Stop Loss: Use the
Volume Profile Sniper v11. 1 - ferramenta abrangente de análise de mercado Abordagem profissional ao comércio O Volume Profile Sniper v11.1 combina mais de 15 filtros-chave em um único indicador, fornecendo sinais claros com base em uma avaliação abrangente da situação do mercado. Principais recursos Análise do desequilíbrio volumétrico-o algoritmo calcula a proporção de compradores e vendedores em cada vela, sinalizando a predominância de uma das partes (limite ajustável de 50% a 90%). Filtr
Market Profile Heat indicator  — is a classic Market Profile implementation that can show the price density over time, outlining the most important price levels, value area, and control value of a given trading session. This indicator can be attached to timeframes between M1 and D1 and will show the Market Profile for daily, weekly, monthly, or even intraday sessions. Lower timeframes offer higher precision. Higher timeframes are recommended for better visibility. It is also possible to use a fr
Here   our MT5 version more valuable tools SMC Trend Trading   ,  Easy SMC Trading  ,  Institutional SMC Architect Volume Analysis Tools  ,  Volume flow Profile  ,  Market volume profile  , FVG with Volume  , Liquidity Heatmap Profile  ,  Volume Spread Analysis 2. Key Features Dynamic Filtering : The core feature. As soon as the current price crosses a historical liquidity level, that level disappears. This reduces chart clutter and prevents you from trading off "dead" support/resistance. Liqui
Forex Volume MT4
KEENBASE SOFTWARE SOLUTIONS
KT Forex Volume exibe o volume de compra e venda de um par de moedas na forma de um histograma colorido. O volume é composto por transações de compra e venda de um ativo. No mercado Forex: Se o volume de compra for maior que o de venda, o preço do par de moedas tende a subir. Se o volume de venda for maior que o de compra, o preço do par de moedas tende a cair. Recursos Evite operações ruins confirmando-as com dados de volume por tick. Ajuda você a operar na direção dos grandes players do merca
Everyday trading represents a battle of buyers ("Bulls") pushing prices up and sellers ("Bears") pushing prices down. Depending on what party scores off, the day will end with a price that is higher or lower than that of the previous day. Intermediate results, first of all the highest and lowest price, allow to judge about how the battle was developing during the day. It is very important to be able to estimate the Bears Power balance since changes in this balance initially signalize about possi
Um indicador técnico que calcula suas leituras nos volumes de negociação. Na forma de histograma, mostra o acúmulo da força do movimento do instrumento de negociação. Possui sistemas de cálculo independentes para direções de alta e baixa. Funciona em quaisquer instrumentos de negociação e prazos. Pode complementar qualquer sistema de negociação. O indicador não redesenha seus valores, os sinais aparecem na vela atual. É fácil de usar e não carrega o gráfico, não requer cálculos de parâmetros adi
O Volume Profile é uma das ferramentas analíticas mais poderosas usadas por traders profissionais e institucionais. Ao contrário dos indicadores de volume tradicionais, que mostram apenas quando as negociações ocorreram na parte inferior da sua tela, o Volume Profile mostra exatamente em quais níveis de preço essas negociações aconteceram. Isso oferece uma visão de raio-X clara da estrutura do mercado, permitindo que você veja exatamente onde o dinheiro inteligente (smart money) e as instituiçõe
VolumeProfile
Robert Hess
3.8 (5)
Descption: The Volume Profile displays detailed informations of historical trading activities at certain price levels (Market Profile). So you can locate the areas with the best prices in the market and get an advantage about other market participants. Features: Customizable Volume Profile / Market Profile Shows the "fair" Value Area with 70% of all Volume Shows critical low volume zones Shows VPOC, VAL and VAH Points Works on all timeframes Also available for MT5 ( https://www.mql5.com/en/mark
MarketProfile EForex
Veridiana Adorno Kendrick
O Perfil de Mercado Mostra onde o preço passou mais tempo, destacando níveis importantes que podem ser usados na negociação. É uma ferramenta poderosa que se destina a reunir os componentes fundamentais que compõem cada mercado; preço / volume / tempo, e exibir visualmente sua relação em tempo real à medida que o mercado se desenvolve por um período de tempo pré-determinado. Ferramenta muito poderosa!
TITAN AI Volume Profile PRO MT4 is an advanced technical indicator designed for professional market analysis, volume profile distribution, and graphical data visualization in MetaTrader 4. Key Features: - Dynamic Volume Profile calculation based on price action and tick volume. - Automatic High Value Area (VAH), Low Value Area (VAL), and Point of Control (POC) detection. - High Volume Nodes (HVN) and Low Volume Nodes (LVN) highlighting. - Integrated Economic Calendar with news alerts. - Built-
Simply The Best Pro
Szymon Palczynski
5 (1)
This indicator displays the histogram and arrows on chart. When Simple The Best Pro are placed on a chart, they identify the trend.  The color of may be blue or red. The blue color stands for upside moves and the red color stands for downside trends. The indicator offers to set Stop Loss (SL) and  Take Profit (TP)  setting. The default value is ATR. Indicator has automatic optimization. The STB is a unique indicator that shows the tendency (button Bars) of a particular signals. The STB tells us
Here   our more valuable tools SMC Trend Trading   ,  Easy SMC Trading  ,  Institutional SMC Architect Volume Analysis Tools  ,  Volume flow Profile  ,  Market volume profile  , FVG with Volume  , Liquidity Heatmap Profile  ,  Volume Spread Analysis The activity of these professional operators, and more important, their true intentions, are clearly shown on a price chart if the trader knows how to read them .   VSA looks at the interrelationship between three variables on the chart in order
Time Bubble ***Specialized for GBPJPY 1H time frame*** (tested for two years with success rates about 82%) Time Circle's smart algorithm detects the price circles with time . give strong signals at the right time as result of combine the price and time. our team spent months to develop this indicator specially for GBPJPY ..with high success rates about 82% win trades over two years .tested from December 2016 to November 2018. *** in last two years total signals 1012 with 829 Wins and 183 Lo
Indicador Navegador de Grade de Preços O Navegador de Grade de Preços é uma ferramenta de negociação poderosa e intuitiva, projetada para ajudar os traders a identificar dinamicamente os principais níveis de suporte e resistência. Ele fornece indicações visuais claras para potenciais pontos de entrada, pontos de saída e zonas de reversão, tornando-se uma ferramenta essencial para traders de todos os níveis de experiência. Ao calcular e plotar esses níveis dinamicamente, o indicador fornece aos
FREE
Este indicador é baseado na transformada discreta de Hartley. O uso dessa transformação permite aplicar diferentes abordagens ao processar séries temporais financeiras. Uma característica distintiva deste indicador é que suas leituras não se referem a um ponto no gráfico, mas a todos os pontos do período do indicador. Ao processar uma série temporal, o indicador permite selecionar vários elementos da série temporal. A primeira possibilidade de filtragem baseia-se nesta abordagem - todos os comp
Last 50 Pips
Martin Alejandro Bamonte
O indicador Last 50 Pips foi projetado para identificar rapidamente oportunidades de compra e venda com base no comportamento recente dos preços. Ele mede a variação de preço nas últimas velas para destacar em amarelo os momentos em que o preço pode estar mudando de direção. Sinal de compra: Deve abrir uma posição de COMPRA quando o indicador muda de VERMELHO para AMARELO , sugerindo uma mudança de uma tendência de baixa para uma de alta. Por favor, veja as imagens para entender como é simples.
Bollinger Insight is a tick-volume price distribution tool for MT4. It displays a volume profile, point of control, value area, and low-volume regions directly on the main chart, helping users examine where market activity was concentrated within the selected range. Key features: - Builds a Tick Volume Profile across configurable price rows. - Displays the point of control and supports a developing POC mode. - Calculates VAH and VAL with an adjustable value-area ratio. - Detects low-volume no
Market Profile 3
Hussien Abdeltwab Hussien Ryad
3 (2)
Market Profile 3 MetaTrader 4 indicator  — is a classic Market Profile implementation that can show the price density over time, outlining the most important price levels, value area, and control value of a given trading session. This indicator can be attached to timeframes between M1 and D1 and will show the Market Profile for daily, weekly, monthly, or even intraday sessions. Lower timeframes offer higher precision. Higher timeframes are recommended for better visibility. It is also possible t
FREE
Os compradores deste produto também adquirem
SR Liquidity
Oleg Rodin
5 (2)
O SR Liquidity é um indicador de trading projetado para revelar as zonas ocultas onde a liquidez do mercado se concentra e o preço reage com maior intensidade. Essas áreas específicas de liquidez funcionam como níveis poderosos de suporte e resistência, oferecendo um mapa claro de onde é mais provável que o mercado reverta. Em vez de traçar linhas comuns de Suporte e Resistência, o SR Liquidity analisa o comportamento real dos preços para detectar as zonas onde se acumulam pressões de compra e v
Trend SniperX MT4
Sarvarbek Abduvoxobov
5 (5)
Trend Sniper X é um indicador de tendência multitemporal para MetaTrader 5 que ajuda os traders a identificar a direção da tendência e potenciais pontos de reversão com clareza e precisão. Para MT5: https://www.mql5.com/en/market/product/181101 Informação de preço: O preço atual é promocional e está sujeito a alterações à medida que novas atualizações e recursos forem lançados. Canal Code2Profit Domine o Mercado com Análise Multitemporal! Como Maximizar sua Taxa de Acerto com o Trend Sniper X: R
Atomic Analyst
Issam Kassas
5 (14)
Atomic Analyst — MetaTrader 4 Para dúvidas sobre o produto, orientação de configuração ou suporte técnico, envie-me uma mensagem diretamente aqui no MQL5. O indicador transforma cálculos complexos do mercado em sinais visuais simples, candles coloridos, leituras de tendência, níveis de stop loss e várias zonas de take profit que os traders podem entender rapidamente e usar em condições reais de mercado. Principais usos de trading: Scalping e day trade: Desenvolvido para tomada de decisão rápida
Neuro Poseidon MT4
Daria Rezueva
4.74 (46)
Neuro Poseidon is a new indicator by Daria Rezueva. It combines precise trading signals with adaptive TP/SL levels - creating best possible trades as a result! Message me and get  Neuro Poseidon Assistant  as a gift to automize your trading process! What makes it stand out? 1. Proven profitability on all assets and timeframes 2. Only confirmed BUY and SELL signals present on the chart 3. Adaptive TP & SL levels generated by the software for each trade 4. Easy to understand - suitable for all
Smart Trend Trading System é um indicador para MetaTrader 4 que reúne informações de tendência, sinais de entrada e saída e níveis de preço em um único gráfico. Ele combina mais de 10 ferramentas de trading em um único sistema, incluindo detecção de tendência, zonas de reversão, Smart Cloud, lógica de trailing stop, suporte e resistência, coloração de candles, alertas e análise multi-timeframe. O sistema foi desenvolvido para ajudar você a operar diferentes condições de mercado: Mercados em tend
Sinal de tendência GoldRush Arrow O indicador Sinal de tendência GoldRush Arrow fornece uma análise precisa e em tempo real das tendências, adaptada para scalpers de alta velocidade e curto prazo em XAU/USD. Criada especificamente para o intervalo de tempo de 1 minuto, esta ferramenta exibe setas direcionais para pontos de entrada claros, permitindo que os scalpers naveguem em condições de mercado voláteis com confiança. O indicador consiste em setas de alerta PRIMÁRIAS e SECUNDÁRIAS. Os sin
Miraculous Indicator Binary & Forex v3 StrategySafe Miraculous Indicator Binary & Forex v3 StrategySafe é um indicador profissional criado para traders que desejam sinais claros, confirmações avançadas e uma forma estruturada de operar nos mercados Binary e Forex. A versão v3 traz MIR Dashboard, Miraculous Confirmation Dashboard, GANN Law, níveis Square of 9, ângulos GANN e um modo Forex mais completo para analisar o mercado com mais precisão. Principais recursos Modo Binary e modo Forex em um ú
O sistema PRO Renko é um sistema de negociação altamente preciso especialmente concebido para a negociação de gráficos RENKO. Trata-se de um sistema universal que pode ser aplicado a vários instrumentos de negociação. O sistema neutraliza eficazmente o chamado ruído de mercado, dando-lhe acesso a sinais de inversão precisos. O indicador é muito fácil de usar e tem apenas um parâmetro responsável pela geração de sinal. Você pode facilmente adaptar a ferramenta a qualquer instrumento de negocia
Currency Strength Wizard é um indicador muito poderoso que fornece uma solução completa para uma negociação bem-sucedida. O indicador calcula o poder deste ou daquele par forex usando os dados de todas as moedas em vários intervalos de tempo. Esses dados são representados em uma forma de índice de moeda fácil de usar e linhas de energia de moeda que você pode usar para ver o poder desta ou daquela moeda. Tudo o que você precisa é anexar o indicador ao gráfico que deseja negociar e o indicador mo
Elliott Wave Trend was designed for the scientific wave counting. This tool focuses to get rid of the vagueness of the classic Elliott Wave Counting using the guideline from the template and pattern approach. In doing so, firstly Elliott Wave Trend offers the template for your wave counting. Secondly, it offers Wave Structural Score to assist to identify accurate wave formation. It offers both impulse wave Structural Score and corrective wave Structure Score. Structural Score is the rating to sh
Gann Made Easy
Oleg Rodin
4.84 (172)
Gann Made Easy é um sistema de negociação Forex profissional e fácil de usar, baseado nos melhores princípios de negociação usando a teoria do sr. W. D. Gann. O indicador fornece sinais precisos de COMPRA e VENDA, incluindo níveis de Stop Loss e Take Profit. Você pode negociar mesmo em movimento usando notificações PUSH. Entre em contato comigo após a compra para receber instruções de negociação e ótimos indicadores extras gratuitamente! Provavelmente você já ouviu muitas vezes sobre os métodos
Trend Catcher ind
Ramil Minniakhmetov
5 (11)
INDICADOR TREND CATCHER O Indicador Trend Catcher analisa os movimentos de preços do mercado, utilizando uma combinação de indicadores de análise de tendências adaptativos, proprietários e personalizados pelo autor. Identifica a verdadeira direção do mercado, filtrando o ruído de curto prazo e focando a força do momentum subjacente, a expansão da volatilidade e o comportamento da estrutura de preços. Utiliza também uma combinação de indicadores personalizados de suavização e filtragem de tendê
M1 Sniper
Oleg Rodin
4.97 (30)
O M1 SNIPER é um sistema indicador de negociação fácil de usar. É um indicador de seta projetado para o período M1. O indicador pode ser usado como um sistema independente para scalping no período M1 e pode ser usado como parte do seu sistema de negociação existente. Embora este sistema de negociação tenha sido projetado especificamente para negociação no M1, ele também pode ser usado em outros períodos. Originalmente, desenvolvi este método para negociar XAUUSD e BTCUSD. Mas considero-o útil ta
ACTUALMENTE COM 40% DE DESCONTO A melhor solução para qualquer novato ou comerciante especializado! Este Indicador é uma ferramenta comercial única, de alta qualidade e acessível, porque incorporámos uma série de características proprietárias e uma nova fórmula. Com apenas UM gráfico, pode ler a força da moeda para 28 pares de Forex! Imagine como a sua negociação irá melhorar porque é capaz de apontar o ponto exacto do gatilho de uma nova tendência ou oportunidade de escalada? Manual do util
Fibonacci Trend Marker   — is a trend indicator that analyzes the behavior of the current candle relative to the High-Low (HL) range of previous candles using Fibonacci retracement levels. It visually tracks trend strength, signaling potential weakening or reversal through a change in candle color. Features: Designed for trend-focused traders, it helps quickly identify trend changes based on Fibonacci levels. Effective on any timeframe with sufficient market volatility, when a sequence of 3–5 c
Supply and Demand Dashboard PRO
Bernhard Schweigert
4.81 (21)
Actualmente 30% OFF ! Este painel é uma peça de software muito poderosa que trabalha em múltiplos símbolos e até 9 prazos. Baseia-se no nosso principal indicador (Melhores críticas: Advanced Supply Demand ).   O tablier dá uma óptima visão geral. Mostra:   Valores filtrados da Oferta e da Procura, incluindo a classificação da força da zona, Distâncias de/para as zonas e dentro das zonas, Destaca as zonas aninhadas, Dá 4 tipos de alertas para os símbolos escolhidos em todos os (9) períodos de
AW Prime Oscillator
AW Trading Software Limited
5 (1)
Uma combinação de dois osciladores. O primeiro exibe os pontos de entrada, o segundo mostra a tendência atual. O indicador pode exibir sinais do oscilador por meio de setas em dois modos, todos os sinais do oscilador rápido ou sinais apenas na direção da tendência atual. Possui painel multi-timeframe e três tipos de notificações de sinal. Benefícios: Adequado para negociação diurna e de scalping Filtragem de tendências Configuração simples e sensível Painel multiperíodo Adequado para integração
Currency Pulse — painel de força das moedas para MetaTrader 4 Para que serve O Currency Pulse mostra, num único painel compacto no gráfico, quais moedas estão fortes e quais estão fracas neste momento, em vários tempos gráficos ao mesmo tempo. Com base nesse ranking, o indicador aponta os pares com a maior divergência entre moedas: comprar a forte e vender a fraca. O indicador não depende do símbolo do gráfico em que é colocado. MT5 -version:  https://www.mql5.com/en/market/product/200977 Como
M1 Arrow
Oleg Rodin
4.81 (21)
O M1 Arrow é um indicador baseado nos princípios naturais de negociação do mercado, incluindo análise de volatilidade e volume. O indicador pode ser usado em qualquer período gráfico e par de moedas. Um parâmetro fácil de usar permite adaptar os sinais a qualquer par de moedas e período gráfico que você desejar operar. Além do algoritmo principal, baseado em sinais de compra e venda, o indicador também possui diversas estratégias extras integradas que podem ser selecionadas nos parâmetros de ent
Este indicador reconhece mais de 30 padrões de candlestick japoneses e os destaca maravilhosamente no gráfico. É simplesmente um daqueles indicadores que os operadores de ação de preços não podem viver sem. Melhore sua análise técnica da noite para o dia Detectar padrões de velas japonesas facilmente Negocie padrões de reversão confiáveis e universais Entre nas tendências estabelecidas com segurança usando padrões de continuação O indicador não repinta e implementa alertas O indicador implement
Quantum Naked SMC Prime is a streamlined Smart Money Concepts indicator designed for traders who prefer a clean chart, structured market analysis and clear visual trade setups without unnecessary complexity. The indicator combines market structure, liquidity behavior, institutional zones and confirmation logic into a compact analytical framework. Instead of flooding the chart with technical indicators, Quantum Naked SMC Prime focuses on the core elements of price action and Smart Money Concepts
DayTrader PRO MT4
Davit Beridze
4.6 (10)
DayTrader PRO MT5:  https://www.mql5.com/en/market/product/186222 O DayTrader PRO é um indicador de trading avançado que combina o Filtro de Laguerre de John Ehlers com um potente motor de otimização automática. Em vez de utilizar parâmetros fixos, o indicador procura automaticamente as melhores definições com base nas condições recentes do mercado, ajudando-o a adaptar-se à volatilidade variável sem necessidade de ajustes manuais constantes. O indicador gera sinais claros de COMPRA (BUY) e VEND
Quantum Trend Sniper MT4
Ian Andrew Nicholson
5 (1)
Quantum Trend Sniper PRO for MetaTrader 4 Quantum Trend Sniper PRO is a professional-grade MT4 indicator built for traders who want selective entries, clear trade structure, and live on-chart decision support . This is not a basic buy/sell arrow tool. It is a complete trading workflow that helps you identify higher-quality setups, project the full trade structure, monitor progression through multiple profit targets, and review trade behavior directly on the chart. Designed for traders who value
Scalper Inside PRO
Alexey Minkov
4.74 (69)
Scalper Inside PRO helps you read the intraday trend and plan a trade before you enter the market. It is built around three exclusive strategies for a sharper read of the market. The moment a signal appears, the indicator evaluates market direction and calculates the key levels, so you see the potential entry, the expected stop-loss and several profit-taking levels in advance. Detailed performance statistics show how different instruments and strategies performed in history and help you pick ass
The Extreme point indicator helps in determining the probable price reversal points on the chart. The indicator facilitates the search for points to enter the market with greater accuracy. The indicator displays certain impulses, after which there is a high probability of the price continuing its movement in the same direction. The indicator can be used in conjunction with other indicators for a more accurate detection of the position entry points. The indicator can also be used independently. F
JSL Orderflow Footprint turns every candle into a price ladder that shows how much volume traded on the bid and on the ask at each price level. It highlights diagonal imbalances, stacked imbalance zones, absorption at candle extremes, cumulative delta (CVD), delta divergence and the daily session volume profile, then combines five of these order-flow conditions into a 0–100 confluence score. A signal is only issued on bar close when the score is high, clearly one-sided and confirmed by the candl
O Top Bottom Tracker é um indicador baseado em algoritmos sofisticados que analisa a tendência do mercado e pode detetar os altos e baixos da tendência / Versão MT5 . O preço aumentará progressivamente até atingir 500$. Próximo preço --> $99 Características Sem repintura Este indicador não altera os seus valores quando chegam novos dados Pares de negociação Todos os pares de forex Timeframe   Todos os timeframes Parâmetros ==== Configuração do indicador ==== Parâmetro de configuração
True Choppiness Direction determines if the market is choppy (trading sideways) or if it is trending, as well as the trend direction and strength (green=up, red=down, grey=no trend) . The underlying algorithm is designed to detect trend movements even in the presence of noisy market data, please see screenshots. Trend strength is indicated by taller or shorter red/green fill. Choppiness index is range-bound between -50 (very trendy) and +50 (very choppy). This is a custom algorithm designed by u
PTS Precision Index Oscillator V2
PrecisionTradingSystems
5 (1)
O Oscilador de Índice de Precisão (Pi-Osc) de Roger Medcalf da Precision Trading Systems A Versão 2 foi cuidadosamente reconfigurada para carregar rapidamente em seu gráfico, e algumas outras melhorias técnicas foram incorporadas para aprimorar a experiência. O Pi-Osc foi criado para fornecer sinais precisos de temporização de negociações projetados para encontrar pontos de exaustão extremos, os pontos para os quais os mercados são forçados a ir apenas para tirar as ordens de todos. Este pro
KURAMA GOLD SIGNAL PRO (MT4) — Filtro de 7 camadas · TP/SL automático · Pontuação de qualidade · Salvamento do histórico de sinais | Sistema completo de trading para XAUUSD Sem repintura em tempo real. No instante em que um sinal aparece, a seta, a entrada, o TP e o SL ficam travados no lugar e nunca mais se movem. O que você opera é esse sinal em tempo real. E na v7.20, cada sinal realmente enviado é salvo automaticamente e restaurado com exatidão após reiniciar. BÔNUS PARA
Mais do autor
Volume Bubbles version MT5
Cesar Sebastian Rosales Ibarra
Volume Bubbles  See the volume outliers and divergence bars — before they reverse on you. Volume Bubbles — on-chart volume spike detector with divergence arrows. Most volume tools dump a histogram at the bottom of your screen and leave you to guess which bars actually mattered. Volume Bubbles puts the answer directly on the chart: a bubble on the bar, sized by how unusual the volume was, colored by what that volume means, with an arrow when the volume story disagrees with the price story. Wha
Market Profile TPO is a multi-period Time-Price-Opportunity (TPO) indicator for MetaTrader 4. It builds price profiles from time data and displays the Point of Control (POC), Value Area (VAH and VAL), Initial Balance (IB), Single Prints, a volume overlay and profile merging on the chart. It is written entirely in MQL4 and does not use DLLs or external files. What the indicator draws - TPO profile: each price level is tagged with the time slice in which it traded. Displayed as letters or filled b
Anchored VWAP plus Bands MT4
Cesar Sebastian Rosales Ibarra
Anchored VWAP — 5 draggable anchors with deviation bands  Volume-weighted average price anchored to user-defined points on the chart. Drop an anchor where you want the VWAP to start — earnings, swing high/low, session open, any event — and the indicator recalculates from that bar forward. What it does: Up to 5 independent anchors, each with its own VWAP line and color, running simultaneously on the same chart 2 configurable σ deviation bands (default ±1σ and ±2σ) attachable to any single anchor
Daily VWAP plus Bands MT4
Cesar Sebastian Rosales Ibarra
VWAP - Volume Weighted Average Price Stop guessing the day's fair price. See it. P eriod VWAP with deviation bands and forward projection — for traders who need institutional reference levels on every timeframe. VWAP is the single most-watched level by institutions, prop desks, and algorithmic traders. Not because it's magic — because it's the price the market actually paid. This indicator puts 5 VWAP period modes (Daily / Weekly / Monthly / Quarterly / Yearly) on your chart with 4 deviation ban
Volume Bubbles MT4
Cesar Sebastian Rosales Ibarra
Volume Bubbles  See the volume outliers and divergence bars — before they reverse on you. Volume Bubbles — on-chart volume spike detector with divergence arrows. Most volume tools dump a histogram at the bottom of your screen and leave you to guess which bars actually mattered. Volume Bubbles puts the answer directly on the chart: a bubble on the bar, sized by how unusual the volume was, colored by what that volume means, with an arrow when the volume story disagrees with the price story. What
Volume Profile  Stop guessing where the real money traded. See it. Volume Profile — multi-mode, multi-profile, with POC / Value Area / Peaks & Valleys drawn directly on your chart. Most volume tools dump a histogram at the bottom of your screen and make you guess which price level actually carried the volume. Volume Profile puts the volume where the price is — on the chart, at the price levels where money actually changed hands. You see the value area, the control point, the rejection tails, an
Daily VWAP plus Bands MT5
Cesar Sebastian Rosales Ibarra
VWAP - Volume Weighted Average Price Stop guessing the day's fair price. See it. Period VWAP with deviation bands and forward projection — for traders who need institutional reference levels on every timeframe. VWAP is the single most-watched level by institutions, prop desks, and algorithmic traders. Not because it's magic — because it's the price the market actually paid. This indicator puts 5 VWAP period modes (Daily / Weekly / Monthly / Quarterly / Yearly) on your chart with 4 deviation ba
Anchored VWAP plus Bands MT5
Cesar Sebastian Rosales Ibarra
Anchored VWAP — 5 draggable anchors with deviation bands  Volume-weighted average price anchored to user-defined points on the chart. Drop an anchor where you want the VWAP to start — earnings, swing high/low, session open, any event — and the indicator recalculates from that bar forward. What it does: Up to 5 independent anchors, each with its own VWAP line and color, running simultaneously on the same chart 2 configurable σ deviation bands (default ±1σ and ±2σ) attachable to any single anchor
Volume Profile  Stop guessing where the real money traded. See it. Volume Profile — multi-mode, multi-profile, with POC / Value Area / Peaks & Valleys drawn directly on your chart. Most volume tools dump a histogram at the bottom of your screen and make you guess which price level actually carried the volume. Volume Profile puts the volume where the price is — on the chart, at the price levels where money actually changed hands. You see the value area, the control point, the rejection tails, an
Market Profile TPO  See where the market spent its time — not just where it went. Market Profile TPO — multi-period Time-Price-Opportunity profiles with POC, Value Area, Initial Balance, Single Prints, dual volume overlay, and merge control — all on-chart, MT5. Stock chart shows you price. Volume histogram shows you money. Neither shows you where time actually accumulated — and time is what institutions use to read market balance and imbalance. Market Profile TPO brings that auction-theory view
Dynamic Volume Profile MT5
Cesar Sebastian Rosales Ibarra
Box Volume Profile Box Volume Profile draws a volume histogram inside any rectangle you place on the chart. Choose a time window and a price range, and the indicator shows how much volume was traded at each price level inside that zone. It also plots the Point of Control (POC) and the Value Area boundaries (VAH and VAL). How to use Press the draw hotkey (the letter V by default) and drag a rectangle anywhere on the chart. The volume profile appears immediately inside the box. Move or resize the
Filtro:
Sem comentários
Responder ao comentário