Dynamic Volume Profile MT4

Box Volume Profile

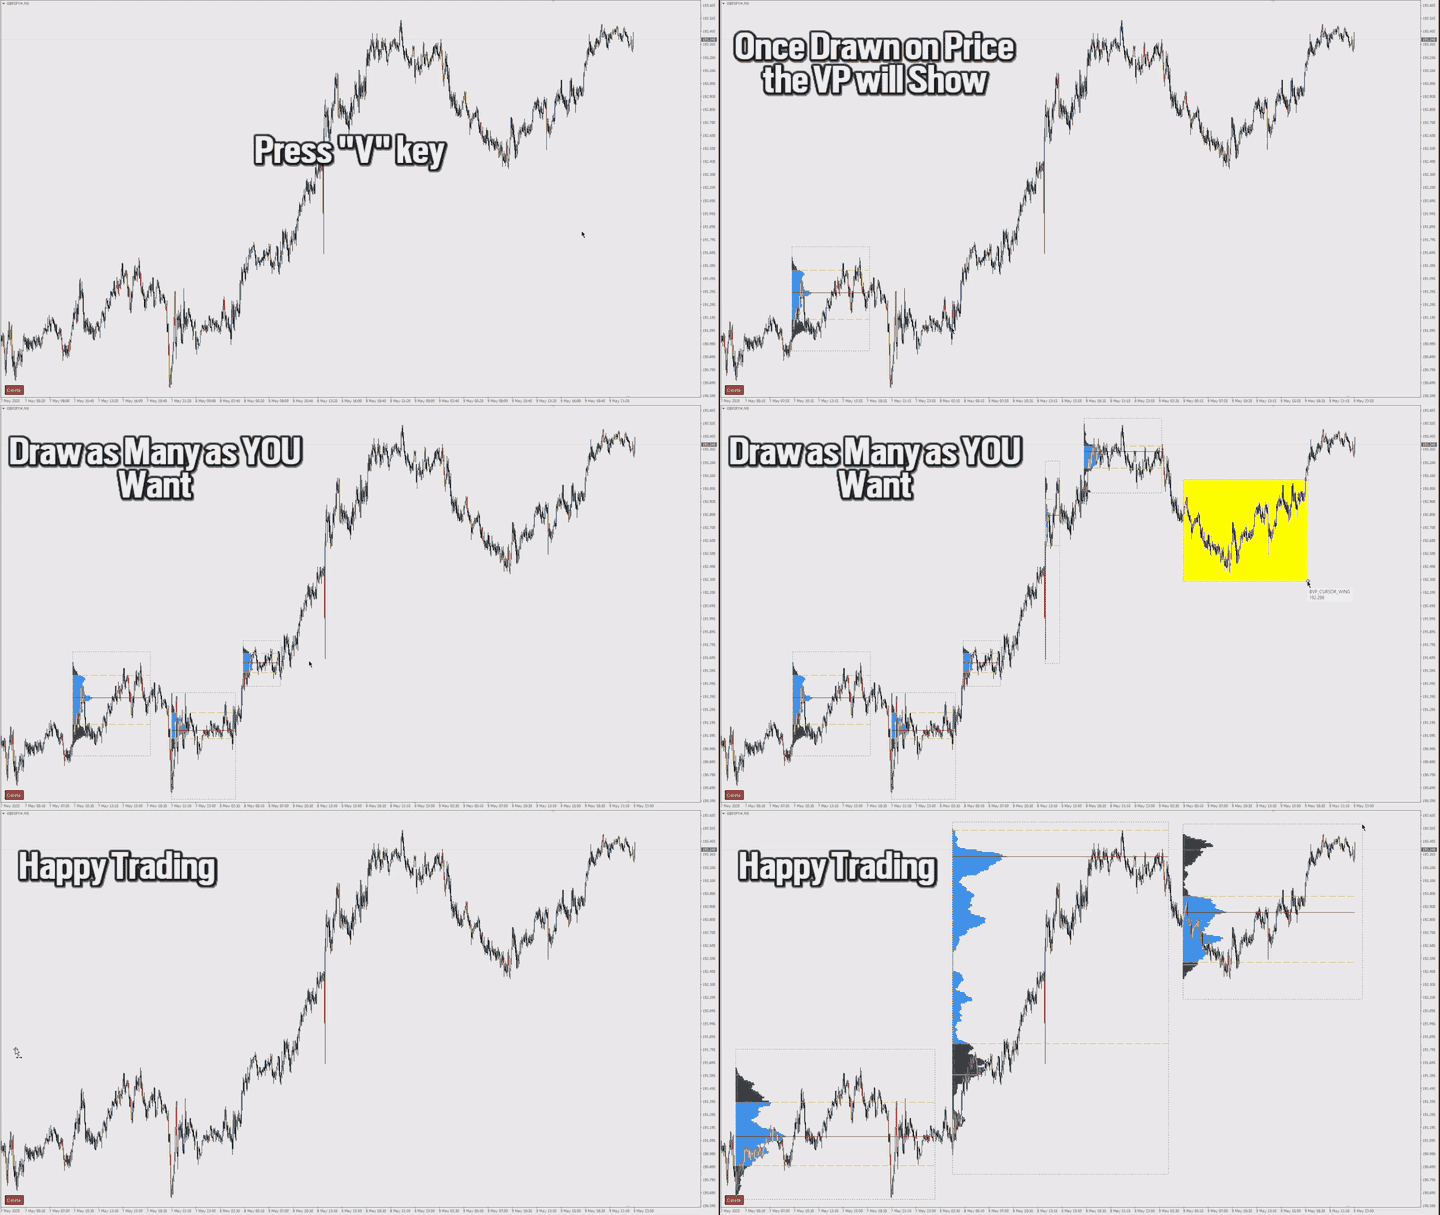
Box Volume Profile draws a volume histogram inside any rectangle you place on the chart. Choose a time window and a price range, and the indicator shows how much volume was traded at each price level inside that zone. It also plots the Point of Control (POC) and the Value Area boundaries (VAH and VAL).

How to use

Press the draw hotkey (the letter V by default) and drag a rectangle anywhere on the chart. The volume profile appears immediately inside the box. Move or resize the box at any time and the profile, POC and Value Area lines update on the fly. New bars that fall inside the box are added to the profile automatically.

What the profile shows

- A volume histogram with rows aligned to a fixed price step, so rows have the same height on every box.
- The POC line marking the price level with the highest traded volume inside the box.
- The Value Area (VAH and VAL) containing the percentage of volume you select, expanded from the POC in both directions.

- Each bar's volume is distributed evenly across its high-to-low range, so the profile follows the actual price action inside the box.

Features

- Place unlimited boxes on one chart, each with its own independent profile.
- Live recalculation when a box is moved, resized, or when new bars arrive.
- A one-click Clear button removes all boxes and their drawings. Boxes deleted by hand are cleaned up automatically, with no leftover objects.

- Works on any symbol and any timeframe.

Settings

Profile calculation:
- Price Step — the price height of one histogram row.
- Ticks Per Row — how many price steps form one row.
- Value Area % — percentage of volume inside the Value Area, 70 percent by default.
Appearance:
- Colors for the profile bars, Value Area bars, POC, VAH and VAL lines, the box and its frame.
Interface:
- Draw Hotkey — the key that starts box placement.
- Profile Width % — maximum histogram width as a percentage of the box width.
- Box Name Prefix — name prefix for placed boxes.

- Show Clear Button — show or hide the Clear button.

Notes

The profile is built from tick volume, which is the volume data MetaTrader 4 provides. On symbols and timeframes with low activity, increase Ticks Per Row to get fewer, wider rows. All settings apply to every box on the chart, and each profile is recalculated from the chart history when the indicator reloads.
Produits recommandés
Here   our more valuable tools SMC Trend Trading   ,  Easy SMC Trading  ,  Institutional SMC Architect Volume Analysis Tools  ,  Volume flow Profile  ,  Market volume profile  , FVG with Volume  , Liquidity Heatmap Profile  ,  Volume Spread Analysis The Market Profile & Volume Profile Indicator is a powerful technical analysis tool designed to visualize market activity and price distribution over specific timeframes. Unlike standard technical indicators that focus solely on price over time, th
BoxChart MT4
Evgeny Shevtsov
4.4 (5)
The market is unfair if only because 10% of participants manage 90% of funds. An ordinary trader has slim changes to stand against these "vultures". This problem can be solved. You just need to be among these 10%, learn to predict their intentions and move with them. Volume is the only preemptive factor that faultlessly works on any timeframe and symbol. First, the volume appears and is accumulated, and only then the price moves. The price moves from one volume to another. Areas of volume accumu

L'indicateur construit les cotations actuelles, qui peuvent être comparées aux cotations historiques et, sur cette base, faire une prévision de l'évolution des prix. L'indicateur dispose d'un champ de texte pour une navigation rapide jusqu'à la date souhaitée. Option : Symbole - sélection du symbole que l'indicateur affichera ; SymbolPeriod - sélection de la période à partir de laquelle l'indicateur prendra des données ; IndicatorColor - couleur de l'indicateur ; HorisontalShift - décalage
ZBubbles Delta
Vadim Verkhovtsev
ZBubbles Delta — Professional Volume Indicator for MT4 See volume the way institutions see it. Trade where smart money enters. ZBubbles Delta is an advanced volume analysis indicator for MetaTrader 4, combining statistical anomaly detection, ADX trend filtering, and built-in binary options statistics with Martingale tracking. Unlike standard volume histograms, ZBubbles Delta draws dynamic colored bubbles directly on price action, showing where institutional volume entered and how strong the
Blahtech Supply Demand
Blahtech Limited
4.58 (36)
Was: $299  Now: $99   Supply Demand uses previous price action to identify potential imbalances between buyers and sellers. The key is to identify the better odds zones, not just the untouched ones. Blahtech Supply Demand indicator delivers functionality previously unavailable on any trading platform. This 4-in-1 indicator not only highlights the higher probability zones using a multi-criteria strength engine, but also combines it with multi-timeframe trend analysis, previously confirmed swings
Money Flow Profile MT5 HERE   Here   our more valuable tools SMC Trend Trading   ,  Easy SMC Trading  ,  Institutional SMC Architect Volume Analysis Tools  ,  Volume flow Profile  ,  Market volume profile  , FVG with Volume  , Liquidity Heatmap Profile  ,  Volume Spread Analysis This Master Edition is engineered for clarity and speed, featuring a unique Auto-Theme Sync system that instantly beautifies your chart layout upon loading. Key Features: True Money Flow Calculation: Goes beyond stand
Delta Single Volume
Chantal Sala
3.67 (3)
Volume Delta is a very powerful indicator that reads the supply on the Market. It calculates the Delta from movement of the price and the difference of BUY and SELL Tick volumes. Its special structure allows you to get all timeframe values available on the MT4 platform. A good observation of this instrument can suggest great entry points and possible reversal. We are confident that this tool will help you to improve your trading timing. See also for MT5:  https://www.mql5.com/en/market/product/5
The "MR Volume Profile 4" indicator is a charting tool that displays trading volume at different price levels rather than time intervals. A key concept in volume profile is the point of control (POC)—the price level with the highest volume traded during the session or time range. While tools like VWAP or OBV provide volume trends, the "MR Volume Profile 4" indicator offers granular detail about where the most market activity occurs at specific price levels. This makes it a more precise tool for
Intraday Volume Profile Forex MT4   Intraday Volume Profile  - This is a visualization tool for understanding the high activity zone and low activity zone, as part of the  D1  senior timeframe. The volume profile provides an excellent visual image of supply / demand at each price for the selected timeframe. Introducing  POC  - Point of Control, which indicates the price at which the maximum volume was sold, as well as Value Area - the area where 68% of the instrument's assets are traded. POC  -
Volume Compair
Thiago Pereira Pinho
5 (1)
Professional Cumulative Delta & Volume Median Indicator Track   real buying/selling pressure   with this powerful volume analysis tool. The   Volume Compare Indicator   combines   Cumulative Delta   and   Volume Medians   to help you identify institutional activity, imbalances, and potential reversals. Key Features: Cumulative Delta Histogram   – Visualizes net buying vs. selling volume in real-time. Buy/Sell Volume Medians   – Horizontal lines showing average buy & sell volume levels. Smart Vo
Blahtech Market Profile
Blahtech Limited
4.53 (15)
Was: $249  Now: $99   Market Profile defines a number of day types that can help the trader to determine market behaviour. A key feature is the Value Area, representing the range of price action where 70% of trading took place. Understanding the Value Area can give traders valuable insight into market direction and establish the higher odds trade. It is an excellent addition to any system you may be using. Blahtech Limited presents their Market Profile indicator for the MetaTrader community. Ins
Trend Scan Friend
Israr Hussain Shah
Here   our more valuable tools SMC Trend Trading   ,  Easy SMC Trading  ,  Institutional SMC Architect Volume Analysis Tools  ,  Volume flow Profile  ,  Market volume profile  , FVG with Volume  , Liquidity Heatmap Profile  ,  Volume Spread Analysis Trend Identification: Look for the color change. When candles turn Green , look for Buy opportunities. When they turn Red , look for Sell opportunities. Entry: Enter on the break of the trend line or on the pullback to the line. Stop Loss: Use the
Volume Profile Sniper v11. 1-un outil Complet pour l'analyse du marché Approche professionnelle du commerce Volume Profile Sniper V11.1 combine plus de 15 filtres clés dans un seul indicateur, fournissant des signaux clairs basés sur une évaluation complète de la situation du marché. Principales caractéristiques Analyse du déséquilibre volumétrique-l'algorithme calcule la proportion d'acheteurs et de vendeurs dans chaque bougie, signalant la prédominance de l'une des parties (seuil configurabl
Market Profile Heat indicator  — is a classic Market Profile implementation that can show the price density over time, outlining the most important price levels, value area, and control value of a given trading session. This indicator can be attached to timeframes between M1 and D1 and will show the Market Profile for daily, weekly, monthly, or even intraday sessions. Lower timeframes offer higher precision. Higher timeframes are recommended for better visibility. It is also possible to use a fr
Here   our MT5 version more valuable tools SMC Trend Trading   ,  Easy SMC Trading  ,  Institutional SMC Architect Volume Analysis Tools  ,  Volume flow Profile  ,  Market volume profile  , FVG with Volume  , Liquidity Heatmap Profile  ,  Volume Spread Analysis 2. Key Features Dynamic Filtering : The core feature. As soon as the current price crosses a historical liquidity level, that level disappears. This reduces chart clutter and prevents you from trading off "dead" support/resistance. Liqui
Forex Volume MT4
KEENBASE SOFTWARE SOLUTIONS
KT Forex Volume affiche le volume d'achat et de vente d'une paire de devises sous forme d'histogramme coloré. Le volume est composé des transactions d'achat et de vente sur un actif. Sur le marché des changes (Forex) : Si le volume d'achat dépasse le volume de vente, le prix de la paire de devises augmente. Si le volume de vente dépasse le volume d'achat, le prix de la paire de devises diminue. Fonctionnalités Évitez les mauvaises transactions en les confirmant avec les données de volume par ti
Everyday trading represents a battle of buyers ("Bulls") pushing prices up and sellers ("Bears") pushing prices down. Depending on what party scores off, the day will end with a price that is higher or lower than that of the previous day. Intermediate results, first of all the highest and lowest price, allow to judge about how the battle was developing during the day. It is very important to be able to estimate the Bears Power balance since changes in this balance initially signalize about possi
Un indicateur technique qui calcule ses lectures sur les volumes de transactions. Sous forme d'histogramme, il montre l'accumulation de la force de mouvement de l'instrument de trading. Il dispose de systèmes de calcul indépendants pour les directions haussières et baissières. Fonctionne sur tous les instruments de trading et délais. Peut compléter n’importe quel système commercial. L'indicateur ne redessine pas ses valeurs, les signaux apparaissent sur la bougie actuelle. Il est facile à utilis
Le Volume Profile est l'un des outils analytiques les plus puissants utilisés par les traders professionnels et institutionnels. Contrairement aux indicateurs de volume traditionnels qui montrent uniquement le moment où les transactions se sont produites en bas de votre écran, le Volume Profile montre exactement à quels niveaux de prix ces transactions ont eu lieu. Cela vous donne une vision radiographique claire de la structure du marché, vous permettant de voir exactement où la smart money (ar
VolumeProfile
Robert Hess
3.8 (5)
Descption: The Volume Profile displays detailed informations of historical trading activities at certain price levels (Market Profile). So you can locate the areas with the best prices in the market and get an advantage about other market participants. Features: Customizable Volume Profile / Market Profile Shows the "fair" Value Area with 70% of all Volume Shows critical low volume zones Shows VPOC, VAL and VAH Points Works on all timeframes Also available for MT5 ( https://www.mql5.com/en/mark
MarketProfile EForex
Veridiana Adorno Kendrick
Market Profile Shows where the price has spent more time, highlighting important levels that can be used in trading. It is a powerful tool which is designed to take the fundamental components which comprise every market; price/volume/time, and visually display their relationship in real-time as the market develops for a pre-determined time period. Very powerful tool!
TITAN AI Volume Profile PRO MT4 is an advanced technical indicator designed for professional market analysis, volume profile distribution, and graphical data visualization in MetaTrader 4. Key Features: - Dynamic Volume Profile calculation based on price action and tick volume. - Automatic High Value Area (VAH), Low Value Area (VAL), and Point of Control (POC) detection. - High Volume Nodes (HVN) and Low Volume Nodes (LVN) highlighting. - Integrated Economic Calendar with news alerts. - Built-
Simply The Best Pro
Szymon Palczynski
5 (1)
This indicator displays the histogram and arrows on chart. When Simple The Best Pro are placed on a chart, they identify the trend.  The color of may be blue or red. The blue color stands for upside moves and the red color stands for downside trends. The indicator offers to set Stop Loss (SL) and  Take Profit (TP)  setting. The default value is ATR. Indicator has automatic optimization. The STB is a unique indicator that shows the tendency (button Bars) of a particular signals. The STB tells us
Here   our more valuable tools SMC Trend Trading   ,  Easy SMC Trading  ,  Institutional SMC Architect Volume Analysis Tools  ,  Volume flow Profile  ,  Market volume profile  , FVG with Volume  , Liquidity Heatmap Profile  ,  Volume Spread Analysis The activity of these professional operators, and more important, their true intentions, are clearly shown on a price chart if the trader knows how to read them .   VSA looks at the interrelationship between three variables on the chart in order
Time Bubble ***Specialized for GBPJPY 1H time frame*** (tested for two years with success rates about 82%) Time Circle's smart algorithm detects the price circles with time . give strong signals at the right time as result of combine the price and time. our team spent months to develop this indicator specially for GBPJPY ..with high success rates about 82% win trades over two years .tested from December 2016 to November 2018. *** in last two years total signals 1012 with 829 Wins and 183 Lo
Indicateur Price Grid Navigator Le Price Grid Navigator est un outil de trading puissant et intuitif conçu pour aider les traders à identifier dynamiquement les niveaux clés de support et de résistance. Il fournit des repères visuels clairs pour les points d'entrée, de sortie et les zones de retournement potentiels, ce qui en fait un outil essentiel pour les traders de tous niveaux d'expérience. En calculant et en traçant dynamiquement ces niveaux, l'indicateur offre aux traders une représenta
FREE
Cet indicateur est basé sur la transformée de Hartley discrète. L'utilisation de cette transformation vous permet d'appliquer différentes approches lors du traitement des séries chronologiques financières. Une caractéristique distinctive de cet indicateur est que ses lectures ne se réfèrent pas à un point sur le graphique, mais à tous les points de la période de l'indicateur. Lors du traitement d'une série temporelle, l'indicateur permet de sélectionner différents éléments de la série temporell
Last 50 Pips
Martin Alejandro Bamonte
L'indicateur Last 50 Pips est conçu pour identifier rapidement des opportunités d'achat et de vente basées sur le comportement récent des prix. Il mesure la variation des prix sur les dernières bougies pour mettre en évidence en jaune les moments où le prix peut changer de direction. Signal d'achat : Vous devez ouvrir une position d' ACHAT lorsque l'indicateur passe du ROUGE au JAUNE , ce qui suggère un passage d'une tendance baissière à une tendance haussière. Veuillez consulter les images pou
Bollinger Insight is a tick-volume price distribution tool for MT4. It displays a volume profile, point of control, value area, and low-volume regions directly on the main chart, helping users examine where market activity was concentrated within the selected range. Key features: - Builds a Tick Volume Profile across configurable price rows. - Displays the point of control and supports a developing POC mode. - Calculates VAH and VAL with an adjustable value-area ratio. - Detects low-volume no
Market Profile 3
Hussien Abdeltwab Hussien Ryad
3 (2)
Market Profile 3 MetaTrader 4 indicator  — is a classic Market Profile implementation that can show the price density over time, outlining the most important price levels, value area, and control value of a given trading session. This indicator can be attached to timeframes between M1 and D1 and will show the Market Profile for daily, weekly, monthly, or even intraday sessions. Lower timeframes offer higher precision. Higher timeframes are recommended for better visibility. It is also possible t
FREE
Les acheteurs de ce produit ont également acheté
SR Liquidity
Oleg Rodin
5 (2)
SR Liquidity est un indicateur de trading conçu pour révéler les zones cachées où se concentre la liquidité du marché et où le prix réagit avec le plus d'intensité. Ces zones de liquidité spécifiques agissent comme de puissants niveaux de support et de résistance, vous offrant une cartographie claire des points où le marché est le plus susceptible de se retourner. Plutôt que de tracer des lignes de support et de résistance classiques, l'indicateur SR Liquidity analyse le comportement réel des pr
Trend SniperX MT4
Sarvarbek Abduvoxobov
5 (5)
Trend Sniper X est un indicateur de suivi de tendance multi-temporalité pour MetaTrader 5 qui aide les traders à identifier la direction de la tendance et les points de retournement potentiels avec clarté et précision. Pour MT5 : https://www.mql5.com/en/market/product/181101 Information sur le prix : Le prix actuel est une offre promotionnelle et peut évoluer au fur et à mesure de la sortie des prochaines mises à jour et nouvelles fonctionnalités. Canal Code2Profit Maîtrisez le marché grâce à l'
Atomic Analyst
Issam Kassas
5 (14)
Atomic Analyst — MetaTrader 4 Pour toute question sur le produit, sa configuration ou le support technique, envoyez-moi un message directement ici sur MQL5. L’indicateur transforme des calculs complexes du marché en signaux visuels simples, bougies colorées, lectures de tendance, niveaux de stop-loss et plusieurs zones de take-profit que les traders peuvent comprendre rapidement et utiliser dans des conditions réelles de marché. Principales utilisations de trading : Scalping et trading intraday
Neuro Poseidon MT4
Daria Rezueva
4.74 (46)
Neuro Poseidon is a new indicator by Daria Rezueva. It combines precise trading signals with adaptive TP/SL levels - creating best possible trades as a result! Message me and get  Neuro Poseidon Assistant  as a gift to automize your trading process! What makes it stand out? 1. Proven profitability on all assets and timeframes 2. Only confirmed BUY and SELL signals present on the chart 3. Adaptive TP & SL levels generated by the software for each trade 4. Easy to understand - suitable for all
Smart Trend Trading System est un indicateur pour MetaTrader 4 qui réunit les informations de tendance, les signaux d’entrée et de sortie et les niveaux de prix sur un même graphique. Il combine plus de 10 outils de trading en un seul système, incluant la détection de tendance, les zones de retournement, Smart Cloud, la logique de trailing stop, le support et la résistance, la coloration des bougies, les alertes et l’analyse multi-timeframe. Le système est conçu pour vous aider à trader différen
Signal GoldRush Trend Arrow L'indicateur GoldRush Trend Arrow Signal fournit une analyse précise et en temps réel des tendances, spécialement conçue pour les scalpers à haute vitesse et à court terme sur la paire XAU/USD. Conçu spécialement pour les intervalles de temps d'une minute, cet outil affiche des flèches directionnelles indiquant clairement les points d'entrée, ce qui permet aux scalpers de naviguer en toute confiance dans des conditions de marché volatiles. L'indicateur se compose
Miraculous Indicator Binary & Forex v3 StrategySafe Miraculous Indicator Binary & Forex v3 StrategySafe est un indicateur professionnel conçu pour les traders qui recherchent des signaux clairs, des outils de confirmation puissants et une méthode structurée pour trader les marchés Binary et Forex. La version v3 intègre le MIR Dashboard, le Miraculous Confirmation Dashboard, la GANN Law, les niveaux Square of 9, les angles GANN et un mode Forex plus avancé pour une analyse plus complète. Fonction
Le système PRO Renko est un système de trading très précis spécialement conçu pour le trading de graphiques RENKO. Il s'agit d'un système universel qui peut être appliqué à divers instruments de négociation. Le système neutralise efficacement ce qu'on appelle le bruit du marché en vous donnant accès à des signaux d'inversion précis. L'indicateur est très facile à utiliser et n'a qu'un seul paramètre responsable de la génération du signal. Vous pouvez facilement adapter l'outil à n'importe que
Currency Strength Wizard est un indicateur très puissant qui vous offre une solution tout-en-un pour un trading réussi. L'indicateur calcule la puissance de telle ou telle paire de devises en utilisant les données de toutes les devises sur plusieurs périodes. Ces données sont représentées sous la forme d'un indice de devise facile à utiliser et de lignes électriques de devise que vous pouvez utiliser pour voir la puissance de telle ou telle devise. Tout ce dont vous avez besoin est d'attacher l'
Elliott Wave Trend was designed for the scientific wave counting. This tool focuses to get rid of the vagueness of the classic Elliott Wave Counting using the guideline from the template and pattern approach. In doing so, firstly Elliott Wave Trend offers the template for your wave counting. Secondly, it offers Wave Structural Score to assist to identify accurate wave formation. It offers both impulse wave Structural Score and corrective wave Structure Score. Structural Score is the rating to sh
Gann Made Easy
Oleg Rodin
4.84 (172)
Gann Made Easy est un système de trading Forex professionnel et facile à utiliser qui est basé sur les meilleurs principes de trading en utilisant la théorie de mr. WD Gann. L'indicateur fournit des signaux d'ACHAT et de VENTE précis, y compris les niveaux Stop Loss et Take Profit. Vous pouvez échanger même en déplacement en utilisant les notifications PUSH. VEUILLEZ ME CONTACTER APRÈS L'ACHAT POUR RECEVOIR GRATUITEMENT DES INSTRUCTIONS DE TRADING ET D'EXCELLENTS INDICATEURS SUPPLÉMENTAIRES! Vou
Trend Catcher ind
Ramil Minniakhmetov
5 (11)
INDICATEUR DE DÉTECTEUR DE TENDANCE L'indicateur de détecteur de tendance analyse les mouvements de prix du marché grâce à une combinaison d'indicateurs d'analyse de tendance adaptatifs, propriétaires et personnalisés. Il identifie la véritable direction du marché en filtrant les fluctuations à court terme et en se concentrant sur la force de la dynamique sous-jacente, l'expansion de la volatilité et la structure des prix. Il utilise également une combinaison d'indicateurs personnalisés de lis
M1 Sniper
Oleg Rodin
4.97 (30)
M1 SNIPER est un système d'indicateurs de trading facile à utiliser. Il s'agit d'un indicateur à flèche conçu pour l'unité de temps M1. Cet indicateur peut être utilisé seul pour le scalping sur l'unité de temps M1 ou intégré à votre système de trading existant. Bien que conçu spécifiquement pour le trading sur l'unité de temps M1, ce système peut également être utilisé avec d'autres unités de temps. Initialement, j'avais conçu cette méthode pour le trading du XAUUSD et du BTCUSD. Cependant, je
ACTUELLEMENT 40% DE RÉDUCTION La meilleure solution pour tout débutant ou trader expert ! Cet indicateur est un outil de trading unique, de haute qualité et abordable car nous avons incorporé un certain nombre de caractéristiques exclusives et une nouvelle formule. Avec seulement UN graphique, vous pouvez lire la force de la devise pour 28 paires Forex ! Imaginez comment votre trading va s'améliorer parce que vous êtes capable de repérer le point de déclenchement exact d'une nouvelle tendance
Fibonacci Trend Marker —  est un indicateur de tendance qui analyse le comportement de la bougie actuelle par rapport à la plage Haut-Bas (High-Low, HL) des bougies précédentes en utilisant les niveaux de retracement de Fibonacci. Il suit visuellement la force de la tendance, signalant un affaiblissement potentiel ou un renversement par un changement de couleur de la bougie. Caractéristiques: Conçu pour les traders axés sur les tendances, il permet d’identifier rapidement les changements de ten
Supply and Demand Dashboard PRO
Bernhard Schweigert
4.81 (21)
Actuellement 30% de réduction ! Ce tableau de bord est un logiciel très puissant qui fonctionne sur plusieurs symboles et jusqu'à 9 horizons temporels. Il est basé sur notre indicateur principal (Best reviews : Advanced Supply Demand ).   Le tableau de bord donne une excellente vue d'ensemble. Il montre :  Les valeurs d'offre et de demande filtrées, y compris l'évaluation de la force de la zone, Les distances en pips vers/et dans les zones, Il met en évidence les zones imbriquées, Il donne 4
AW Prime Oscillator
AW Trading Software Limited
5 (1)
Une combinaison de deux oscillateurs. Le premier affiche les points d'entrée, le second montre la tendance actuelle. L'indicateur peut afficher les signaux d'oscillateur par des flèches dans deux modes, tous les signaux d'oscillateur rapides ou les signaux uniquement dans la direction de la tendance actuelle. Il dispose d'un panneau multi-périodes et de trois types de notifications de signal. Avantages: Convient au day trading et au scalping Filtrage des tendances Configuration simple et sensibl
Currency Pulse — tableau de force des devises pour MetaTrader 4 À quoi sert l'indicateur Currency Pulse affiche dans un seul panneau compact sur le graphique quelles devises sont fortes et lesquelles sont faibles en ce moment, sur plusieurs unités de temps à la fois. À partir de ce classement, l'indicateur signale les paires présentant la plus forte divergence entre devises : acheter la forte, vendre la faible. L'indicateur ne dépend pas du symbole du graphique sur lequel il est placé. MT5 -vers
M1 Arrow
Oleg Rodin
4.81 (21)
M1 Arrow est un indicateur basé sur les principes naturels du marché, notamment l'analyse de la volatilité et du volume. Il est compatible avec toutes les unités de temps et toutes les paires de devises. Un paramètre simple d'utilisation vous permet d'adapter les signaux à la paire de devises et à l'unité de temps de votre choix. Outre son algorithme principal basé sur les signaux d'achat et de vente, l'indicateur intègre plusieurs stratégies supplémentaires, sélectionnables dans les paramètres.
Identify over 30 candlestick patterns with precision This indicator recognizes over 30 Japanese Candlestick Patterns and highlights them beautifully on the chart. It is simply one of those indicators price action traders can't live without. [ Installation Guide | Update Guide | Troubleshooting | FAQ | All Products  ] Boost your technical analysis overnight Detect japanese candlestick patterns easily Trade reliable and universal reversal patterns Hop onto established trends safely using continua
Quantum Naked SMC Prime is a streamlined Smart Money Concepts indicator designed for traders who prefer a clean chart, structured market analysis and clear visual trade setups without unnecessary complexity. The indicator combines market structure, liquidity behavior, institutional zones and confirmation logic into a compact analytical framework. Instead of flooding the chart with technical indicators, Quantum Naked SMC Prime focuses on the core elements of price action and Smart Money Concepts
DayTrader PRO MT4
Davit Beridze
4.6 (10)
DayTrader PRO MT5:  https://www.mql5.com/en/market/product/186222 DayTrader PRO est un indicateur de trading avancé qui combine le filtre Laguerre de John Ehlers avec un puissant moteur d'auto-optimisation. Au lieu d'utiliser des paramètres fixes, l'indicateur recherche automatiquement les meilleurs réglages en fonction des conditions récentes du marché, vous aidant à vous adapter à la volatilité changeante sans ajustements manuels constants. L'indicateur génère des signaux clairs d'ACHAT (BUY)
Quantum Trend Sniper MT4
Ian Andrew Nicholson
5 (1)
Quantum Trend Sniper PRO for MetaTrader 4 Quantum Trend Sniper PRO is a professional-grade MT4 indicator built for traders who want selective entries, clear trade structure, and live on-chart decision support . This is not a basic buy/sell arrow tool. It is a complete trading workflow that helps you identify higher-quality setups, project the full trade structure, monitor progression through multiple profit targets, and review trade behavior directly on the chart. Designed for traders who value
Scalper Inside PRO
Alexey Minkov
4.74 (69)
Scalper Inside PRO helps you read the intraday trend and plan a trade before you enter the market. It is built around three exclusive strategies for a sharper read of the market. The moment a signal appears, the indicator evaluates market direction and calculates the key levels, so you see the potential entry, the expected stop-loss and several profit-taking levels in advance. Detailed performance statistics show how different instruments and strategies performed in history and help you pick ass
The Extreme point indicator helps in determining the probable price reversal points on the chart. The indicator facilitates the search for points to enter the market with greater accuracy. The indicator displays certain impulses, after which there is a high probability of the price continuing its movement in the same direction. The indicator can be used in conjunction with other indicators for a more accurate detection of the position entry points. The indicator can also be used independently. F
JSL Orderflow Footprint turns every candle into a price ladder that shows how much volume traded on the bid and on the ask at each price level. It highlights diagonal imbalances, stacked imbalance zones, absorption at candle extremes, cumulative delta (CVD), delta divergence and the daily session volume profile, then combines five of these order-flow conditions into a 0–100 confluence score. A signal is only issued on bar close when the score is high, clearly one-sided and confirmed by the candl
Top Bottom Tracker est un indicateur basé sur des algorithmes sophistiqués qui analyse la tendance du marché et peut détecter les hauts et les bas de la tendance / Version MT5 . Le prix augmentera progressivement jusqu'à ce qu'il atteigne 500$. Prochain prix --> 99$ Caractéristiques Pas de repeinture Cet indicateur ne change pas ses valeurs lorsque de nouvelles données arrivent Paires de trading Toutes les paires de devises Période de temps Toutes les périodes de temps Paramètres de
True Choppiness Direction determines if the market is choppy (trading sideways) or if it is trending, as well as the trend direction and strength (green=up, red=down, grey=no trend) . The underlying algorithm is designed to detect trend movements even in the presence of noisy market data, please see screenshots. Trend strength is indicated by taller or shorter red/green fill. Choppiness index is range-bound between -50 (very trendy) and +50 (very choppy). This is a custom algorithm designed by u
PTS Precision Index Oscillator V2
PrecisionTradingSystems
5 (1)
L'oscillateur de l'indice de précision (Pi-Osc) de Roger Medcalf de Precision Trading Systems La version 2 a été soigneusement recodée pour être ultra-rapide à charger sur votre graphique, et quelques autres améliorations techniques ont été incorporées pour améliorer l'expérience. Le Pi-Osc a été créé pour fournir des signaux de synchronisation de trading précis conçus pour trouver des points d'épuisement extrêmes, les points auxquels les marchés sont contraints d'aller simplement pour élimin
KURAMA GOLD SIGNAL PRO (MT4) — Filtre à 7 couches · TP/SL automatique · Score de qualité · Sauvegarde de l'historique des signaux | Système de trading complet pour le XAUUSD Pas de repeint en temps réel. À l'instant où un signal apparaît, la flèche, l'entrée, le TP et le SL sont verrouillés sur place et ne bougent plus jamais ensuite. Ce que vous tradez, c'est ce signal en temps réel. Et dans la v7.20, chaque signal réellement envoyé est sauvegardé automatiquement et restauré à l'identique aprè
Plus de l'auteur
Volume Bubbles version MT5
Cesar Sebastian Rosales Ibarra
Volume Bubbles  See the volume outliers and divergence bars — before they reverse on you. Volume Bubbles — on-chart volume spike detector with divergence arrows. Most volume tools dump a histogram at the bottom of your screen and leave you to guess which bars actually mattered. Volume Bubbles puts the answer directly on the chart: a bubble on the bar, sized by how unusual the volume was, colored by what that volume means, with an arrow when the volume story disagrees with the price story. Wha
Market Profile TPO is a multi-period Time-Price-Opportunity (TPO) indicator for MetaTrader 4. It builds price profiles from time data and displays the Point of Control (POC), Value Area (VAH and VAL), Initial Balance (IB), Single Prints, a volume overlay and profile merging on the chart. It is written entirely in MQL4 and does not use DLLs or external files. What the indicator draws - TPO profile: each price level is tagged with the time slice in which it traded. Displayed as letters or filled b
Anchored VWAP plus Bands MT4
Cesar Sebastian Rosales Ibarra
Anchored VWAP — 5 draggable anchors with deviation bands  Volume-weighted average price anchored to user-defined points on the chart. Drop an anchor where you want the VWAP to start — earnings, swing high/low, session open, any event — and the indicator recalculates from that bar forward. What it does: Up to 5 independent anchors, each with its own VWAP line and color, running simultaneously on the same chart 2 configurable σ deviation bands (default ±1σ and ±2σ) attachable to any single anchor
Daily VWAP plus Bands MT4
Cesar Sebastian Rosales Ibarra
VWAP - Volume Weighted Average Price Stop guessing the day's fair price. See it. P eriod VWAP with deviation bands and forward projection — for traders who need institutional reference levels on every timeframe. VWAP is the single most-watched level by institutions, prop desks, and algorithmic traders. Not because it's magic — because it's the price the market actually paid. This indicator puts 5 VWAP period modes (Daily / Weekly / Monthly / Quarterly / Yearly) on your chart with 4 deviation ban
Volume Bubbles MT4
Cesar Sebastian Rosales Ibarra
Volume Bubbles  See the volume outliers and divergence bars — before they reverse on you. Volume Bubbles — on-chart volume spike detector with divergence arrows. Most volume tools dump a histogram at the bottom of your screen and leave you to guess which bars actually mattered. Volume Bubbles puts the answer directly on the chart: a bubble on the bar, sized by how unusual the volume was, colored by what that volume means, with an arrow when the volume story disagrees with the price story. What
Volume Profile  Stop guessing where the real money traded. See it. Volume Profile — multi-mode, multi-profile, with POC / Value Area / Peaks & Valleys drawn directly on your chart. Most volume tools dump a histogram at the bottom of your screen and make you guess which price level actually carried the volume. Volume Profile puts the volume where the price is — on the chart, at the price levels where money actually changed hands. You see the value area, the control point, the rejection tails, an
Daily VWAP plus Bands MT5
Cesar Sebastian Rosales Ibarra
VWAP - Volume Weighted Average Price Stop guessing the day's fair price. See it. Period VWAP with deviation bands and forward projection — for traders who need institutional reference levels on every timeframe. VWAP is the single most-watched level by institutions, prop desks, and algorithmic traders. Not because it's magic — because it's the price the market actually paid. This indicator puts 5 VWAP period modes (Daily / Weekly / Monthly / Quarterly / Yearly) on your chart with 4 deviation ba
Anchored VWAP plus Bands MT5
Cesar Sebastian Rosales Ibarra
Anchored VWAP — 5 draggable anchors with deviation bands  Volume-weighted average price anchored to user-defined points on the chart. Drop an anchor where you want the VWAP to start — earnings, swing high/low, session open, any event — and the indicator recalculates from that bar forward. What it does: Up to 5 independent anchors, each with its own VWAP line and color, running simultaneously on the same chart 2 configurable σ deviation bands (default ±1σ and ±2σ) attachable to any single anchor
Volume Profile  Stop guessing where the real money traded. See it. Volume Profile — multi-mode, multi-profile, with POC / Value Area / Peaks & Valleys drawn directly on your chart. Most volume tools dump a histogram at the bottom of your screen and make you guess which price level actually carried the volume. Volume Profile puts the volume where the price is — on the chart, at the price levels where money actually changed hands. You see the value area, the control point, the rejection tails, an
Market Profile TPO  See where the market spent its time — not just where it went. Market Profile TPO — multi-period Time-Price-Opportunity profiles with POC, Value Area, Initial Balance, Single Prints, dual volume overlay, and merge control — all on-chart, MT5. Stock chart shows you price. Volume histogram shows you money. Neither shows you where time actually accumulated — and time is what institutions use to read market balance and imbalance. Market Profile TPO brings that auction-theory view
Dynamic Volume Profile MT5
Cesar Sebastian Rosales Ibarra
Box Volume Profile Box Volume Profile draws a volume histogram inside any rectangle you place on the chart. Choose a time window and a price range, and the indicator shows how much volume was traded at each price level inside that zone. It also plots the Point of Control (POC) and the Value Area boundaries (VAH and VAL). How to use Press the draw hotkey (the letter V by default) and drag a rectangle anywhere on the chart. The volume profile appears immediately inside the box. Move or resize the
Filtrer:
Aucun avis
Répondre à l'avis