Master Volume profile

Money Flow Profile MT5 HERE

  Master Edition
is a professional-grade analytical tool designed to visualize market structure through the lens of volume and money flow. Unlike standard volume indicators, this tool displays a Daily Volume Profile directly on your chart, allowing you to see exactly where price discovery occurred and where the "smart money" is positioned.

This Master Edition is engineered for clarity and speed, featuring a unique Auto-Theme Sync system that instantly beautifies your chart layout upon loading.

Key Features:

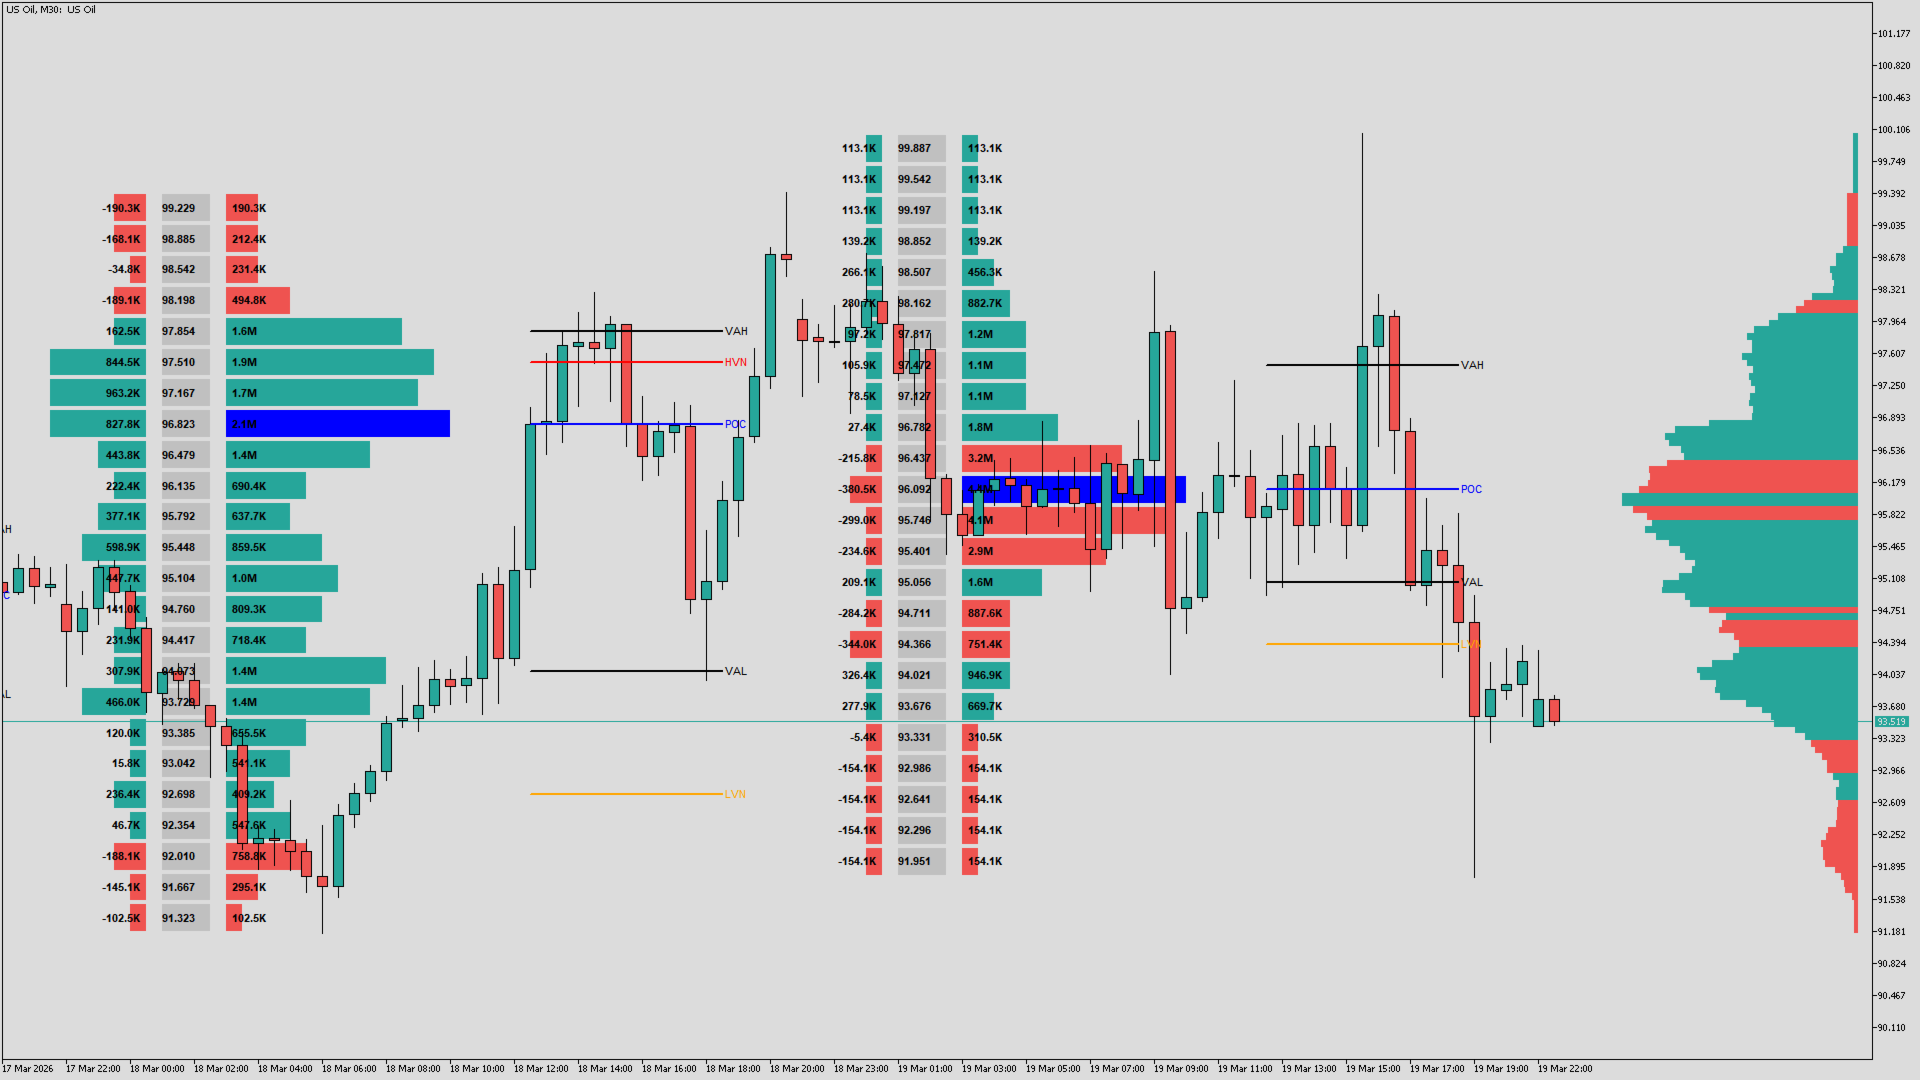
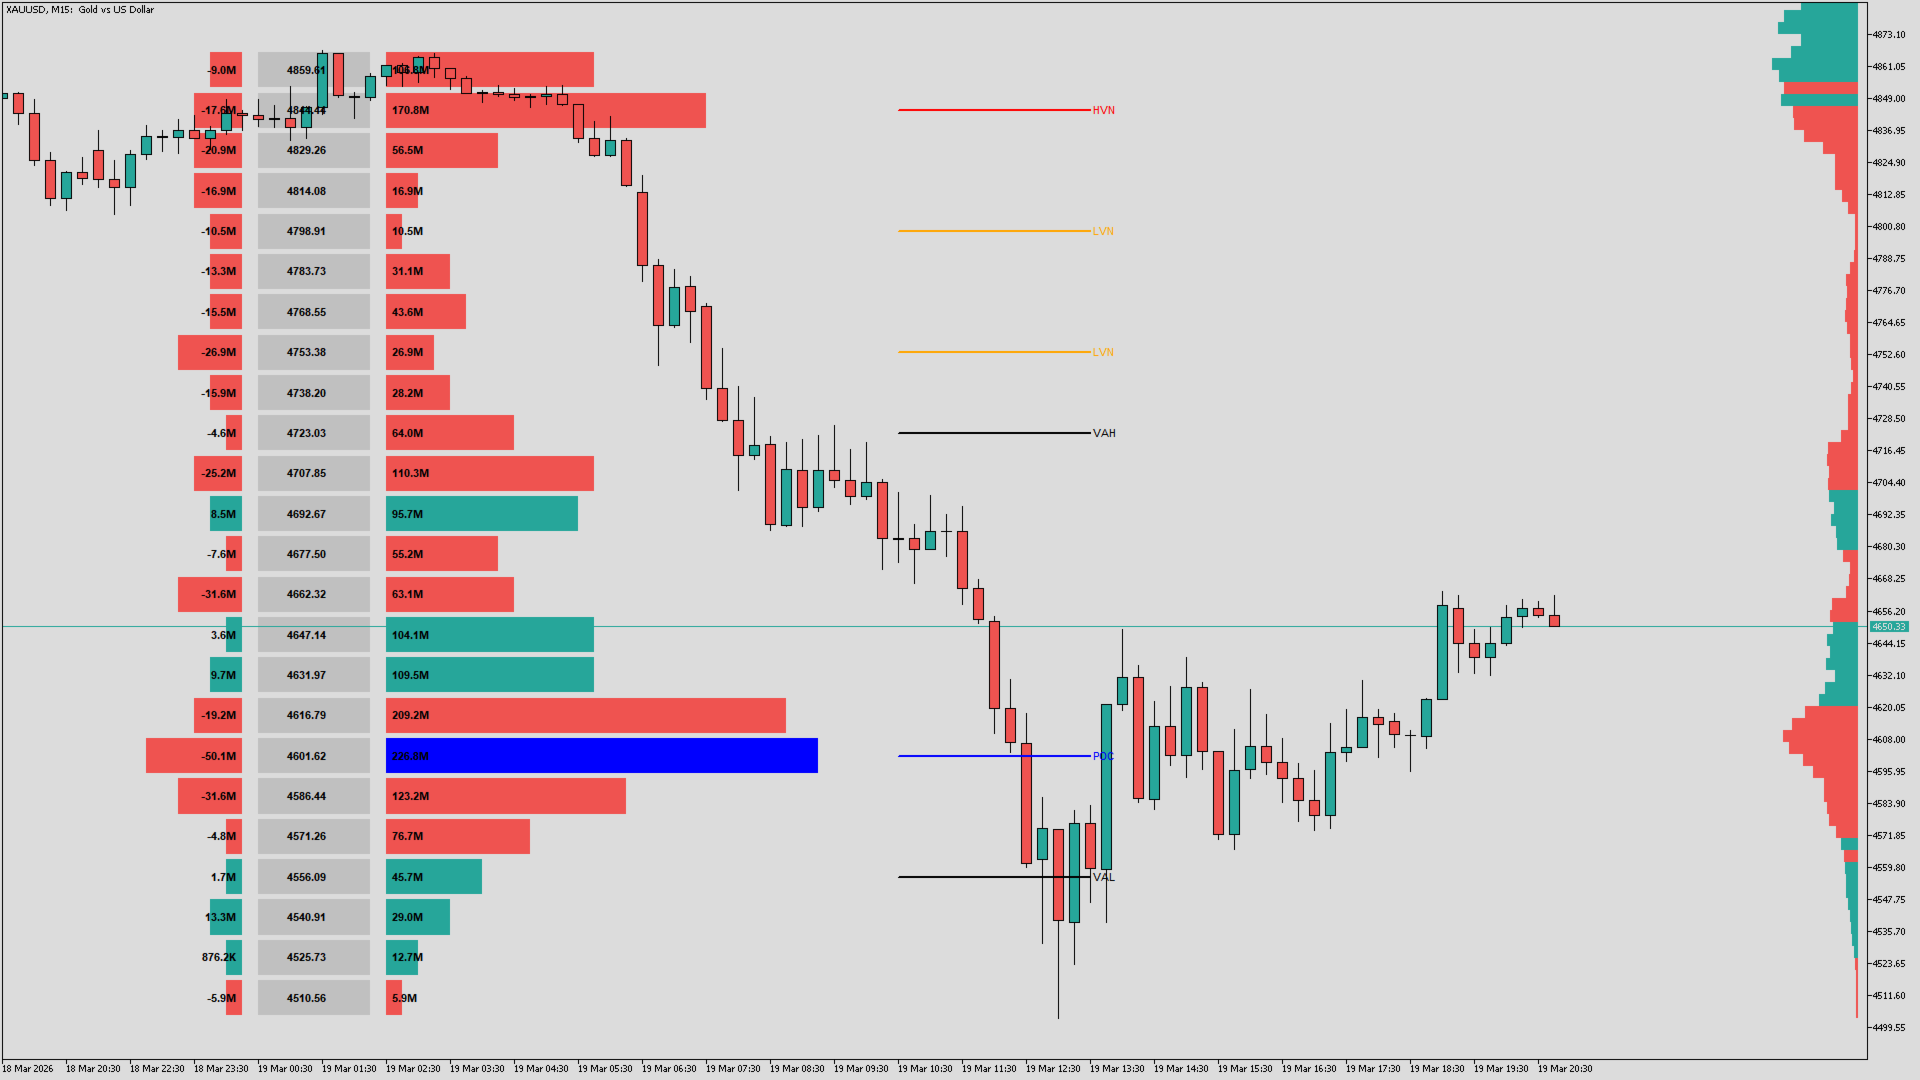
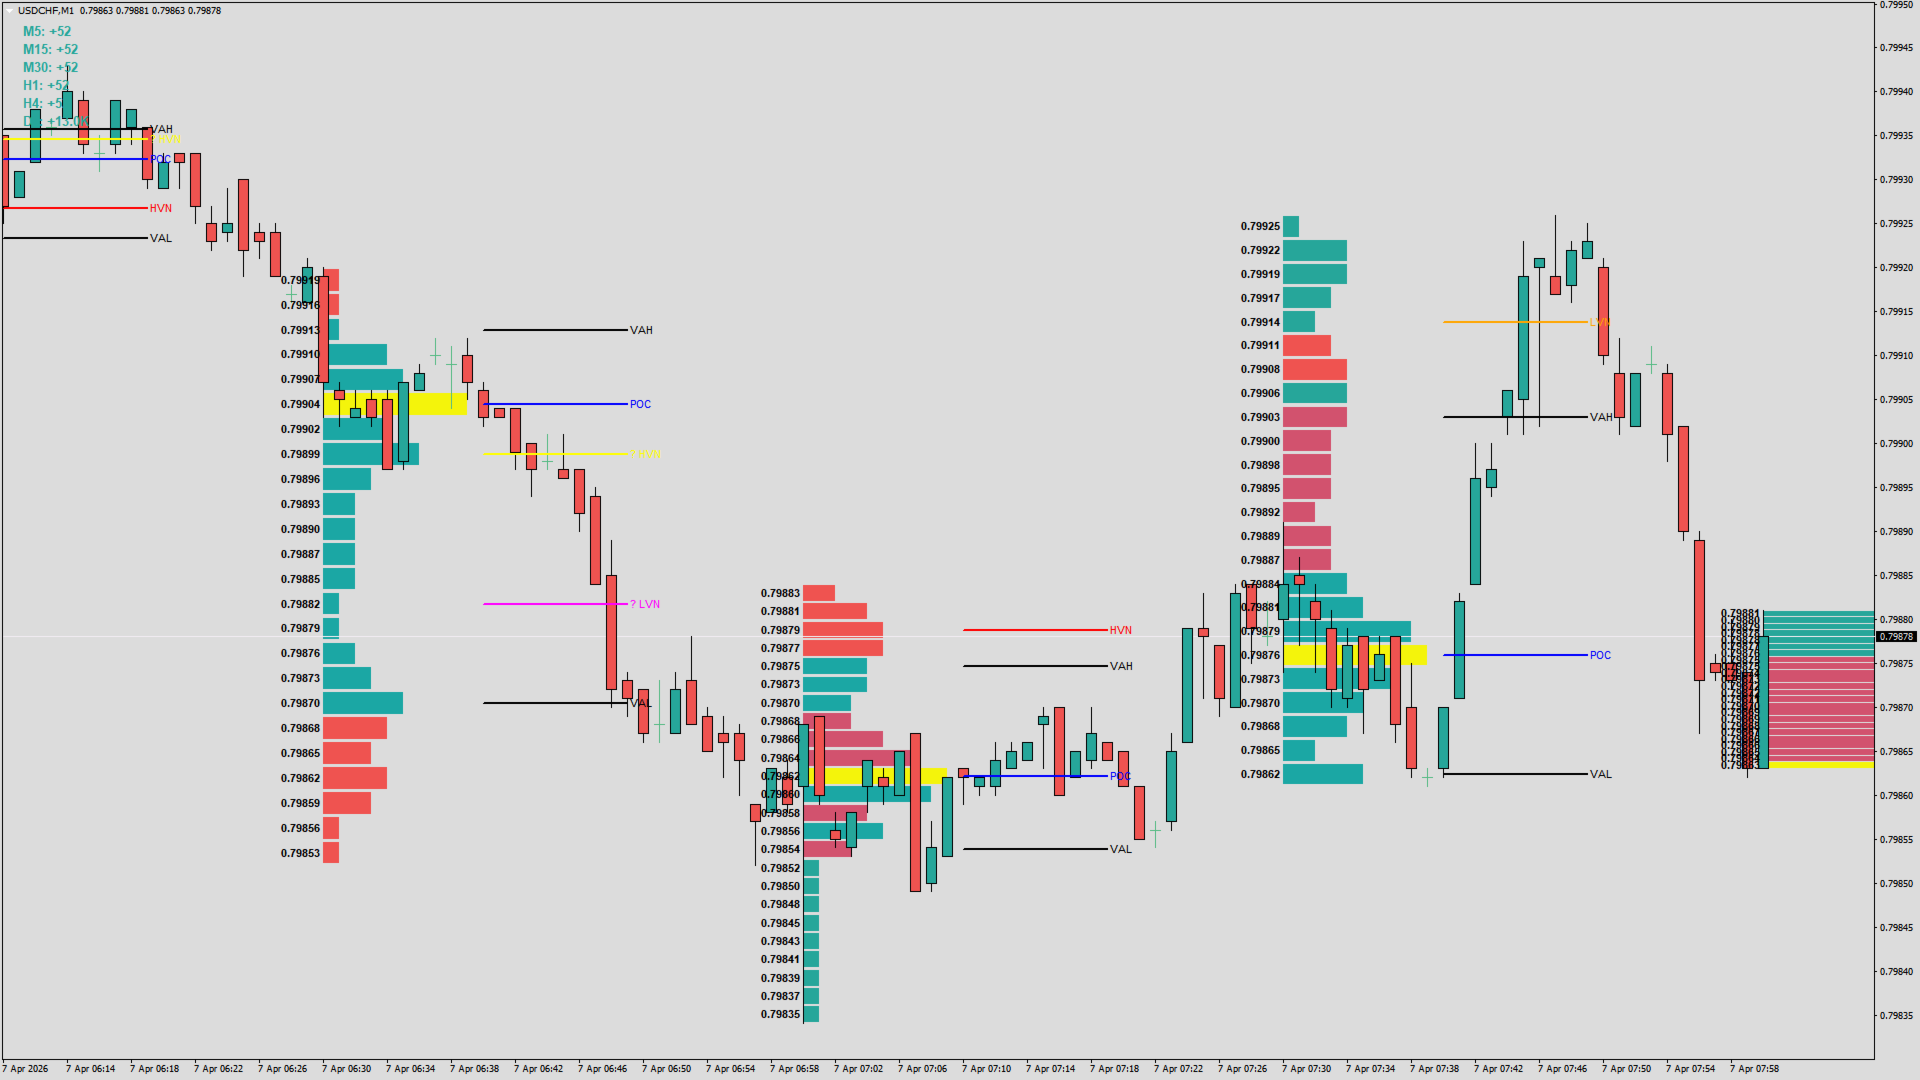
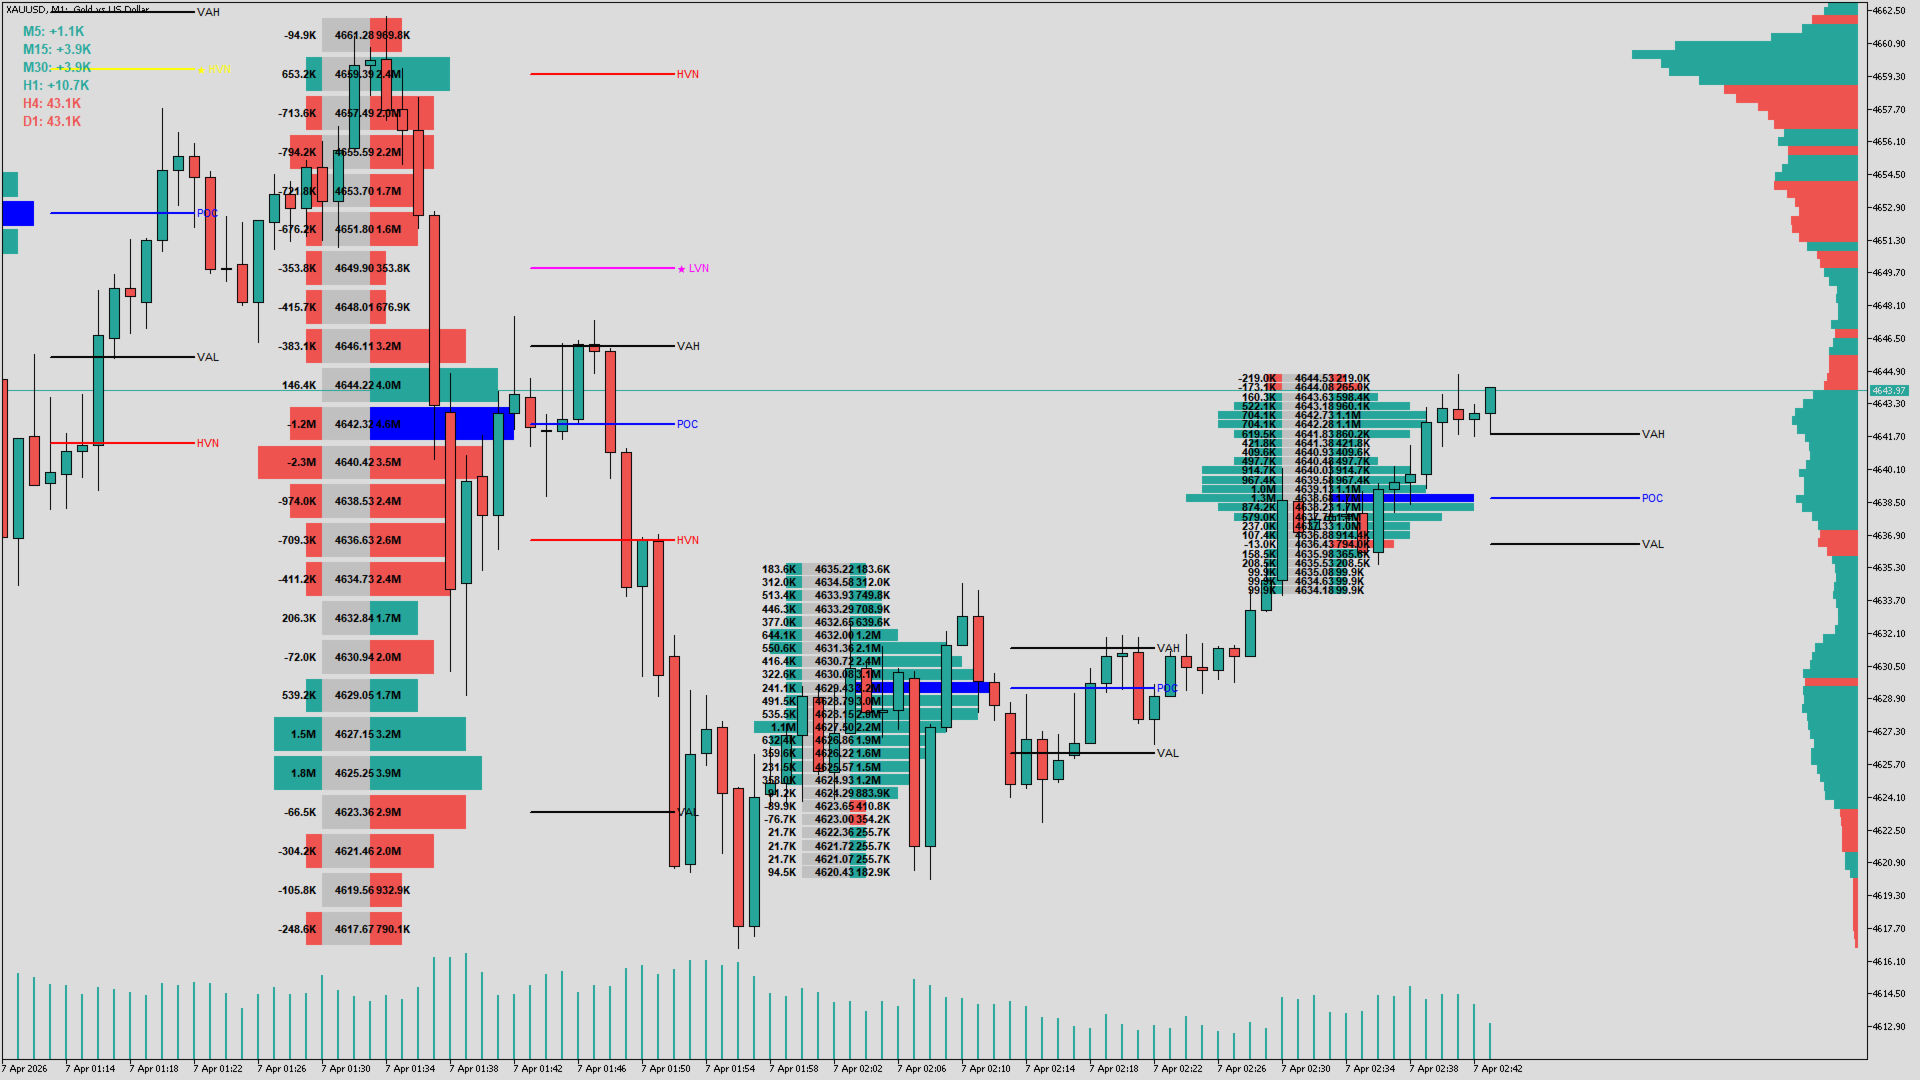
  1. True Money Flow Calculation: Goes beyond standard tick volume. When "Use Money Flow" is enabled, volume is weighted by price, revealing the actual capital commitment at specific price levels.

  2. Value Area (VA) Visualization: Automatically calculates the Value Area (70% of volume by default).

    • VA Fill: Shades the Value Area background for instant identification of the control zone.
    • Key Levels: Clearly marks the Point of Control (POC), Value Area High (VAH), and Value Area Low (VAL).
  3. Professional Markers System: Scans the profile structure to identify critical trading zones:

    • HVN (High Volume Nodes): Areas of acceptance and consolidation (support/resistance).
    • LVN (Low Volume Nodes): Areas of rejection or "fast travel" zones.
    • All markers are drawn with extension lines to the right for easy monitoring.
  4. Delta Divergence (Left Histogram): The left-side histogram visualizes the Buy vs. Sell pressure (Delta) per level. This helps identify hidden divergences—where price may be rising but sellers are aggressively hitting the bid at those levels.

  5. Composite Sidebar: A sidebar histogram displays the consolidated volume profile for the entire lookback period, providing a "big picture" view of the market's equilibrium.

  6. One-Click Chart Theming: Stop wasting time tweaking chart colors. The "Auto Theme" feature applies a professional, high-contrast color scheme (Gainsboro background, Teal/Bullish, Red/Bearish) instantly upon initialization.

Input Parameters:

  • Lookback Days: Define how many daily profiles to display.
  • Daily Rows: Granularity of the profile (default 24 rows).
  • Value Area Percentage: Customize the VA range (default 70%).
  • Appearance: Adjust width, gaps, font sizes, and marker lengths.

Why Trade with Volume Profile? Price tells you where the market is; Volume tells you how much the market cares. This tool combines both to help you find high-probability turning points before they happen.


Рекомендуем также
Профиль Рынка (Market Profile) определяет ряд типов дней, которые помогают трейдеру распознать поведение рынка. Ключевая особенность - это область значений (Value Area), представляющая диапазон ценового действия, в котором произошло 70% торговли. Понимание области значений может помочь трейдерам вникнуть в направление рынка и установить торговлю с более высокими шансами на успех. Это отличное дополнение к любой системе, которую вы возможно используете. Blahtech Limited представляет сообществу Me
Volume Profile Sniper v11.1 -комплексный инструмент для анализа рынка и профессиональный подход к торговле Volume Profile Sniper v11.1 объединяет более 15 ключевых фильтров в одном индикаторе, предоставляя чёткие сигналы на основе комплексной оценки рыночной ситуации. Основные возможности Анализ объёмного дисбаланса   – алгоритм вычисляет долю покупателей и продавцов в каждой свече, сигнализируя о преобладании одной из сторон (настраиваемый порог от 50% до 90%). Многоуровневая фильтрация сигн
Индикатор строит текущие котировки, которые можно сравнить с историческими и на этом основании сделать прогноз ценового движения. Индикатор имеет текстовое поле для быстрой навигации к нужной дате. Параметры : Symbol - выбор символа, который будет отображать индикатор; SymbolPeriod - выбор периода, с которого индикатор будет брать данные; IndicatorColor - цвет индикатора; Inverse - true переворачивает котировки, false - исходный вид; Далее идут настройки текстового поля, в которое можно ввес
Это, пожалуй, самый полный индикатор автоматического распознавания гармонического ценообразования, который вы можете найти для платформы MetaTrader. Он обнаруживает 19 различных паттернов, воспринимает проекции Фибоначчи так же серьезно, как и вы, отображает зону потенциального разворота (PRZ) и находит подходящие уровни стоп-лосс и тейк-профит. [ Руководство по установке | Руководство по обновлению | Устранение неполадок | FAQ | Все продукты ] Он обнаруживает 19 различных гармонических ценов
BoxChart MT4
Evgeny Shevtsov
4.4 (5)
Рынок несправедлив, хотя бы потому, что всего лишь 10% игроков управляют 90% капитала. У рядового трейдера мало шансов, чтобы противостоять этим «хищникам». Но выход есть, необходимо всего лишь перейти на другую сторону, необходимо находиться в числе этих 10% «акул», научиться распознавать их намерения и двигаться вместе с ними. Объем - это единственный опережающий фактор, который безупречно работает на любом периоде и любом торговом инструменте. Сначала зарождается и накапливается объем, и толь
Индикатор SMC Venom Model BPR — профессиональный инструмент для трейдеров, работающих в рамках концепции Smart Money (SMC). Он автоматически идентифицирует на графике цены два ключевых паттерна:  FVG (Fair Value Gap) — комбинация их трёх свечей, в которой имеется разрыв между первой и третьей свечой. Формирует зону между уровнями, где отсутствует поддержка объемов, что часто приводит к коррекции цены. BPR (Balanced Price Range)— комбинация двух FVG-паттернов, образующих «мост»  — зону пробоя и в
Volume Compair
Thiago Pereira Pinho
5 (1)
Ключевые Особенности  Гистограмма Кумулятивной Дельты – Визуализирует чистый объем покупок против объема продаж в реальном времени. Медианы Объема Покупок/Продаж – Горизонтальные линии, показывающие средние уровни объема покупок и продаж.  Умная Классификация Объема – Разделяет: Сильные Покупки (Зеленый) – Бычье давление. Сильные Продажи (Красный) – Медвежье давление. Медиана Объема Покупок (Синяя Линия) – Ориентир для типичного объема покупок. Медиана Объема Продаж (Оранжевая Линия) – Ориентир
Индикатор управления рисками и мониторинга лимитов для профессиональных трейдеров и счетов оценивания (Prop) Этот инструмент лишь отображает на графике точную информацию по управлению рисками и лимитам, помогая принимать решения более сосредоточенно. Индикатор не открывает/не закрывает/не изменяет сделки и не конфликтует с советниками (EA). Возможности Мониторинг дневной и общей просадки Рассчитывает и показывает дневную и суммарную просадку на базе баланса (Balance) или средств (Equity) (настр
Gioteen Volatility Index (GVI)   - your ultimate solution to overcoming market unpredictability and maximizing trading opportunities. This revolutionary indicator helps you in lowering your losing trades due to choppy market movements. The GVI is designed to measure market volatility, providing you with valuable insights to identify the most favorable trading prospects. Its intuitive interface consists of a dynamic red line representing the volatility index, accompanied by blue line that indicat
Представляем вашему вниманию индикатор "Счётчик закрытия свечи", который станет вашим незаменимым помощником в мире трейдинга. Вот почему знание того, когда свеча закроется, может помочь: Если вы любите торговать, используя свечные паттерны, то вы будете знать, когда свеча будет закрыта. Этот индикатор позволит вам проверить, сформировался ли известный шаблон и есть ли возможность торговли. Индикатор поможет вам подготовиться к открытию рынка и закрытию рынка. Вы можете установить таймер, чтобы
Antabod Gamechanger
Rev Anthony Olusegun Aboderin
*Antabod GameChanger Indicator – Transform Your Trading!*   Are you tired of chasing trends too late or second-guessing your trades? The *Antabod GameChanger Indicator* is here to *revolutionize your trading strategy* and give you the edge you need in the markets!   Why Choose GameChanger? *Accurate Trend Detection* – GameChanger identifies trend reversals with *pinpoint accuracy*, ensuring you enter and exit trades at the optimal time.   *Clear Buy & Sell Signals* – No more guesswork! T
Индикатор Supply Demand использует предыдущее ценовое действие для выявления потенциального дисбаланса между покупателями и продавцами. Ключевым является определение зон с лучшими возможностями, а не просто вероятностей. Индикатор Blahtech Supply Demand обеспечивает функционал, не доступный ни в одной платформе. Этот индикатор 4 в 1 не только выделяет зоны с более высокой вероятностью на основе механизма оценки силы по множественным критериям, но также комбинирует его с мульти-таймфреймовым анал
Sorsawo Magic Signal Pro is an advanced technical analysis tool designed to identify high-probability entry points by combining adaptive momentum logic with smart volatility filtering. Core Features Adaptive WPR Logic : Unlike standard oscillators, Sorsawo Magic uses a dynamic calculation period that automatically adjusts based on market volatility. Volatility-Filtered Signals : The indicator analyzes price gaps and momentum surges to ensure signals are only generated when there is sufficient ma
FREE
KT Renko Patterns MT4
KEENBASE SOFTWARE SOLUTIONS
2.33 (3)
KT Renko Patterns анализирует график Ренко кирпич за кирпичиком, чтобы найти известные графические паттерны, которые часто используют трейдеры на различных финансовых рынках. По сравнению с графиками на основе времени, торговля по паттернам на графиках Ренко легче и нагляднее благодаря их чистому виду. KT Renko Patterns включает несколько паттернов Ренко, многие из которых подробно описаны в книге «Профитная торговля с графиками Ренко» авторства Прашанта Шаха. Полностью автоматизированный сове
A tall upper shadow occurs when the price moves during the period, but goes back down, which is a bearish signal. A tall lower shadow forms when bears push the price down, but bulls pull it back up, which leaves a long line or shadow. This is considered a bullish signal. Some technical analysts believe a tall or long shadow means the stock will turn or reverse. Some believe a short or lower shadow means a price rise is coming. In other words, a tall upper shadow means a downturn is coming, while
The indicator allows you to trade binary options. The recommended time frame is М1 and the expiration time is 1,2,3 minutes. The indicator suitable for auto and manual trading. A possible signal is specified as a arrows above/under a candle. You should wait until the candle closes! Arrows are not re-painted Trade sessions: TOKYO section (Half-end) Currency pairs: USD/JPY Working time frame: M1 Expiration time: 1,2,3 minutes. The indicator also shows good results when using the martingale strateg
FREE
Система для визуализации популярных шаблонов ценовых формаций. После подключения индикатор автоматически отобразит на графике следующие формации: Пиноккио бар (“пинбар”)   - свеча с небольшим телом и длинным “носом”, очень известный разворотный шаблон; Внутренний бар   - свеча, диапазон которой лежит внутри диапазона предыдущей свечи. Такая формация представляет неопределённость рынка; Внешний бар   - свеча, диапазон которой превышает диапазон предыдущей свечи. Такая формация представляет неопре
**  All Symbols  x  All Timeframes  scan just by pressing scanner button ** *** Contact me  to send you instruction and add you in "Wolfe Wave Scanner group" for sharing or seeing experiences with other users. Introduction: A Wolfe Wave is created with five-wave patterns in price. It shows supply and demand and a fight towards a balance price. T hese waves of price actions can help traders identify the boundaries of   the trend . Also  It helps forecast how the price will move in the near future
M & W Pattern Pro is an advanced scanner for M and W patters , it uses extra filters to ensure scanned patterns are profitable. The indicator can be used with all symbols and time frames. The indicator is a non repaint indicator with accurate statistics calculations. To use , simply scan the most profitable pair using the statistics dashboard accuracy , then enter trades on signal arrow and exit at the TP and SL levels. STATISTICS : Accuracy 1 : This is the percentage of the times price hits TP
Индикатор AW Candle Patterns является комбинацией из продвинутого трендового индикатора в сочетании с мощным сканером свечных паттернов. Это полезный инструмент для распознания и выделения тридцати наиболее надежных свечных паттернов. Помимо этого это анализатор текущего тренда по окрашенным барам с  подключаемой мультитаймфреймовой трендовой панелью, изменяемой по размеру и положению. Уникальная возможность регулировки отображения паттернов в зависимости от трендовой фильтрации.  Преимущества: 
The Market Profile Indicator for MT4 displays the price levels and zones where increased trading activity happens. These zones with substantial forex trading activity provide the forex traders with the best entry levels, support, and resistance levels. Moreover, price levels indicate the best reversal zones. As a result, forex traders can identify BULLISH and BEARISH market trends and BUY and SELL entry points as well as the best reversal points. The indicator works well in all intraday timefram
TWO PAIRS SQUARE HEDGE METER INDICATOR Try this brilliant 2 pairs square indicator It draws a square wave of the relation between your two inputs symbols when square wave indicates -1 then it is very great opportunity to SELL pair1 and BUY Pair2 when square wave indicates +1 then it is very great opportunity to BUY pair1 and SELL Pair2 the inputs are : 2 pairs of symbols         then index value : i use 20 for M30 charts ( you can try other values : 40/50 for M15 , : 30 for M30 , : 10 for H1 ,
The double top bottom pattern is arguably one of the technical analysis's most popular chart patterns. These patterns are used to capitalize on recurring patterns and identify trend reversal patterns, thereby creating well-placed entry and exit levels. The KT Double Top Bottom is based on these patterns and fine-tunes the trade signal development process for traders. Features It's based on one of the most reliable trading patterns and brings some fine-tuning and automation to the process. Also
Description The Market Profile & Volume Profile Indicator is a powerful technical analysis tool designed to visualize market activity and price distribution over specific timeframes. Unlike standard technical indicators that focus solely on price over time, this indicator organizes price data to show where the market spent the most time (TPO) and where the most volume was traded (Volume Profile). It automatically calculates and displays key structural levels such as the Point of Control (POC) ,
Candle Pattern Finder Candle Pattern Finder is a powerful MT4 indicator designed to help traders easily detect key candlestick patterns in real-time. Whether you're trading trends, reversals, or consolidations, this tool highlights important price action signals directly on the chart — helping you make faster and more confident trading decisions. Detects popular candlestick patterns: Bullish/Bearish Engulfing Hammer & Inverted Hammer Shooting Star & Hanging Man Three White Soldiers Three Black
FREE
Индикатор является мультитаймфреймовой версией индикатора Supply and Demand . Он позволяет анализировать график, используя закон спроса и предложения на трех разных таймфреймах одновременно. Вы сможете увидеть, в каких ценовых зонах происходили покупки и продажи, и определить наиболее выгодные места для открытия позиций. В качестве основы индикатора используется принцип фрактальности рынка. Зоны на графике отображают места, где наличие сильного покупателя либо продавца заставило цену развернутьс
FREE
Уникальная мультивалютная авторская стратегия, одновременно определяющая силу трендов и точки входа в рынок, визуализируя это с помощью гистограмм на графике. Индикатор оптимально адаптирован для торговли на временных периодах М5, М15, М30, Н1. При этом для удобства пользователя по определенной точке всегда появляется точка входа (в виде стрелки), рекомендуемые уровни получения прибыли (TP1, TP2 с текстовыми метками) и рекомендация по установке Стоп Лосс. Уровни получения прибыли (TP1, TP2) авто
VR Cub
Vladimir Pastushak
VR Cub это индикатор что бы получать качественные точки входа. Индикатор разрабатывался с целью облегчить математические расчеты и упростить поиск точек входа в позицию. Торговая стратегия, для которой писался индикатор, уже много лет доказывает свою эффективность. Простота торговой стратегии является ее большим преимуществом, что позволяет успешно торговать по ней даже начинающим трейдерам. VR Cub рассчитывает точки открытия позиций и целевые уровни Take Profit и Stop Loss, что значительно повы
Данный индикатор создан для поиска предполагаемых разворотных точек цены символа. В его работе используется небольшой разворотный свечной паттерн в совокупности с фильтром экстремумов. Индикатор не перерисовывается! В случае отключения фильтра экстремумов, индикатор показывает все точки, в которых есть паттерн. В случае включения фильтра экстремумов, работает условие – если в истории на Previous bars 1 свечей назад, были более высокие свечки и они дальше чем свеча Previous bars 2 – то тогда тако
FREE
True SnD
Indra Lukmana
5 (1)
Этот индикатор спроса и предложения использует уникальный метод определения ценового действия для расчета и измерения зоны спроса и предложения. Индикатор обеспечивает актуальность зон, а также наличие значительных зон низкого риска. Данный индикатор обеспечивает функционал, не доступный ни в одной платформе. Торговая идея Устанавливайте отложенные ордера вдоль зон спроса и предложения. Открывайте сделку, когда цена касается определенной области (после подтверждения отката). Входные параметры
С этим продуктом покупают
Инновационный индикатор, использующий эксклюзивный алгоритм для быстрого и точного определения тренда. Индикатор автоматически рассчитывает время открытия и закрытия позиций, а также подробную статистику работы индикатора на заданном отрезке истории, что позволяет выбрать наилучший торговый инструмент для торговли. Вы также можете подключить свои пользовательские стрелочные индикаторы к Scalper Inside Pro для проверки и расчета их статистики и прибыльности. Инструкция и настройки: Читать... Осно
Сигнал GoldRush Trend Arrow Индикатор GoldRush Trend Arrow Signal предоставляет точный анализ тренда в режиме реального времени, специально разработанный для высокоскоростных краткосрочных скальперов в XAU/USD. Этот инструмент, созданный специально для 1-минутного таймфрейма, отображает стрелки направления для четких точек входа, позволяя скальперам уверенно ориентироваться в волатильных рыночных условиях. Индикатор состоит из ПЕРВИЧНЫХ и ВТОРИЧНЫХ стрелок оповещения. ПЕРВИЧНЫЕ сигналы — это
NAM Divergences
NAM TECH GROUP, CORP.
5 (1)
MT4 Мультитаймфреймовый индикатор дивергенции и обнаружения перекупленности / перепроданности. Функции - Полностью настраиваемая панель управления графиком, обеспечивает полное взаимодействие. - Скрыть и показать панель управления где угодно. - Информация о расхождениях без заглавной буквы в реальном времени. - Информация в реальном времени о ситуациях перекупленности / перепроданности. - Информация о регулярных расхождениях в реальном времени. - Информация о скрытых расхождениях в реа
Индикатор " Dynamic Scalper System " разработан для скальпингового метода торговли внутри трендовых волн. Тестировался на основных валютных парах и золоте, возможна совместимость с другими торговыми инструментами. Дает сигналы для кратковременного открытия позиций по тренду с дополнительным сопровождением движения цены. Принцип действия индикатора. Большие стрелки определяют направление тренда. Внутри трендовых волн действует алгоритм генерации сигналов для скальпинга в виде маленьких стрело
Dynamic Forex28 Navigator — инструмент для торговли на рынке Форекс нового поколения. В НАСТОЯЩЕЕ ВРЕМЯ СКИДКА 49%. Dynamic Forex28 Navigator — это эволюция наших популярных индикаторов, объединяющая мощь трех в одном: Advanced Currency Strength28 Indicator (695 отзывов) + Advanced Currency IMPULSE with ALERT (520 отзывов) + CS28 Combo Signals (бонус). Подробности об индикаторе https://www.mql5.com/en/blogs/post/758844 Что предлагает индикатор Strength нового поколения?  Все, что вам нравило
В настоящее время скидка 40%! Эта приборная панель - очень мощное программное обеспечение, работающее на нескольких символах и до 9 таймфреймов. Он основан на нашем основном индикаторе (Лучшие отзывы: Advanced Supply Demand ).   Приборная панель дает отличный обзор. Она показывает:  Отфильтрованные значения спроса и предложения, включая рейтинг силы зон, расстояния между пунктами в зонах и внутри зон, Выделяются вложенные зоны, Выдает 4 вида предупреждений для выбранных символов на всех (9) та
Super Signal – Skyblade Edition Профессиональная система трендовых сигналов без перерисовки и без задержек с исключительным процентом выигрышей | Для MT4 / MT5 Лучше всего работает на младших таймфреймах, таких как 1 минута, 5 минут и 15 минут. Основные характеристики: Super Signal – Skyblade Edition — это интеллектуальная система сигналов, специально разработанная для трендовой торговли. Она использует многоуровневую фильтрацию, чтобы выявлять только сильные направленные движения, подкреплённ
Route Lines Prices - индикатор разработанный для поиска направлений цены. Простой интерфейс индикатора содержит в себе множество алгоритмов поведения цены и расчет будущих направлений. В алгоритмах содержатся расчеты волатильности и сглаживание цены в соответствии с используемыми тайм-фреймами. Индикатор имеет единственный параметр для изменения значений " Calculating price values ". Значение по умолчанию 1 имеет сбалансированную автоматическую форму расчетов, которой можно пользоваться без с
Volatility Trend System - торговая система дающая сигналы для входов.  Система волатильности дает линейные и точечные сигналы в направлении тренда, а также сигналы выхода из него, без перерисовки и запаздываний. Трендовый индикатор следит за направлением среднесрочной тенденции, показывает направление и ее изменение. Сигнальный индикатор основан на изменении волатильности, показывает входы в рынок. Индикатор снабжен несколькими типами оповещений. Может применяться к различным торговым инструмен
Большинство стрелочных индикаторов дают вам сигнал и оставляют разбираться со всем остальным самостоятельно. KT Alpha Hunter Arrows дает вам полноценный торговый план. Каждая сигнальная стрелка появляется вместе с уже готовым планом: линия входа, стоп-лосс, четыре уровня тейк-профита и живой вердикт по преимуществу, который показывает, стоит ли сейчас торговать этот символ и таймфрейм. В комплект входит Trade Manager EA, который берет на себя сопровождение сделки после входа, чтобы дисциплина со
В НАСТОЯЩЕЕ ВРЕМЯ СКИДКА 20%! Лучшее решение для новичка или трейдера-эксперта! Этот индикатор специализирован для отображения силы валюты для любых символов, таких как экзотические пары, товары, индексы или фьючерсы. Впервые в своем роде, любой символ может быть добавлен в 9-ю строку, чтобы показать истинную силу валюты золота, серебра, нефти, DAX, US30, MXN, TRY, CNH и т.д. Это уникальный, высококачественный и доступный торговый инструмент, потому что мы включили в него ряд собственных функци
Прежде всего стоит подчеркнуть, что этот Торговый Инструмент является Неперерисовывающимся Нерепейнтинговым Индикатором, что делает его идеальным для профессиональной торговли. Онлайн-курс, руководство пользователя и демонстрация. Индикатор Концепций Умного Действия Цены - очень мощный инструмент как для новичков, так и для опытных трейдеров. Он объединяет более 20 полезных индикаторов в одном, комбинируя передовые торговые идеи, такие как анализ Inner Circle Trader и стратегии торговли концеп
BTMM State Engine Pro is a MetaTrader 4 indicator for traders who use the Beat The Market Maker approach: Asian session context, kill zone timing, level progression, peak formation detection, and a multi-pair scanner from a single chart. It combines cycle state logic with a built-in scanner dashboard so you do not need the same tool on many charts at once. What it does Draws the Asian session range; session times can follow broker server offset or be set in inputs. Tracks level progression (L
Индикатор поддержки и сопротивления для бинарных опционов Этот индикатор разработан специально для торговли бинарными опционами и отлично показывает откаты от уровней поддержки и сопротивления. Сигналы появляются на текущей свече. Красная стрелка, направленная вниз, указывает на потенциальную возможность продажи, а синяя стрелка, направленная вверх, предлагает возможности для покупки. Все, что вам нужно настроить, это цвет сигнальных стрелок. Рекомендуется использовать его на таймфреймах M1-M5,
Индикатор Miraculous – 100% ненарисовывающийся инструмент для Форекс и бинарных опционов, основанный на Квадрате Девяти Ганна Это видео представляет индикатор Miraculous – высокоточный и мощный торговый инструмент, специально разработанный для трейдеров Форекс и бинарных опционов. Что делает этот индикатор уникальным, так это его основа на легендарном Квадрате Девяти Ганна и Законе вибрации Ганна , что делает его одним из самых точных инструментов прогнозирования, доступных в современном трейдин
Представляем       Quantum Breakout PRO   , новаторский индикатор MQL5, который меняет ваш способ торговли в зонах прорыва! Разработанная командой опытных трейдеров с опытом торговли более 13 лет,   Quantum Breakout PRO   предназначена для того, чтобы вывести ваше торговое путешествие на новые высоты благодаря своей инновационной и динамичной стратегии зон прорыва. Quantum Breakout Indicator покажет вам сигнальные стрелки на зонах прорыва с 5 целевыми зонами прибыли и предложением стоп-лосса
SYSTEM INTRODUCTION:   The Binary Options Channels System Is Specifically Designed For Binary Options Trading. Unlike Other Systems And Indicators That Were Adopted From Other Trading Environments For Binary Options. Little Wonder Why Many Of Such Systems Fail To Make Money . Many End Up Loosing Money For Their Users.  A Very Important Fact That Must Be Noted Is The Fact That Application Of Martingale Is not Required. Thus Making It Safer For Traders Usage And Profitability. A Trader Can Use Fi
Представляем ON Trade Waves Patterns Harmonic Elliot Wolfe, передовой индикатор, разработанный для обнаружения разнообразных рыночных паттернов с использованием как ручных, так и автоматизированных методов. Вот как это работает: Гармонические паттерны: Этот индикатор может определять гармонические паттерны, появляющиеся на вашем графике. Эти паттерны важны для трейдеров, практикующих теорию гармонической торговли, как это описано в книге Скотта Карни "Гармоническая Торговля том 1 и 2". Независи
GOLD Impulse with Alert
Bernhard Schweigert
4.67 (12)
Этот индикатор является супер комбинацией двух наших продуктов Advanced Currency IMPULSE with ALERT  +   Currency Strength Exotics . Он работает на всех временных рамках и графически показывает импульс силы или слабости для 8 основных валют плюс один символ! Этот индикатор специализирован для отображения ускорения силы валюты для любых символов, таких как золото, экзотические пары, товары, индексы или фьючерсы. Первый в своем роде, любой символ может быть добавлен в 9-ю строку, чтобы показат
Precautions for subscribing to indicator This indicator only supports the computer version of MT4 Does not support MT5, mobile phones, tablets The indicator only shows the day's entry arrow The previous history arrow will not be displayed (Live broadcast is for demonstration) The indicator is a trading aid Is not a EA automatic trading No copy trading function The indicator only indicates the entry position No exit (target profit)  The entry stop loss point is set at 30-50 PIPS Or the front hi
Индикатор точно показывает точки разворота и зоны возврата цены, где входят крупные игроки . Вы видите, где формируется новый тренд, и принимаете решения с максимальной точностью, держа контроль над каждой сделкой. VERSION MT5     -     Раскрывает свой максимальный потенциал в связке с индикатором  TREND LINES PRO Что показывает индикатор: Разворотные конструкции и разворотные уровни с активацией в начале нового тренда. Отображение уровней  TAKE PROFIT  и  STOP LOSS  с минимальным соотношением
Quantum Momentum Guard (QMG) Advanced Breakout & Momentum Indicator for MetaTrader 4 Quantum Momentum Guard (QMG) is a next-generation MetaTrader 4 trading indicator designed to identify high-probability breakout opportunities using a powerful combination of advanced momentum analysis and high-level mathematical calculations . Unlike ordinary indicators that generate signals based on a single condition, QMG confirms every breakout with momentum strength and mathematical validation , ensuring
В настоящее время скидка 40%! Лучшее решение для новичка или трейдера-эксперта! Эта приборная панель работает на 28 валютных парах. Он основан на 2 наших основных индикаторах (Advanced Currency Strength 28 и Advanced Currency Impulse). Он дает отличный обзор всего рынка Forex. Он показывает значения Advanced Currency Strength, скорость движения валюты и сигналы для 28 пар Forex на всех (9) таймфреймах. Представьте, как улучшится ваша торговля, когда вы сможете наблюдать за всем рынком с помощ
TREND LINES PRO помогает понять, где рынок действительно меняет направление. Индикатор показывает реальные развороты тренда и места, где крупные участники входят повторно. Вы видите BOS-линии смены тренда и ключевые уровни старших таймфреймов — без сложных настроек и лишнего шума. Сигналы не перерисовываются и остаются на графике после закрытия бара. VERSION MT 5     -     Раскрывает свой максимальный потенциал в связке с индикатором  RFI LEVELS PRO Что показывает индикатор: Реальные смены   тр
CRT Multi-Timeframe Market Structure & Liquidity Sweep Indicator Non-Repainting | Multi-Asset | MT5 Version Available MT5 Version:   https://www.mql5.com/en/market/product/162075 Full User Guide — explains what each feature does and why:   https://www.mql5.com/en/blogs/post/767525 Quick Start User Guide  — explains how to configure and in what order:  https://www.mql5.com/en/blogs/post/767540 Indicator Overview CRT Ghost Candle HTF Fractal is a complete institutional-grade market structure too
Cycle Sniper
Elmira Memish
4.39 (36)
Please contact us after your purchase and we will send you the complimentary indicators to complete the system Cycle Sniper is not a holy grail but when you use it in a system which is explained in the videos, you will feel the difference. If you are not willing to focus on the charts designed with Cycle Sniper and other free tools we provide, we recommend not buying this indicator. We recommend watching the videos about the indiactor and system before purchasing. Videos, settings  and descri
Linear Trend Predictor - Трендовый индикатор сочетающий в себе точки для входа и линии поддержки направления. Работает по принципу пробития ценового канала High/Low. Алгоритм индикатора фильтрует рыночный шум, учитывает волатильность и рыночную динамику. Возможности индикатора Методами сглаживания показывает рыночную тенденцию и точки входа для открытия ордеров BUY или SELL. Подходит для определения краткосрочных и долгосрочных движений рынка, анализируя графики на любых таймфреймах. Адаптивн
Pulse Scalping Line - индикатор для выявления потенциальных точек разворота. На базе этого индикатора можно построить эффективную систему Мартингейл. По нашей статистике индикатор дает максимум 4 ошибочных точки разворота в серии. В среднем это 2 точки разворота. То есть, индикатор показывает разворот, он ошибочный. Значит второй сигнал индикатора будет с высокой вероятностью точный. Основываясь на данной информации можно построить торговую систему по принципу Мартингейл. Чтобы этот Мартингейл б
El indicador "MR BEAST ALERTAS DE LIQUIDEZ" es una herramienta avanzada diseñada para proporcionar señales y alertas sobre la liquidez del mercado basándose en una serie de indicadores técnicos y análisis de tendencias. Ideal para traders que buscan oportunidades de trading en función de la dinámica de precios y los niveles de volatilidad, este indicador ofrece una visualización clara y detallada en la ventana del gráfico de MetaTrader. Características Principales: Canal ATR Adaptativo: Calcula
Meravith
Ivan Stefanov
5 (3)
Инструмент маркет-мейкеров. Meravith будет: Анализировать все таймфреймы и отображать текущий действующий тренд. Выделять зоны ликвидности (объёмное равновесие), где бычий и медвежий объём равны. Показывать все уровни ликвидности с разных таймфреймов прямо на вашем графике. Генерировать и отображать текстовый анализ рынка для вашего ориентирования. Рассчитывать цели, уровни поддержки и стоп-лосс в соответствии с текущим трендом. Вычислять соотношение риск/прибыль для ваших сделок. Определять раз
Другие продукты этого автора
Trend Duration Forecast It utilizes a Hull Moving Average (HMA) to detect trend direction and statistically forecasts the probable duration of the current move based on historical market behavior. Key Features Smooth Trend Detection:   Uses the Hull Moving Average (HMA) to filter noise while minimizing lag, providing clean Bullish/Bearish signals. Real-Time Duration Counter:   Displays a dynamic label at the start of the current trend showing the   "Real Length"   (number of bars the trend has b
FREE
The Range Filter Buy and Sell indicator is a trend-following technical analysis tool designed to identify optimal entry and exit points in the market. It filters out market noise by creating dynamic bands around price movements, generating clear buy and sell signals when price breaks through these bands. Key Features Dynamic Range Filtering : Uses a sophisticated algorithm to calculate adaptive bands that adjust to market volatility Trend Identification : Clearly visualizes the current trend dir
FREE
Strong Bull V7 B&C  The ultimate M5 indicator for Boom & Crash indices, providing clear, filtered buy/sell signals to eliminate market noise and enhance your trading precision. Benefit-Focused Master the volatile Boom & Crash markets with Strong Bull V7 B&C . This intelligent indicator provides clear visual arrows and text labels for high-probability setups on the M5 timeframe. Its unique symbol-filtering technology automatically hides conflicting signals (no buys on Crash, no sells on Boom), en
Fractals_Price Indicator Description The Fractals_Price indicator is a technical analysis tool that identifies fractal patterns on price charts. Fractals are recurring patterns that signal potential trend reversals or continuation points. This indicator marks both upward and downward fractals with colored arrows and can display price labels at these points. Key Features  Identifies upward fractals (magenta arrows) marking potential resistance levels Identifies downward fractals (blue arrows)
Auto Analysis
Israr Hussain Shah
5 (1)
FiboPivot TrendLines - Comprehensive Market Analysis Indicator This powerful indicator combines Fibonacci pivot point analysis with automatic trend line detection, providing traders with a complete technical analysis toolkit in a single tool. Key Features : - Fibonacci Pivot Points: Automatically calculates and displays R1-R3, Pivot, and S1-S3 levels using previous day's data - Fractal-Based Trend Lines: Automatically draws channel trend lines based on fractal patterns - Interactive
FREE
boom Spike Mitigation Zone Pro A professional spike pattern indicator built for synthetic traders who scalp and swing Boom 500/300/1000/600/900with precision.  This indicator: Detects powerful 3-candle spike formations (Spike → Pullback → Spike) Automatically draws a clean box around the pattern Marks the entry price from the middle candle Extends a horizontal mitigation line to guide perfect sniper entries Automatically deletes & redraws the line once price touches it (mitiga
FREE
Crash Spike Mitigation Zone Pro A professional spike pattern indicator built for synthetic traders who scalp and swing Crash 500/300/1000 with precision.  This indicator: Detects powerful 3-candle spike formations (Spike → Pullback → Spike) Automatically draws a clean box around the pattern Marks the entry price from the middle candle Extends a horizontal mitigation line to guide perfect sniper entries Automatically deletes & redraws the line once price touches it (mitigation)
FREE
1. Tool Description The   Dynamic Liquidity HeatMap Profile   is an advanced technical indicator . Unlike a standard Volume Profile which shows where volume   has   occurred, this tool attempts to visualize where liquidity (limit orders and stop losses) is   likely waiting   (resting liquidity). It works by identifying pivots (local highs and lows) weighted by volume and ATR.   Crucially, if price moves through a level, that liquidity is considered "swept" or "taken" and is removed from the map.
Smart Trend pro New - Advanced Trend Indicator with Interactive GUI Professional trend-following indicator with comprehensive visualization and control panel Key Features: Advanced Trend Detection Reliable Half Trend algorithm for precise trend identification Color-coded trend lines (Blue for bullish, Orange for bearish) Customizable amplitude parameter for different trading styles Interactive GUI Panel Real-time market strength visualization (Bulls vs Bears) Current signal display (Buy/Se
FREE
Major Swing Fibonacci Indicator - Professional Trading Tool What It Does Automatically detects major swing points not internal noise Generates buy/sell signals at key Fibonacci levels Displays professional GUI panel with real-time analysis Marks major swings with visual indicators Trading Strategy BUY at 38.2%-61.8% Fibonacci support in uptrends SELL  Past performance is not indicative of future results. This indicator is for educational and informational purposes only and does not constitute in
FREE
Big bull scalper Short Description Master market structure with the precision of the popular Big bull scalper  This tool automatically identifies key pivot highs and lows, plotting unique "angling" trend lines that dynamically define market context. It visually confirms Breaks of Structure (BOS) and Changes of Character (CHoCH), removing all guesswork from your analysis. Key Features:    Automatic Pivot Detection Instantly spots significant swing highs and lows.    Dynamic Angling Lines Visual
FREE
Description The Market Profile & Volume Profile Indicator is a powerful technical analysis tool designed to visualize market activity and price distribution over specific timeframes. Unlike standard technical indicators that focus solely on price over time, this indicator organizes price data to show where the market spent the most time (TPO) and where the most volume was traded (Volume Profile). It automatically calculates and displays key structural levels such as the Point of Control (POC) ,
super trend version is to help you to have real time view of market move it will help you to get a live view of current market  buy signal line and arrow to help you understand batter the direction sell signal line and arrow to help you understand batter the direction trade what you see not what you think this is an simple and best trading tool for our traders of any market crypto gold 
FREE
2025 Spike Killer Dashboard - Advanced Trading Signals & Market Analytics Transform Your Trading with Intelligent Market Insights! The 2025 Spike Killer Dashboard is a powerful MQL5 indicator that combines cutting-edge signal generation with an intuitive crystal dashboard for real-time market analysis. Designed for traders who demand precision and clarity, this all-in-one tool delivers actionable signals and comprehensive market metrics at a glance. Key Features: Dual Signal System Shved S
FiboPivot Dashboard - Professional Pivot Point Indicator What It Does FiboPivot Dashboard is a powerful technical analysis tool that automatically calculates and displays Fibonacci-based pivot points on your chart. It identifies key support and resistance levels based on the previous day's price action, helping traders anticipate potential price reversal points and breakout levels.   How to Use 1. **Install & Apply**: Simply attach the indicator to any chart (time frames below D1) 2. **
FREE
Trade Manger
Israr Hussain Shah
You Give an Instruction: When you run the script, a window pops up with a dropdown menu. You choose exactly what you want it to do from the list (e.g., "Close Profit Only" or "Delete Pending Orders"). It Scans Your Positions: The script then reads your instruction and systematically goes through your open trades and/or pending orders on the current chart. It Applies Your Rule: For each trade it finds, it checks if it matches the rule you selected. If you chose "Close Buy Only," it will only clo
Market Profile with Dashboard Indicator - Complete User Guide indicator Overview The Market Profile with Dashboard is a comprehensive trading analysis tool for MetaTrader 4 that displays market profile data, volume analysis, and key market structure information directly on your chart. This indicator helps traders identify significant price levels, market balance areas, and potential trading opportunities based on market profile theory. Core Components and Features Market Profile Display - Sh
Spike Blaster Pro – The Ultimate Spike Detection Tool Spike Blaster Pro is a next-generation MT5 indicator designed specifically for synthetic markets. It works seamlessly on Boom Index and Weltrade Index , providing traders with sharp, reliable spike detection signals. What makes Spike Blaster Pro powerful is its 5 Core Strategies built into one system, giving traders a multi-layer confirmation before signals appear. This ensures high accuracy and reduces false alerts. 5 Core Strategies B
Trading Guide MT5 Indicator - Ultimate Trading Psychology Assistant Description The Trading Guide MT5 Indicator is a powerful psychological trading assistant designed to keep traders disciplined, focused, and emotionally balanced. This innovative indicator displays real-time motivational messages, trading rules, and analysis guidelines directly on your chart, with vibrant blinking colors to capture your attention and reinforce proper trading habits.  Key Features Real-Time Trading Psychology
FREE
Liquidity Channels Pro  MT5 VERSION HERE   Liquidity Channels  is a sophisticated Smart Money Concepts (SMC) tool designed to automate the identification of     Buy Side Liquidity (BSL)   and     Sell Side Liquidity (SSL) . Unlike standard support and resistance indicators, this tool doesn't just draw lines; it projects     dynamic expanding channels   based on volatility (ATR) from key pivot points. Crucially, it follows the "Mitigation" logic used by institutional traders:     once liquidity i
How to Use the Features       MT5 VERSION   TRADE COPIER Select Role: On the account sending trades, choose Sender (Master Account) . On the account receiving trades, choose Copier (Receiver Account) . Lot Size Mode: Same Lot Size as Master: Ignores multipliers, copies exactly what the Master has. Multiply Master Lot Size: Uses the "Lot Multiplier" field (e.g., Master 0.10, Multiplier 2.0 = Copier 0.20). Use Fixed Lot Size: Ignores Master's volume entirely, uses the "Fixed Lot Size" field for ev
A Smart Price Imbalance Tool with Arrows, Labels, and FVG Zones The Fair Value Gap (FVG) Indicator is designed to automatically detect price imbalance zones on the chart – a widely used concept in Smart Money Concepts (SMC) and Institutional Trading Models (ICT) . These gaps, also known as imbalances or inefficiencies , often highlight areas where price may return to "rebalance" liquidity. Many professional traders consider these levels as high-probability zones for potential reversals, retrace
Smart Risk Manager – Risk/Reward Ratio & Position Sizing Tool for MT5 Overview (Short Description) A professional risk management indicator that helps traders calculate lot size, risk percentage, and reward ratio in real time. Perfect for Forex, Indices, Gold, and Synthetic Indices traders who want precise control over their capital. Full Description Trading without proper risk management is like driving without brakes. The Smart Risk Manager for MT5 gives you full control over your position siz
Bollinger Fibo Pro: The Ultimate Fusion of Volatility, Fibonacci, and Trend Analysis Short Description: Stop overloading your charts with dozens of indicators.   Bollinger Fibo  Pro   is a sophisticated, all-in-one trading system for MetaTrader 5 that merges two legendary concepts into a single, powerful tool. It enhances standard Bollinger Bands with precise Fibonacci extension levels and couples them with a non-repainting ZigZag to accurately identify trends, reversals, and key market structu
11 Modules Description & Final Analyzer Trading Guide 1. Reaction Engine 2.0 Purpose : Measures market pressure by analyzing tick movements, volume, and speed within a time window.   How it works : Calculates weighted price changes, considers tick velocity and volatility, and applies EMA smoothing.   Trading use : Strong positive values indicate buying pressure Strong negative values indicate selling pressure Use as confirmation for entry/exit signals 2. Flow Pattern Detector Purpose : Identifie
Color schemes
Israr Hussain Shah
Colors schemes powerful MetaTrader 5 script designed for traders who value speed and a personalized trading environment. With a single click, you can instantly transform your chart's appearance using one of several professional, pre-designed color schemes, including popular styles like ICT/SMC. How to Use: In your MetaTrader 5 terminal, open the Navigator window (Ctrl+N). Find the Colors schemes script under the "Scripts" section. Drag and drop the script onto the chart you want to customize. A
The   Trend Analysis Dashboard   is a powerful, all-in-one technical analysis tool designed for traders who need a clear, consolidated view of market momentum across multiple timeframes. Instead of cluttering your chart with numerous separate indicators, this tool aggregates signals from four key oscillators (Stochastic, RSI, and dual CCI) into a single, easy-to-read panel. It calculates the directional bias (Buy, Sell, or Neutral) for each enabled timeframe and provides a visual summary of over
How the Chart Cleaner Script Works The Chart Cleaner is a one-click tool designed to instantly wipe your chart clean. When you drag and drop the script onto a chart, it scans for and removes all visual objects—including trend lines, horizontal lines, text labels, shapes, and any other drawings you have placed. The result is a completely clean, uncluttered chart, giving you a fresh workspace for your analysis. It's the fastest way to reset your chart to its default state.
Comprehensive Trading Analysis Tool This tool has four main parts that help traders understand the market and manage risk in a simple way 1 Risk and Reward Visual Tool It shows two boxes on the chart a pink box for risk and a navy blue box for reward It shows the risk to reward ratio You can move and resize the boxes It shows pips and possible money for risk and reward It gives a clear picture of possible profit and loss It helps plan trades before entering It keeps risk levels consistent It hel
What It Does Finds Order Blocks (ANN + SMC) on big and small timeframes. Marks them with clean bullish/bearish zones. Drops arrows (blue = BUY, red = SELL) right inside each block. Shows an info panel on the right with the exact high/low of the newest blocks. Lets you change chart colors (background, bull candle, bear candle) instantly. How To Use It Drop the indicator into MQL5/Indicators → restart MT5. Add it to your chart. In the settings: Pick your background , bull candle , and bear candle
Фильтр:
Нет отзывов
Ответ на отзыв