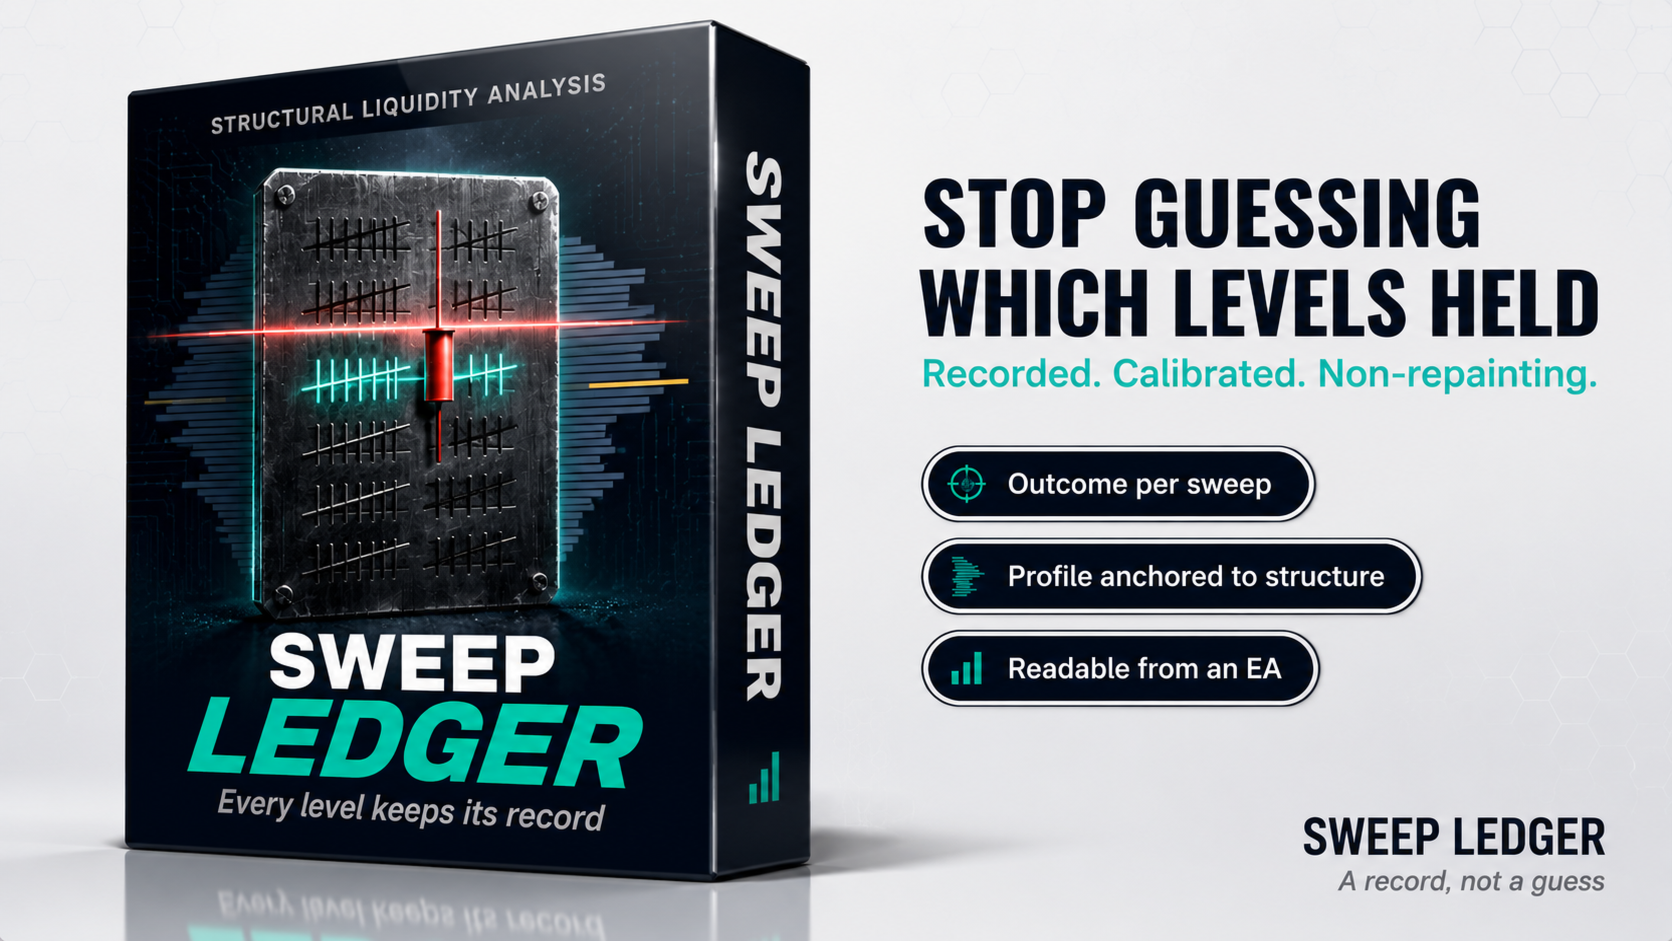
Sweep Ledger

Most liquidity tools draw a level and leave you to guess whether it mattered.
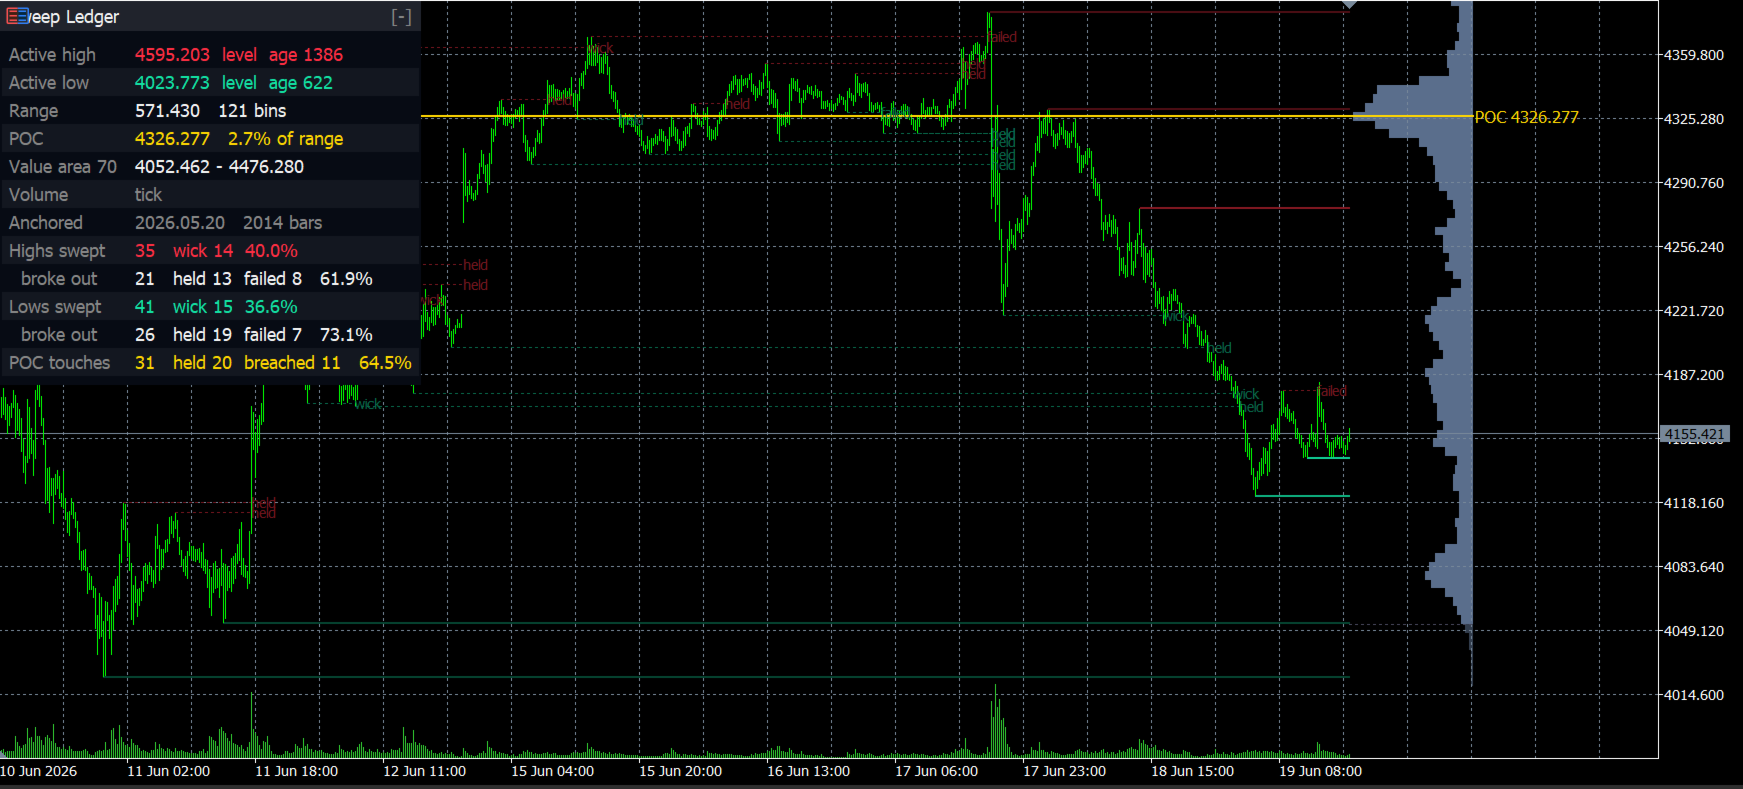
Sweep Ledger keeps a record. Every structural high and low it draws carries an
outcome: whether price only wicked through it, or actually closed beyond it, and
whether that breakout was still holding a fixed number of bars later. The running
tally sits on the panel, so you can see how levels on this symbol and this
timeframe have actually behaved before you commit to the next one.


What Gets Recorded

A level is created only after a swing high or low is confirmed by a fixed number
of bars on both sides, so it cannot appear retroactively. From then on it is
tracked until something happens to it, and the result is written once and never
revised.

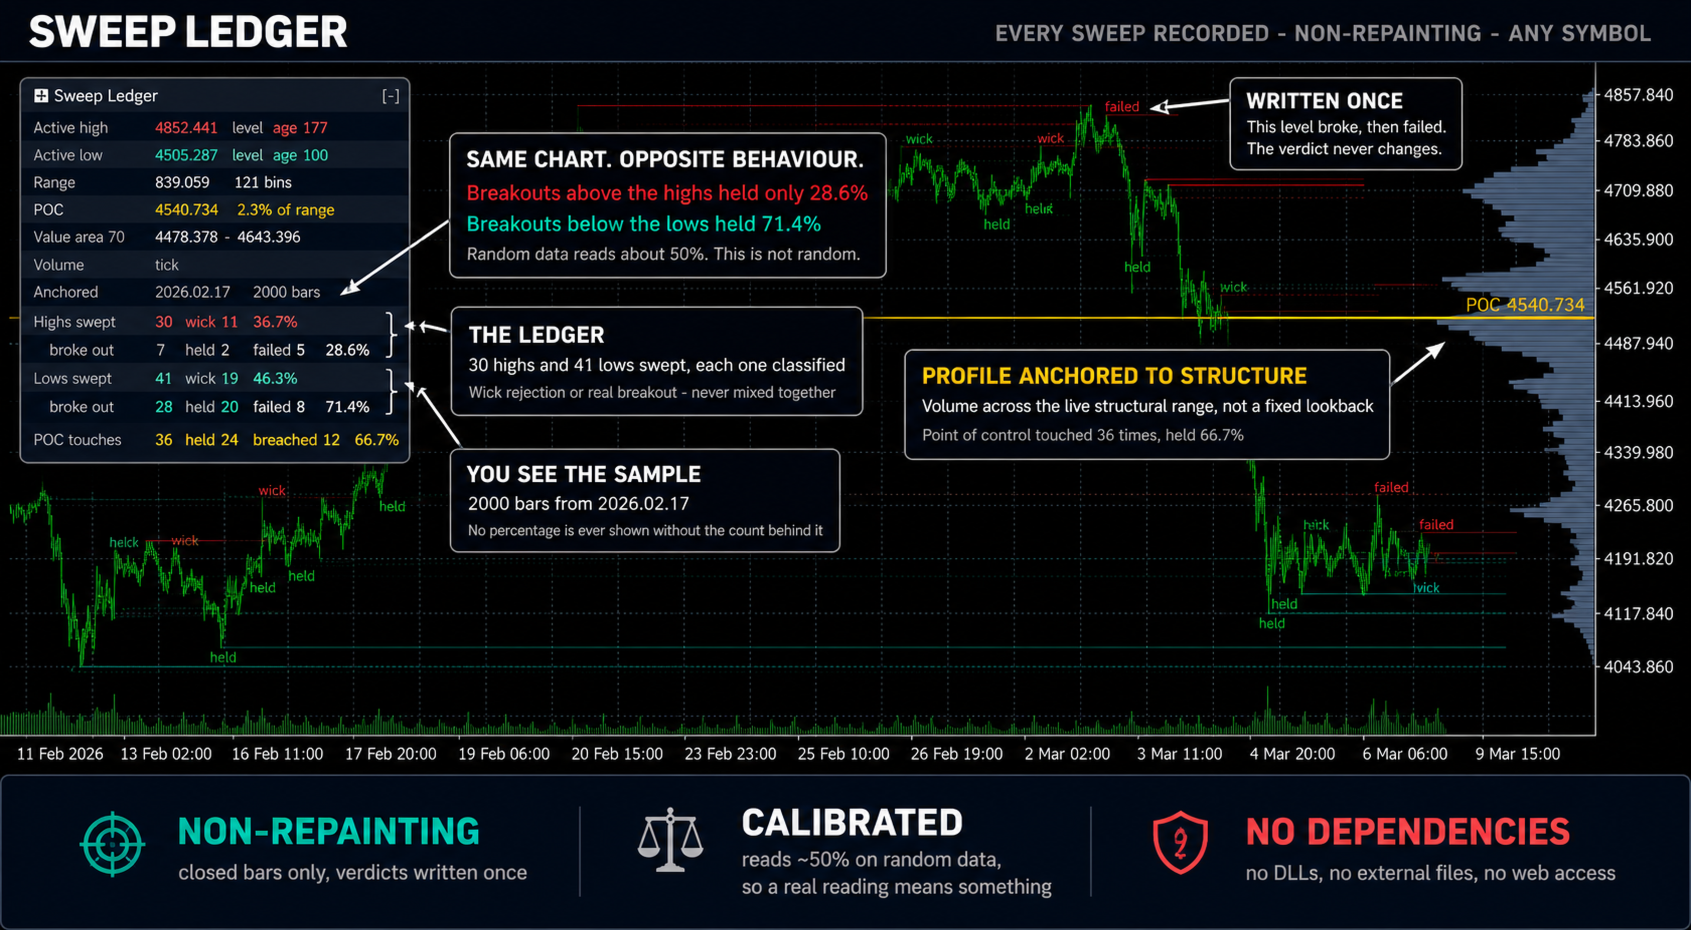
Wick. Price pushed past the level intrabar but the bar closed back inside.
Breakout. The bar closed beyond the level, which starts a fixed verdict horizon.
Held. At the end of that horizon price was still beyond the level.
Failed. By the end of the horizon price was back inside.
Untouched. The level was never reached while it existed.

The panel shows the counts and the rates per side, for highs and lows separately.
A breakout whose horizon has not elapsed is counted as pending and is excluded
from the rates, so a decided outcome is never mixed with an undecided one.


The Statistics Are Calibrated, Not Just Computed

Any rule that scores two outcomes can be built so that one of them is easier to
reach, and it will then report an impressive number that means nothing. The
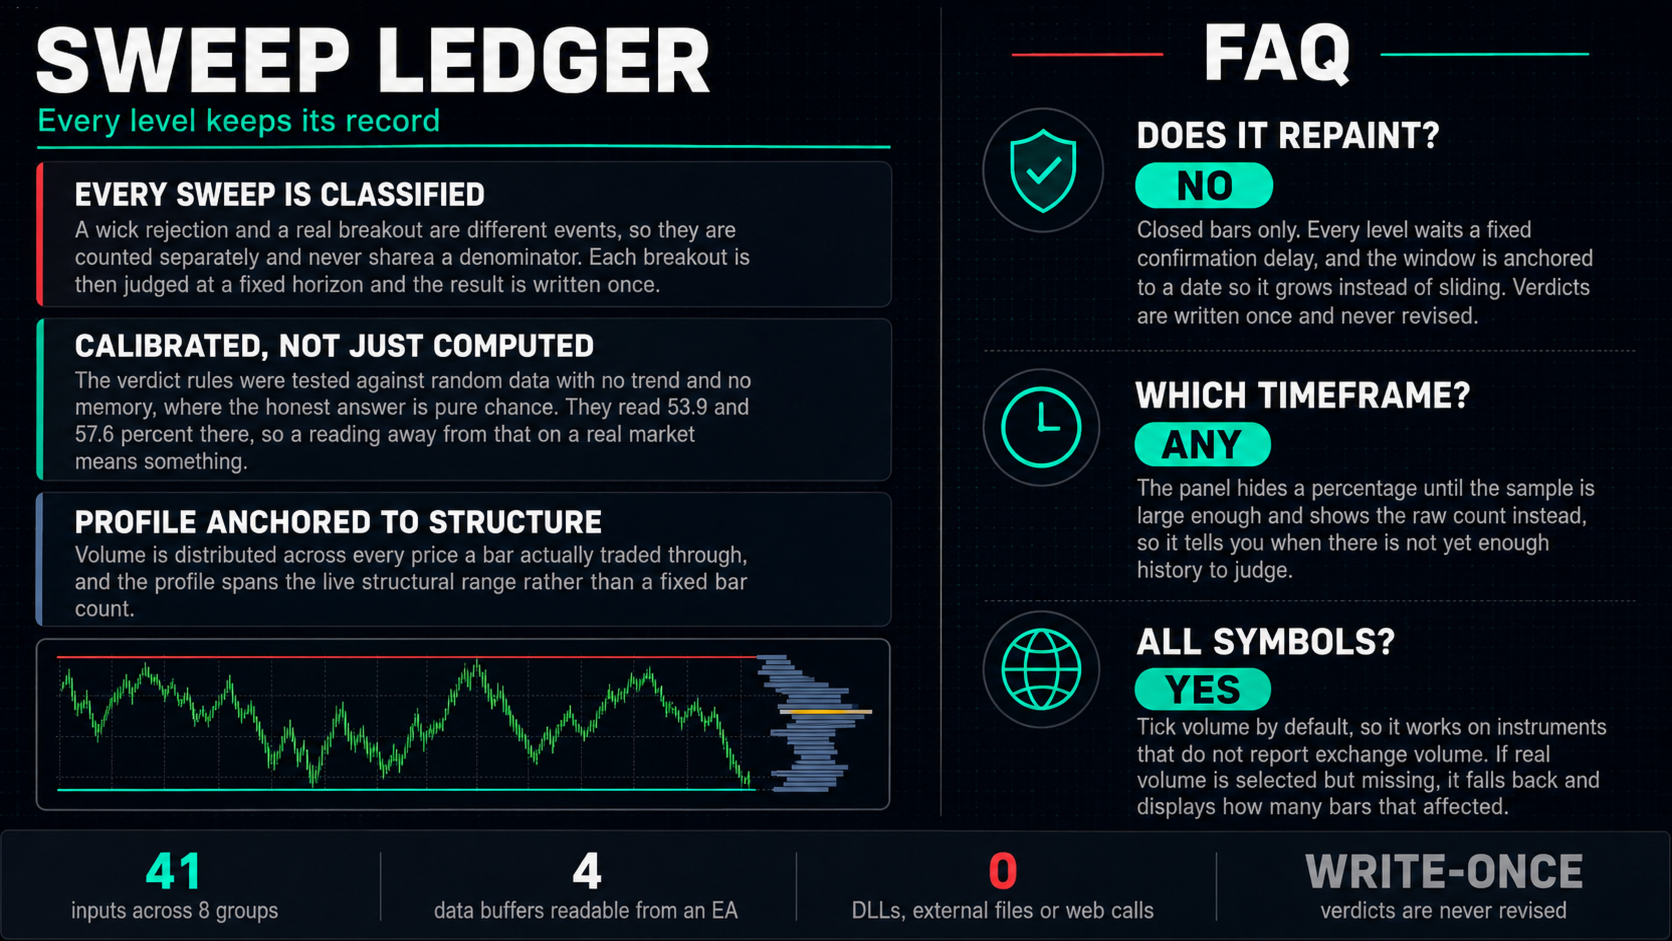
verdict rules here were checked against synthetic random data with no trend and
no memory, where the honest answer is close to a coin flip. The follow-through
rate reads 53.9 percent on that data and the point of control hold rate reads
57.6 percent, both close enough to neutral that a reading away from those levels
on a real market carries information.

Two consequences you can see in the product. First, wick rejections and breakouts
are counted separately and never share a denominator, because they are different
events. Second, a percentage is withheld entirely until the sample is large
enough, and the raw count is shown instead. A rate computed from a handful of
samples is indistinguishable from chance, and showing it as a percentage would
invite you to trade on noise.


Structural Volume Profile

The profile is built between the currently active structural high and low rather
than over a fixed bar count, so it describes the range the market is actually
working in. Each bar of volume is distributed across every price bin its range
covers, weighted by overlap, instead of being dumped into the bin holding its
close, which would invent a volume spike at the close of every wide bar.

The point of control and the value area are derived from that profile and drawn
to the right of price. Point of control touches get their own small ledger, with
the level frozen at the moment of the touch so the recorded outcome cannot drift
as the profile keeps filling.

If a symbol reports no real volume while the real volume source is selected, the
indicator falls back to tick volume, counts how many bars that affected, and
displays the count. A core feature that degrades silently is worse than one that
says so.


Non-Repainting, And Why

Three things enforce it rather than one claim asserting it.

Only closed bars are processed. The bar in progress never contributes to a level,
a sweep, a verdict or a volume bin.

Every level waits for confirmation. A swing is only knowable a fixed number of
bars after it happened, so a level cannot be inserted into the past.

The calculation window is anchored to a date rather than to a bar count. A
window measured backwards from the newest bar slides forward every time a bar
closes, which moves where the calculation began and can therefore change what it
concluded about history. Here the start is pinned for as long as the indicator
stays on the chart, so the window only ever grows and nothing already decided
moves under you. Re-attaching it re-anchors on purpose, so that asking for one
month gives you the most recent month rather than one that ended weeks ago, and
the panel always prints the anchor date and the bar count so you know exactly
what the totals cover. If the chart has not downloaded enough history to give you
the window you asked for, the panel says so rather than quietly handing you a
shorter one.

Underneath all of that, a level is judged only by the bars around it. Its verdict
does not depend on where the window began, so a mark on your chart means the same
thing no matter when you loaded it.


Panel

The panel is draggable and collapsible, and it remembers its position and state
per chart across timeframe changes. Layout is measured from the actual rendered
text rather than assumed, so it stays correct at any font size and on any display
scaling. Every figure on it is counted from the current calculation, never from
whether something initialised successfully.


Alerts

Three independent alerts, each switched separately, and each routable to popup,
push notification or email: a level being swept, a verdict being written, and a
point of control touch resolving. Alerts fire on closed bars only.

Email alerts are sent by the terminal, not by the indicator, so they require
MT5 - Tools - Options - Email to be configured first. Popup and push need no
setup.


Reading It From An Expert Advisor

Four data buffers are exposed through iCustom: the active structural high, the
active structural low, the point of control of the current profile, and the net
count of sweeps on each bar, positive when highs were swept and negative when
lows were. All four draw nothing on the chart.


Parameters

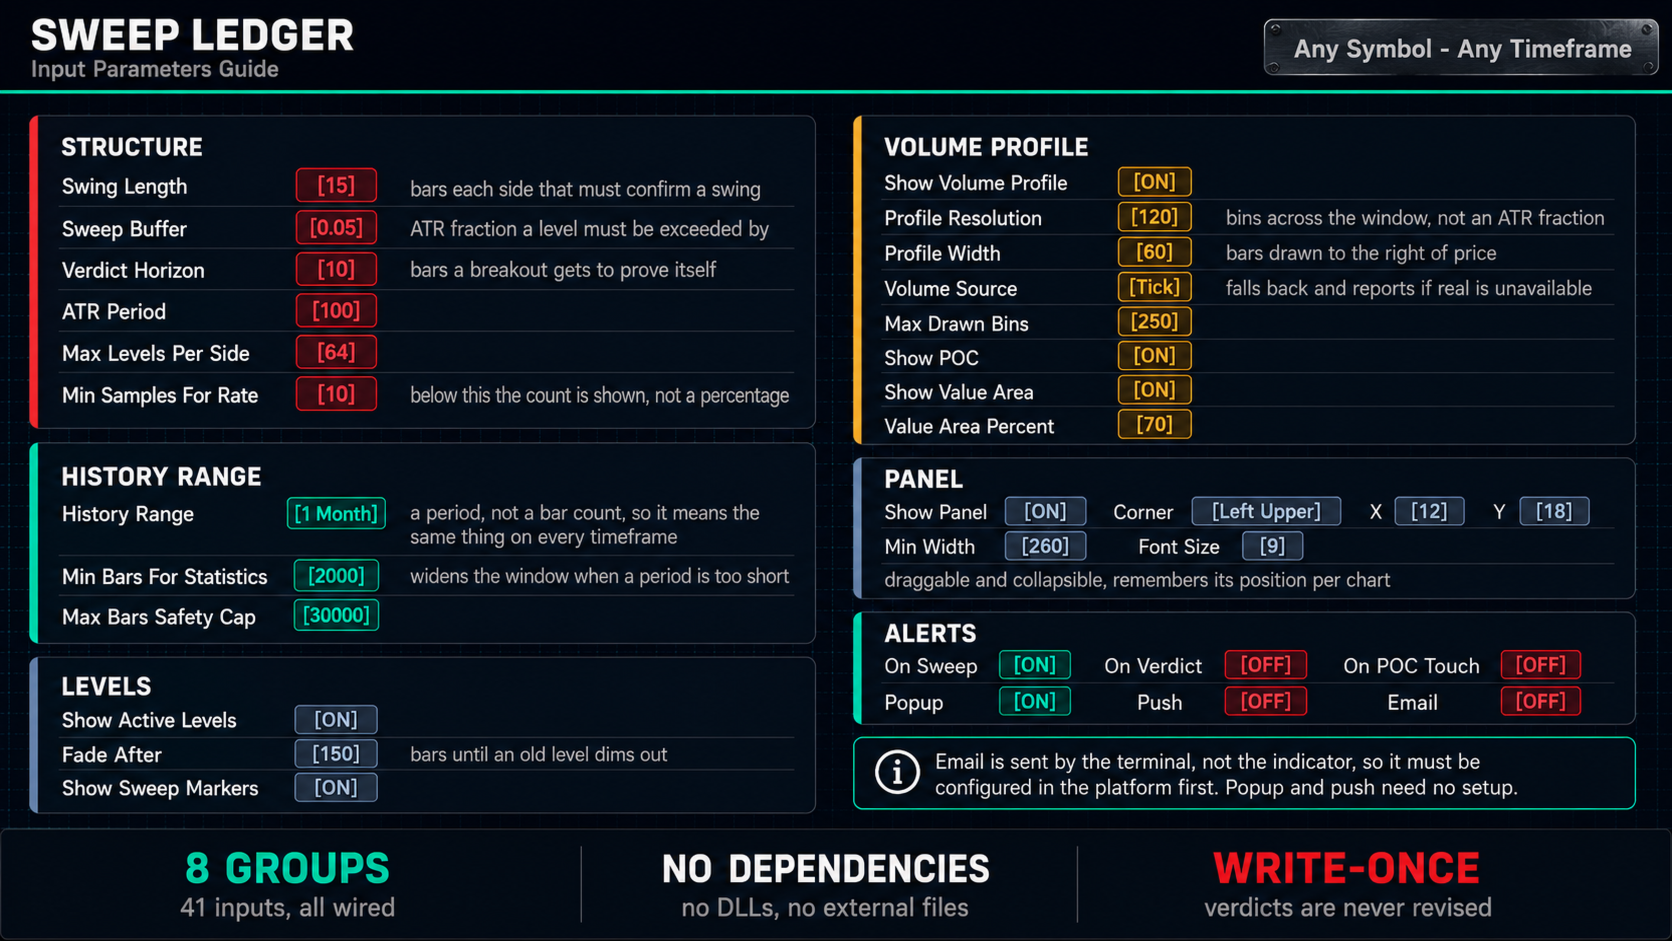
41 inputs in 8 groups. The defaults below are a working starting point.

Structure. Swing Length 15 bars each side, Sweep Buffer 0.05 ATR, Verdict Horizon
10 bars, ATR Period 100, Max Levels Kept Per Side 64, Min Samples Before Showing
Rate 10.

History Range. Range as a period rather than a bar count - 3 Days, 7 Days,
15 Days, 1 Month, 3 Months or All - because a fixed bar count means a completely
different span on M1 than on H4. Min Bars Regardless Of Range 2000, which widens
the window on the higher timeframes, where a month holds 504 bars of H1 and 30 of
D1 - far too few for any rate to clear its sample floor. Max Bars Safety Cap
30000.

Volume Profile. Profile Resolution 120 bins across the window - a bin count
rather than a fraction of volatility, so the resolution is the same on every
symbol and in every regime. Profile Width 60 bars, Volume Source tick or real,
Max Drawn Profile Bins 250, Value Area Percent 70, and switches for the profile,
the point of control and the value area.

Levels. Show Active Levels, Fade After 150 bars, Show Sweep Markers.

Panel, Colors, Alerts, Diagnostics. Panel corner, position, minimum width and
font size; the full colour set; the three alerts and their three delivery
methods; and a diagnostics log switch that reports per-pass counts when you are
tuning.


Usage

Start by leaving the defaults alone and reading the panel rather than the chart.
Give it enough history for the counts to mean something. The rates stay hidden as
raw counts until the sample reaches the minimum, which is the signal that the
numbers are not yet worth acting on.

What you are looking for is a side that behaves differently from a coin flip on
your instrument and timeframe. A high follow-through rate on one side says
breakouts there tend to continue; a low one says they tend to get faded. Both are
tradeable, in opposite directions, and both are visible before you take the trade
rather than after.

Swing Length sets what counts as structural. Larger values track fewer, more
significant levels; smaller values track more of them. Verdict Horizon sets how
long a breakout is given to prove itself, and it should reflect how long you
would actually hold a trade.


Compatibility

MetaTrader 5, any symbol, any timeframe. Uses tick volume by default so it works
on instruments that do not report exchange volume, with an explicit fallback
counter when real volume is selected but unavailable. No DLLs, no external files,
no internet access, and no dependence on any other indicator.


Support

For questions and support, please use the comments section of this product page
or contact the author through the MQL5 messaging system.
Рекомендуем также
Overview Harmonic Patterns MT5 is a technical analysis indicator designed for the MetaTrader 5 platform. It identifies and displays harmonic price patterns, such as Butterfly, Cypher, Crab, Bat, Shark, and Gartley, in both bullish and bearish directions. The indicator calculates key price levels, including entry, stop loss, and three take-profit levels, to assist traders in analyzing market movements. Visual elements and customizable alerts enhance usability on the chart. Features Detects six ha
Multi Timeframe Smc Bias Finder Trading in alignment with higher timeframe structure is one of the most consistently profitable habits a trader can build. The difficulty has always been execution: switching between timeframes, manually reading structure, and keeping track of whether the Daily, 4-Hour and 1-Hour are all pointing in the same direction before committing to a position. Multi Timeframe Smc Bias Finder resolves that entirely. Three tools in one indicator: A live multi-timeframe bias d
Master Edition — это профессиональный аналитический инструмент, предназначенный для визуализации структуры рынка через призму объема и денежного потока. В отличие от стандартных индикаторов объема, этот инструмент отображает Daily Volume Profile (Дневной Профиль Объема) прямо на вашем графике, позволяя видеть, где именно происходило открытие цены и где позиционируются «умные деньги». Эта версия Master Edition разработана для ясности и скорости, оснащенная уникальной системой Auto-Theme Sync, кот
Это, пожалуй, самый полный индикатор автоматического распознавания гармонического ценообразования, который вы можете найти для платформы MetaTrader. Он обнаруживает 19 различных паттернов, воспринимает проекции Фибоначчи так же серьезно, как и вы, отображает зону потенциального разворота (PRZ) и находит подходящие уровни стоп-лосс и тейк-профит. [ Руководство по установке | Руководство по обновлению | Устранение неполадок | FAQ | Все продукты ] Он обнаруживает 19 различных гармонических ценов
Description The indicator uses market profile theory to show the most relevant trading zones, on a daily basis. The zones to be shown are LVN (low volume nodes) and POC (point of control). An LVN zone is one which represents price areas with the least time or volume throughout the day. Typically, these areas indicate a supply or demand initiative, and in the future, they can turn into important breakout or retracement zones. A POC zone is one which represents price areas with the most time or vo
Weis Wave Scouter
Jean Carlos Martins Roso
Откройте для себя силу продвинутого анализа объема с Weis Wave Scouter — революционным индикатором для MetaTrader 5, который сочетает проверенные временем принципы метода Вайкоффа и анализа объема VSA (Volume Spread Analysis). Разработанный для трейдеров, стремящихся к точности и глубине в своих операциях, этот индикатор предлагает тактическое чтение рынка через анализ кумулятивных волн объема, помогая выявлять ключевые точки разворота и продолжения тренда. Weis Wave Scouter имеет четкий визуаль
SMART ATR GRID PRO++ – Adaptive Grid Intelligence Suite is a next-generation, institutional-grade grid trading indicator engineered for traders who demand precision, adaptability, and comprehensive market structure analysis. By seamlessly integrating   Adaptive Volatility Grid System ,   KAMA Candle Trend Filtering ,   Multi-Factor Trend Detection (ADX + EMA20/50) ,   Dynamic Heatmap Zone Engine , and   Real-Time Market Regime Classification , this indicator delivers a complete decision-making
No Demand No Supply MT5
Trade The Volume Waves Single Member P.C.
No Demand No Supply   This indicator identifies   No Demand –No Supply candles to your chart and plots volume bars colored according to the signal. It can be applied to all timeframes or to a specific one only. It can also be used as regular volume indicator  with exceptional future of WEIGHTED VOLUME. Furthermore is has an alert notification, sound and email when a signals occurs. The indicator does not repaint but the alert will come on two candles back due to the definition of No Demand No Su
Профиль Рынка (Market Profile) определяет ряд типов дней, которые помогают трейдеру распознать поведение рынка. Ключевая особенность - это область значений (Value Area), представляющая диапазон ценового действия, в котором произошло 70% торговли. Понимание области значений может помочь трейдерам вникнуть в направление рынка и установить торговлю с более высокими шансами на успех. Это отличное дополнение к любой системе, которую вы возможно используете. Blahtech Limited представляет сообществу Me
WaveTrend Oscillator MT5 — это мощный торговый индикатор, предназначенный для улучшения вашего анализа рынка путем выявления изменений импульса и потенциальных разворотов тренда. Идеален для трейдеров всех уровней, этот инструмент предлагает ценные инсайты о перепроданных и перекупленных условиях на различных рынках, включая forex, криптовалюты и товары. Благодаря своей способности генерировать точные сигналы на покупку и продажу, WaveTrend Oscillator MT5 дает трейдерам возможность принимать обо
TRI Visualizer MT5 – Thermodynamic Market Analysis Overview The TRI (Thermal Range Indicator) Visualizer Enhanced is a rare market analysis indicator that goes beyond conventional technical analysis, applying principles of thermodynamics from physics. It interprets market price fluctuations as “thermodynamic energy,” enabling the highly accurate detection of subtle market changes that are often overlooked. Innovative Mechanisms 1. Dual Calculation Engines Classic TRI Mode Formula: |Close
УР Гамма (на основе аналогичных вычислений, используемых в системах машинного обучения) UR Gamma — это передовой инструмент финансового анализа, который предлагает новую и улучшенную версию классического индикатора WaveTrend. Включая передовые методы цифровой обработки сигналов, UR Gamma устраняет некоторые ограничения традиционных алгоритмов WaveTrend и обеспечивает более точный, надежный и динамичный подход к выявлению и измерению трендов в движении цены. Преимущества использования УР Гамма
Wapv Price and volume
Eduardo Da Costa Custodio Santos
Индикатор цены и объема WAPV для MT5 является частью набора инструментов (Wyckoff Academy Wave Market) и (Wyckoff Academy Price and Volume). Индикатор цены и объема WAPV для MT5 был создан, чтобы упростить визуализацию движения объема на графике интуитивно понятным способом. С его помощью можно наблюдать моменты пикового объема и моменты, когда рынок не представляет профессионального интереса. Определите моменты, когда рынок движется по инерции, а не по движению «умных денег». Он состоит из 4 цв
Волны Вольфа - это естественные торговые модели, присутствующие на всех финансовых рынках и представляющие собой борьбу за равновесную цену. Эти модели могут развиваться в течение коротких и долгосрочных периодов времени и являются одной из самых надежных моделей прогнозного разворота из существующих, обычно предшествующих сильным и долгим движениям цены. [ Руководство по установке | Руководство по обновлению | Устранение неполадок | FAQ | Все продукты ] Четкие торговые сигналы Удивительно легк
Monster Harmonics Indicator is a harmonic pattern indicator. It recognizes Gartley, Bat, Crab, Butterfly, Cypher, White Swan, Black Swan, Shark and AB=CD patterns. Projected patterns that are not yet completed are recognized, too. Monster even shows the PRZ (Potential Reversal Zone). Users can add their own user defined patterns to Monster. Besides the current pattern, Monster also shows all patterns in the symbols history. Monster will provide alerts for developing patterns. Introduced by H.M.
Cumulative Volume Delta MA-X MTF (с градиентным импульсом) Этот индикатор выполняет мультитаймфреймовый анализ кумулятивной дельты объема (CVD) для платформы MetaTrader 5. Он рассчитывает чистую разницу между давлением покупателей и продавцов, анализируя тиковые данные или реальный объем, что позволяет визуально оценить настроения потока ордеров. Логика и функции индикатора Индикатор использует математический подход к анализу объема: Источники данных: Поддержка как реального объема ( Real Volum
Triangle Pattern Gann v3.1 - Complete Feature Documentation Core Functionality OverviewTriangle Pattern Gann v3.1 is a sophisticated MetaTrader 5 indicator that combines W.D. Gann's geometric trading principles with advanced triangle pattern recognition to deliver actionable trading signals. Primary Features1. Triangle Pattern Detection SystemAscending Triangle Recognition Function: Automatically identifies bullish continuation patterns Detection Criteria: Flat horizontal resistance line
Flow Architect Lite - Professional Market Structure Toolkit Free Version Features: Core Structure Analysis: Daily VWAP Engine   - Volume-weighted average price for institutional level tracking Standard Deviation Bands (SD1)   - Dynamic support and resistance zones Break of Structure Detection   - Visual markers for market structure shifts Fair Value Gap Identification   - Highlighted imbalance zones on your charts ATR Volatility Context   - Real-time Average True Range measurement Clean Informat
Volume Delta Candles: A Comprehensive Tool for In-Depth Trading Analysis Unlock a seamless way to interpret trading experience within each candle. With Volume Delta Candles, there's no need for additional volume indicators—everything you need is built in. This advanced tool utilizes lower timeframes or live market data to present the percentage of buying versus selling volume within each candle as an intuitive color-coded bar. Before diving in, ensure you’re familiar with Volume and Volume Delta
Russian Описание преимуществ (без упоминания кода) 1. Детальное разделение рыночных условий (3 измерения) В отличие от большинства инструментов, показывающих только «Вверх» или «Вниз», этот индикатор выделяет «Боковой тренд» (Sideways) . Трейдер видит: Победу покупателей (Быки). Победу продавцов (Медведи). Главное: Когда рынок находится во флэте, что снижает риск ошибок. 2. Измерение силы тренда (Осциллятор 0-100) Приводит волатильность к диапазону 0-100: Экстремальные зоны: Уровни перекупленнос
Renko Plus
Eadvisors Software Inc.
With Renko Plus you can use the features in the Indicator functionality, just add it to the Metatrader5 chart.             The Renko chart is a type of chart, developed by the Japanese, that is constructed using price movement rather than standardized prices and time intervals like most charts. It is believed to be named after the Japanese word for bricks, "renga", as the graphic looks like a series of bricks.             A new brick is created when the price moves a specified pri
PriceMagnet Volume Profile Stop guessing where the smart money is sitting. See it. PriceMagnet Volume Profile is a precision volume-analysis indicator built for MetaTrader 5 traders who want to trade with institutional context instead of guesswork. Rather than plotting volume as a flat bar under your chart, PriceMagnet reconstructs a full horizontal volume histogram directly on price — showing you exactly which price levels attracted the most trading activity over your selected lookback window,
Price Magnet — Индикатор зон плотности цены и уровней притяжения Price Magnet — это профессиональный аналитический инструмент, который определяет ключевые уровни поддержки и сопротивления на основе статистической плотности распределения цены (Price Density). Индикатор анализирует заданный исторический период и находит ценовые значения, на которых рынок находился дольше всего. Эти зоны выступают в роли «магнитов» — они притягивают цену или служат фундаментом для разворота. В отличие от стандартны
Indicador Padroes de Reversao para Candles
SMART2TRADER SOLUCOES DE SOFTWARES INTELIGENTES LTDA
Developed by Smart Trader - Smart Reversion Pattern is an indicator capable of identifying reversal patterns , both bullish reversals and bearish reversals. It is designed to provide fast, real-time awareness of patterns. We also thought about the interface part, creating a clean and pleasant look to identify formation patterns on the chart. Note: If any pattern you need is not listed, just contact us and request inclusion - we usually respond within a few hours. Bearish Reversal Patterns
The Accumulation / Distribution is an indicator which was essentially designed to measure underlying supply and demand. It accomplishes this by trying to determine whether traders are actually accumulating (buying) or distributing (selling). This indicator should be more accurate than other default MT5 AD indicator for measuring buy/sell pressure by volume, identifying trend change through divergence and calculating Accumulation/Distribution (A/D) level. Application: - Buy/sell pressure: above
Passband Filter Pro Passband Filter Pro is a trend and cycle oscillator for MetaTrader 5. It is built on the Ehlers Super Passband Filter, a band pass filter that removes long term trend drift and short term noise so that only the dominant market cycle remains. The result is a clean oscillator with a color cloud that shows overbought and oversold conditions, cycle turns, and momentum on forex, gold, indices, stocks and crypto. Most traders enter too early or too late. Simple moving averages la
The Super Arrow Indicator provides non-repainting buy and sell signals with exceptional accuracy. Key Features No repainting – confirmed signals remain fixed Clear visual arrows: green for buy, red for sell Real-time alerts via pop-up, sound, and optional email Clean chart view with no unnecessary clutter Works on all markets: Forex, gold, oil, indices, crypto Adjustable Parameters TimeFrame Default:   "current time frame" Function:   Sets the time frame for indicator calculation Options:   Can
WAPV Weis Wave Chart Forex
Eduardo Da Costa Custodio Santos
График Weis Wave Forex для MT5 — это индикатор цены и объема. Чтение цены и объема было широко распространено через Ричарда Демиля Вайкоффа на основе трех созданных им законов: спроса и предложения, причины и следствия и усилия против результата. В 1900 году Р. Вайкофф уже использовал волновую диаграмму в своих анализах. Много лет спустя, примерно в 1990 году, Дэвид Вайс автоматизировал волновой график Р. Вайкоффа, и сегодня мы представляем вам эволюцию волнового графика Дэвида Вайса. Он показыв
"Impulses and Corrections 5" создан для того, чтобы помочь трейдерам ориентироваться в рыночной ситуации. Индикатор показывает мультитаймфреймовые восходящие и нисходящие импульсы ценовых движений. Эти импульсы служат основой для определения "Базы" , состоящей из зон "Коррекции" ценовых движений, а также имеет "Потенциальные" зоны для возможных сценариев движения цены. Восходящие и нисходящие импульсы определяются на основе модифицированной формулы индикатора "Фракталы" Билла Вильямса. Последни
WBS SMC Without Repaint – Ultimate XAUUSD Scalping Engine (M5 Timeframe) Take your Gold trading to the institutional level with "WBS SMC Without Repaint", a highly advanced premium indicator engineered specifically for XAUUSD (Gold) on the M5 (5-Minute) timeframe.  Built upon the core pillars of Smart Money Concepts (SMC) combined with precise algorithmic candle pattern recognition, this tool identifies high-probability institutional footprints in real-time. Best of all: 100% ABSOLUTELY
С этим продуктом покупают
Этот продукт был обновлен для рынка 2026 года и оптимизирован для последних сборок MT5. УВЕДОМЛЕНИЕ ОБ ИЗМЕНЕНИИ ЦЕНЫ: Smart Trend Trading System сейчас доступен за $99 . Цена увеличится до $199 после следующих 30 покупок . СПЕЦИАЛЬНОЕ ПРЕДЛОЖЕНИЕ: После покупки Smart Trend Trading System отправьте мне личное сообщение, чтобы получить Smart Universal EA БЕСПЛАТНО и превратить сигналы Smart Trend в автоматические сделки. Smart Trend Trading System — это полноценная торговая система без перерисов
Trend Sniper X
Sarvarbek Abduvoxobov
5 (11)
Trend Sniper X — это индикатор следования за трендом с несколькими таймфреймами для MetaTrader 5, который помогает трейдерам четко и точно определять направление тренда и потенциальные точки разворота. Информация о цене: Текущая цена является промо-ценой и может измениться по мере выпуска обновлений и новых функций. Канал Code2Profit Освойте рынок с помощью мультитаймфреймового анализа! Как максимально увеличить процент побед с Trend Sniper X: основные правила и советы по сессиям Технические хар
Время от времени я торгую по этой системе лично.  Оцени, мой мануальный BOMBER трейдинг на реальном счету - LIVE SIGNAL Каждый покупатель этого индикатора получает дополнительно Бесплатно: Авторскую утилиту "Bomber Utility", которая автоматически сопровождает каждю торговую операцию, устанавливает уровни Стоп Лосс и Тейк профит и закрывает сделки согласно правилам этой стратегии, Сет-файлы для настройки этого индикатора на различных активах, Сет-файлы для настройки Bomber Utility в режимы: "Мин
Neuro Poseidon - новый индикатор от Дарьи Резуевой. Он сочетает точные торговые сигналы с адаптивными уровнями TP/SL , в результате создавая максимально выгодные сделки! TO SWITCH TO   ENG   PLEASE CHOOSE IT IN THE UPPER-RIGHT CORNER OF THE WEBSITE Напишите мне и получите  Neuro Poseidon Assistant  в подарок для автоматизации вашей торговли! Что отличает его от других индикаторов? 1. Доказанная прибыльность на всех активах и таймфреймах 2. На графике присутствуют только подтвержденные сигналы н
Welcome to ENTRY IN THE ZONE AND SMC MULTI TIMEFRAME Entry In The Zone and SMC Multi Timeframe is a real-time market analysis tool based on Smart Money Concepts (SMC), designed to analyze market structure, price direction, and key trading zones. It supports both Single-Timeframe Analysis and Multi-Timeframe Analysis, providing a clearer view of the overall market structure across multiple timeframes, with real-time BUY / SELL signals that do not repaint. It is designed to help filter trading opp
SuperScalp Pro
Van Minh Nguyen
4.61 (31)
SuperScalp Pro – Профессиональная многослойная скальпинговая система с подтверждением сигналов SuperScalp Pro — это профессиональная многослойная скальпинговая система с подтверждением сигналов по нескольким факторам, разработанная для поиска торговых возможностей с более высокой вероятностью успеха. Она предоставляет более точные подтверждения входа, уровни Stop Loss и Take Profit на основе ATR, а также гибкую систему фильтрации сигналов для XAUUSD, BTCUSD и основных валютных пар Forex. Получит
Легенда возвращается! Entry Points Pro 10. Перезапуск легендарного индикатора, который 3 года держался в Топ-3 MQL5 Market. Сотни восторженных отзывов (589 на две версии), тысячи трейдеров торгуют с его помощью каждый день, 31 000+ скачиваний демо MT4+MT5. Я прочитал каждый ваш отзыв за пять лет — и вместо обещаний встроил в версию 10 ответы. От автора, который в рынке с 1999 года и ценит честность, свою репутацию и своих клиентов . Стартовая цена $99 действует только на первые 10 копий.   Сразу
Давайте сначала будем честны. Ни один индикатор сам по себе не сделает вас прибыльным. Если кто-то говорит вам обратное — он продаёт вам мечту. Любой индикатор, который показывает идеальные стрелки покупки/продажи, можно сделать безупречным — просто увеличьте нужный участок истории и сделайте скриншот успешных сделок. Мы так делать не будем. SMC Intraday Formula — это инструмент. Он считывает структуру рынка за вас, определяет зоны с наивысшей вероятностью движения цены и точно показывает, как
M1 SNIPER   — это простая в использовании торговая система. Это стрелочный индикатор, разработанный для тайм фрейма M1. Индикатор можно использовать как отдельную систему для скальпинга на тайм фрейме M1, а также как часть вашей существующей торговой системы. Хотя эта торговая система была разработана специально для торговли на M1, ее можно использовать и с другими тайм фреймами. Первоначально я разработал этот метод для торговли XAUUSD и BTCUSD. Но я считаю этот метод полезным и для торговли на
UZFX {SSS} Scalping Smart Signals v4.0 MT5 — это высокопроизводительный торговый индикатор без перерисовки, разработанный для скальперов, дейтрейдеров и свинг-трейдеров, которым требуются точные сигналы в режиме реального времени на быстро меняющихся рынках. Разработанный компанией (UZFX-LABS), этот индикатор сочетает в себе анализ ценового действия, подтверждение тренда и интеллектуальную фильтрацию для генерации высоковероятных сигналов на покупку и продажу, предупреждающих сигналов и возможно
Этот продукт был обновлен для рынка 2026 года и оптимизирован для последних сборок MT5. УВЕДОМЛЕНИЕ ОБ ИЗМЕНЕНИИ ЦЕНЫ: Atomic Analyst сейчас доступен за $99 . Цена увеличится до $199 после следующих 30 покупок . СПЕЦИАЛЬНОЕ ПРЕДЛОЖЕНИЕ: После покупки Atomic Analyst отправьте мне личное сообщение, чтобы получить Smart Universal EA БЕСПЛАТНО и превратить сигналы Atomic Analyst в автоматические сделки. Atomic Analyst — это индикатор Price Action без перерисовки, без перерисовывания истории и без
GoldenX Entry — это индикатор для MT5 с адаптивным алгоритмом Smart Entry Trend, системой оценки сигналов, детектором рыночных режимов и фильтром волатильности. Каждый сигнал включает рассчитанный уровень входа, три уровня Take-Profit (TP1, TP2, TP3) и уровень Stop-Loss. Он построен на нескольких аналитических слоях, предназначенных для адаптации к различным рыночным условиям, объединяя многоуровневую аналитическую систему со встроенным оптимизатором и системой статистического отслеживания. Инди
Superhero
Ihor Otkydach
5 (2)
SUPERHERO индикатор - это мультивалютная торговая система, которая создана по принципу "Все включено". Индикатор самостоятельно анализирует рынок и дает сигналы когда открывать и когда закрывать сделки. Используются ордера Стоп Лосс и Тейк профит. Соотношение R:R = 1:1 Время от времени я торгую по сигналам этого индикатора лично, и вот какие результаты я получаю - LIVE SIGNAL Эта система может присылать на смартфон PUSH-уведомления, так что вы сможете делать сделки "на ходу" без привязки к ПК. О
Session High Low Lines Индикатор наносит на график ключевые внутридневные уровни: максимум/минимум предыдущего дня и максимум/минимум текущего дня, который обновляется автоматически по мере формирования новой дневной свечи. Дополнительно можно включить отображение максимума/минимума предыдущей недели. Такие уровни часто используются как ориентиры для потенциальных зон поддержки и сопротивления, для подтверждения пробоя и для оценки диапазона текущей торговой сессии. Возможности Линии High/Low пр
Zoryk Gold
Reda El Koutbane
5 (6)
Скидка заканчивается через 24 часа — следующая цена $ 69 ZORYK — продвинутая сигнальная система для XAUUSD в MetaTrader 5 Вам знакомо это чувство. Вы долго анализируете золото. Ждёте подходящего момента для входа. Наконец открываете сделку — и цена сразу начинает двигаться против вас. Вы закрываете позицию слишком рано, передвигаете Stop Loss или сомневаетесь всего несколько секунд. После этого рынок достигает именно той цели, которую вы ожидали изначально, но уже без вас. Проблема не всегда за
Gann Made Easy   - это профессиональная, но при этом очень простая в применении Форекс система, основанная на лучших принципах торговли по методам господина У.Д. Ганна. Индикатор дает точные BUY/SELL сигналы, включающие в себя уровни Stop Loss и Take Profit. ПОЖАЛУЙСТА, СВЯЖИТЕСЬ СО МНОЙ ПОСЛЕ ПОКУПКИ, ЧТОБЫ ПОЛУЧИТЬ ТОРГОВЫЕ ИНСТРУКЦИИ И ОТЛИЧНЫЕ ДОПОЛНИТЕЛЬНЫЕ ИНДИКАТОРЫ БЕСПЛАТНО! Вероятно вы уже не раз слышали о торговли по методам Ганна. Как правило теория Ганна отпугивает от себя не только
AXIOM MATRIX MT5 СТАРТОВАЯ ЦЕНА: $99 Axiom Matrix доступен по стартовой цене $99. Цена увеличится до $199 после первых 30 покупок. После покупки напишите мне в личные сообщения, чтобы получить инструкции и забрать свой эксклюзивный подарочный бонус. Axiom Matrix — это профессиональный мультисимвольный и мультитаймфреймный рыночный сканер и панель принятия решений для MetaTrader 5. Он сканирует ваш Market Watch, анализирует несколько таймфреймов, считывает несколько движков подтверждений, сравнив
SkyHammer Signal Pro Профессиональный трендовый индикатор без перерисовки с фиксированными уровнями Entry, SL и TP SkyHammer Signal Pro — это структурированный индикатор тренда и momentum, созданный для трейдеров, которым нужны четкие, зафиксированные и проверяемые торговые сигналы. Лучше всего он работает на младших таймфреймах, таких как M1 и M5 . Индикатор не пытается предсказывать вершины или основания рынка. Вместо этого он ожидает подтвержденную рыночную структуру, направление тренда, силу
The Oracle Pro
Ottaviano De Cicco
5 (1)
The Oracle Pro: синтетический мульти-таймфрейм движок направленного смещения для MT5 ️ Летнее предложение к запуску — получите The Oracle Pro за 199 USD (для ранних покупателей). Цена растёт по мере спроса; финальная цена 399 USD. The Oracle Pro — это премиальный мульти-таймфрейм движок направленного смещения (bias) для MetaTrader 5, созданный для требовательных и профессиональных трейдеров. Он дисциплинированно отвечает на один вопрос: каково направленное смещение на каждом таймфрейме прямо се
Crystal Heikin Ashi Signals - Professional Trend & Signal Detection Indicator Advanced Heikin Ashi Visualization with Intelligent Signal System for Manual & Automated Trading Final Price: $149 ---------> Price goes up $10 after every 10 sales . Limited slots available — act fast . Overview Crystal Heikin Ashi Signals is a professional-grade MetaTrader 5 indicator that combines pure Heikin Ashi candle visualization with an advanced momentum-shift detection system. Designed for both manual traders

Currency Strength Wizard   — очень мощный индикатор, предоставляющий вам комплексное решение для успешной торговли. Индикатор рассчитывает силу той или иной форекс-пары, используя данные всех валют на нескольких тайм фреймах. Эти данные представлены в виде простых в использовании индексов валют и линий силы валют, которые вы можете использовать, чтобы увидеть силу той или иной валюты. Все, что вам нужно, это прикрепить индикатор к графику, на котором вы хотите торговать, и индикатор покажет вам

Azimuth Pro
Ottaviano De Cicco
5 (7)
Azimuth Pro V2: Синтетический фрактальный структурный анализ и подтверждённые входы для MT5 Обзор Azimuth Pro — многоуровневый индикатор свинговой структуры от Merkava Labs . Четыре вложенных уровня свингов, привязанный к свингам VWAP, определение ABC-паттернов, трёхтаймфреймная структурная фильтрация и подтверждённые входы на закрытой свече — один график, один рабочий процесс от микро-свингов до макро-циклов. Это не слепой сигнальный продукт. Это рабочий процесс, основанный на структуре, для т
Trend Catcher   анализирует движения рыночных цен, используя комбинацию собственных и индивидуально разработанных адаптивных индикаторов анализа тренда. Он определяет истинное направление рынка, отфильтровывая краткосрочные шумы и фокусируясь на силе импульса, расширении волатильности и поведении ценовой структуры. Он также использует комбинацию сглаживающих и фильтрующих тренд индикаторов, таких как скользящие средние, RSI и фильтры волатильности. Мониторинг реальных операций, а также другие
FiboSniper Pro – Профессиональная торговая система на основе Fibonacci Grid с многоуровневыми фильтрами FiboSniper Pro — это продвинутая система технического анализа, которая сочетает Fibonacci Envelopes с многоуровневыми фильтрами, включая ADX, EMA, RSI, ATR и фильтр времени, помогая выявлять отфильтрованные точки входа, а также автоматически рассчитывать уровни Stop Loss и Take Profit на основе волатильности ATR. Система специально разработана для трейдеров, использующих скальпинговые стратеги
Reversion King Indicator
Eugen-alexandru Zibileanu
5 (6)
Новый король в городе — Индикатор + управление ордерами (TP1 + TP2 + TP3) + опциональный Telegram-сигнал-сендер ВКЛЮЧЁН (БЕСПЛАТНО) (ПОЛНОЦЕННАЯ ТОРГОВАЯ И СИГНАЛЬНАЯ СИСТЕМА) Gold Slayer EA Этот индикатор включает в себя продвинутую стратегию, торговую систему с настраиваемым управлением ордерами и систему mean reversion, которая сочетает расширения Envelope и поддерживается несколькими интеллектуальными фильтрами подтверждения, такими как RSI, для поиска высоковероятных точек разворота с сигн
Этот продукт был обновлен для рынка 2026 года и оптимизирован для последних сборок MT5. УВЕДОМЛЕНИЕ ОБ ИЗМЕНЕНИИ ЦЕНЫ: Smart Price Action Concepts сейчас доступен за $200 . Цена увеличится до $299 после следующих 30 покупок . СПЕЦИАЛЬНОЕ ПРЕДЛОЖЕНИЕ: После покупки отправьте мне личное сообщение, чтобы получить БЕСПЛАТНЫЙ бонус + подарок . Прежде всего, стоит подчеркнуть, что этот торговый инструмент является индикатором без перерисовки, без перерисовывания истории и без запаздывания, что делает
Power Candles V3 — самооптимизирующийся индикатор силы Power Candles V3 преобразует силу валюты и инструмента в готовый к использованию торговый план на каждом графике, к которому он прикреплен. Вместо того, чтобы просто раскрашивать свечи, он выполняет автоматическую оптимизацию в режиме реального времени в фоновом режиме и предоставляет вам оптимальные значения Stop Loss, Take Profit и порог сигнала для выбранного вами символа. Один клик — и все готово для реальной торговли: на графике появляю
Btmm state engine pro
Garry James Goodchild
5 (4)
BTMM State Engine Pro by G-Labs — Beat The Market Maker indicator for MetaTrader 5. Asian session range, London and New York kill zones, level progression (L1/L2/L3), peak formation detection (PFH/PFL), entry signals, and a multi-pair scanner from one chart. Stop scanning charts one pair at a time. The State Engine tracks the BTMM daily cycle automatically — Asian box, room boundaries, level blocks, peak formations, and filtered entries — while the scanner dashboard shows level, peak status, d
M1 Quantum MT5
Hamed Dehgani
4.27 (11)
Торговые сигналы в реальном времени с использованием M1 Quantum: Сигнал  (Сделка выполнена автоматически с помощью Quantum Trade Assistant , бесплатно включённого в этот продукт.) Последние новости : Выпущена версия 1.64. Теперь для всех сделок Stop Loss размещается за соответствующими зонами поддержки/сопротивления. Функция Smart Close также была улучшена для повышения производительности EA в этой версии. С 9 августа live-сигнал работает на версии 1.64. План цен: Текущая цена: $169 (Предложени
Quant Direction — это инструмент трехмерного анализа рынка. Он обеспечивает полностью объективный, основанный на алгоритмах анализ рынка, одновременно вычисляя точные процентные отклонения по нескольким параметрам. Разработанный с использованием передовых инструментов моделирования на основе искусственного интеллекта и тщательно протестированный, алгоритм предназначен для интерпретации рынка с уникальной точностью. Он может анализировать любую валютную пару или финансовый инструмент на вашей пла
Другие продукты этого автора
ATR Stop Loss Finder automatically calculates and displays dynamic   stop loss levels on your chart based on the Average True Range   indicator. The tool helps traders place logical, volatility-adjusted   stop loss orders rather than relying on fixed pip values or arbitrary   price levels.   The indicator plots two lines directly on the chart: an upper line   for short positions and a lower line for long positions. Both lines   update in real time with each new bar. A small information panel  
Lion Lightning Scalper: Unleash Your Trading Potential with a Professional-Grade Expert Advisor The Lion Lightning Scalper isn't your average Expert Advisor (EA); it's a powerful, cutting-edge tool designed to meet the needs of traders seeking maximum profitability in the volatile Forex market. Why Choose Lion Lightning Scalper? Superior Speed: With sophisticated trading strategies and lightning-fast market analysis, Lion Lightning Scalper can enter and exit the market in fractions of a second
Apex Market Structure is a complete Smart Money toolkit that maps market   structure, order blocks, liquidity and multi-timeframe trend in real time,   directly on your chart. It is built for traders who read price action the   way institutions do: structure breaks, liquidity sweeps, and reaction zones,   all detected automatically and confirmed at bar close.   Everything is drawn for you. No manual line drawing, no guesswork, no second   indicator needed.   How It Works   The indicator con
Triple Signal HARSI turns the classic Heikin Ashi RSI oscillator into a   complete decision tool by adding three layers of confirmation: a built-in   alert engine, a multi-timeframe dashboard, and automatic divergence   detection. Instead of staring at one oscillator, you get momentum,   higher-timeframe context, and reversal warnings in a single window.   How It Works   The indicator converts a zero-centered RSI into smoothed Heikin Ashi   candles, so momentum shifts appear as clean candle
Vertex Structure Dashboard delivers a complete multi-timeframe market structure analysis in a single, compact panel. It monitors up to 9   timeframes simultaneously and displays trend bias, structural breaks, momentum, and value zones in real time — no tab-switching, no manual   tracking.   The panel is fully draggable and collapsible. Its position persists across timeframe changes through GlobalVariables, so your layout stays   exactly where you placed it.   How It Works   Each enabled tim
Ricochet is an automated trading system for EURUSD on the M1 timeframe, built   around one simple but powerful idea: a losing trade should not be the end of the   move, it should be the start of the next one.   Most systems take a stop loss and walk away. Ricochet does the opposite. The   moment a trade is stopped out, the engine changes state and fires again in the   direction the market just proved it wanted to go. A failed entry becomes the   trigger for the recovery. That is the Ricochet p
Most traders never actually find out whether the signal they follow makes money. Signal Verdict answers that on your own chart. It replays your entry rule across history, opens and closes a simulated position for every signal, and reports what really came out: win rate, expectancy in R, profit factor, drawdown, and how often each take profit was reached. It is not limited to its own signals. Signal Verdict can read the buffers of any indicator installed on your terminal, so the arrows you are
Precedent RSI answers one question on every bar: when the market last looked like this, what happened next. It turns each bar into an eight part momentum fingerprint, searches settled history for the closest matches, and lets the outcomes those matches actually produced decide the direction. Signals are fixed at bar close and never move afterwards. How It Works Every bar is described by eight readings taken from RSI behaviour rather than from the RSI level alone: value, slope, acceleration,
Understudy shows which market regime you are in, and it tells you when its own machine learning is not good enough to be trusted. Most machine learning indicators ask you to take the model on faith. This one measures itself against a fixed structural baseline on every closed bar and publishes the verdict on the chart. It will tell you, in writing, when it is losing. HOW IT WORKS Two forecasters run side by side. The Principal is a fixed structural model. Its weights never change, so it stay
Фильтр:
Нет отзывов
Ответ на отзыв