Sweep Ledger

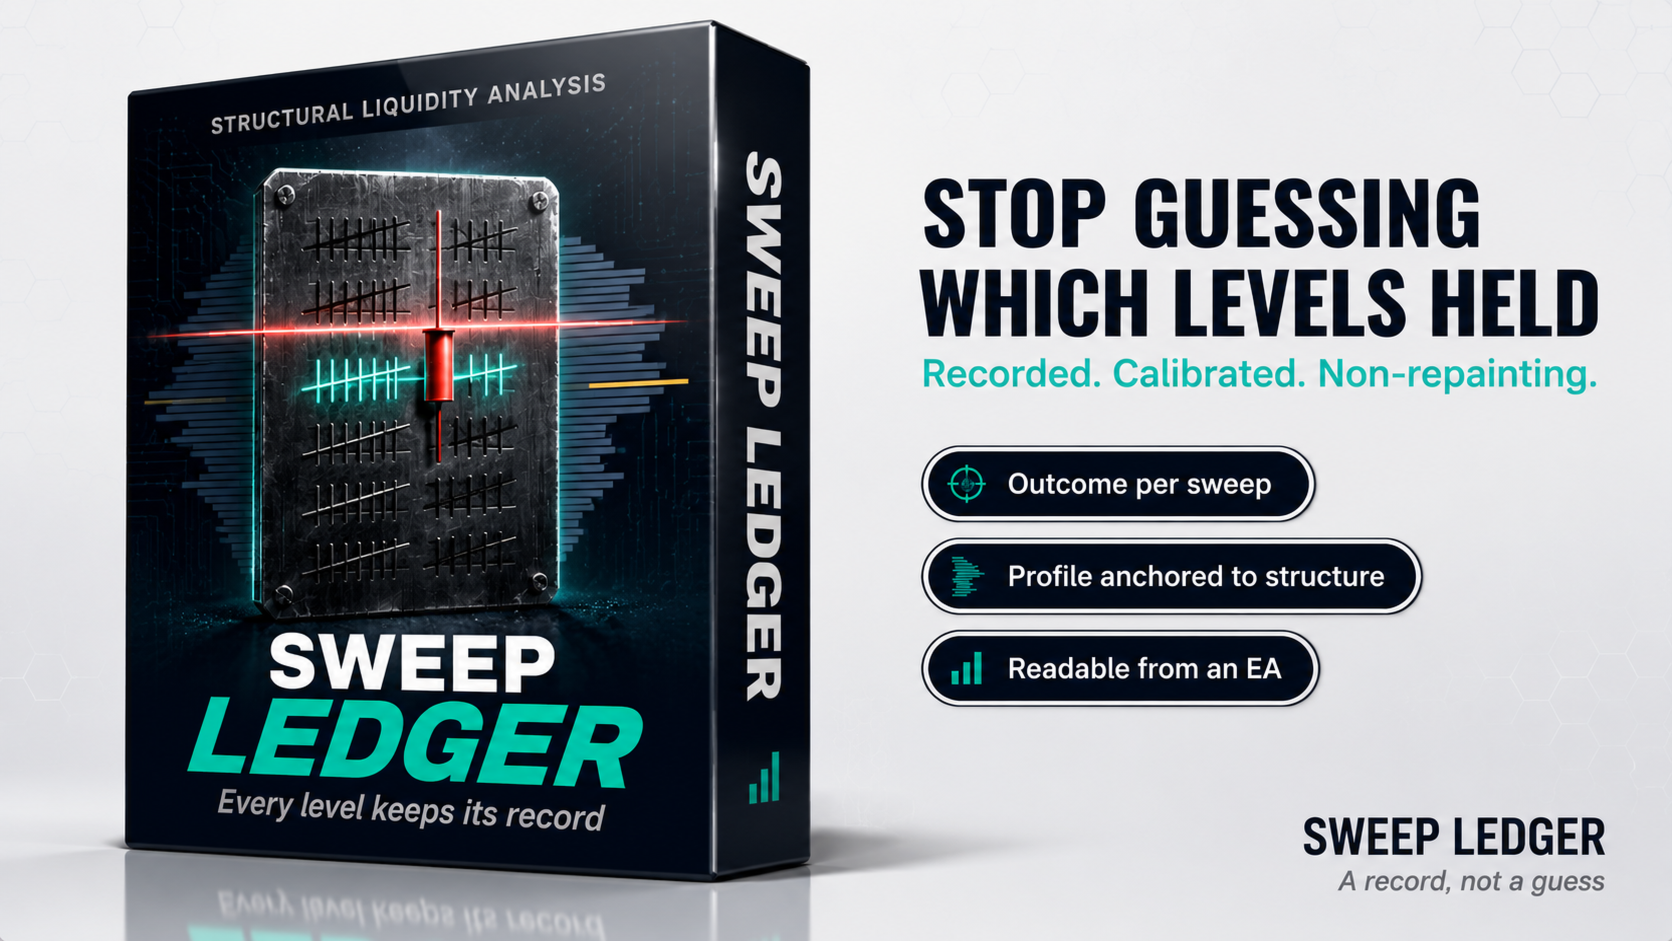
Most liquidity tools draw a level and leave you to guess whether it mattered.
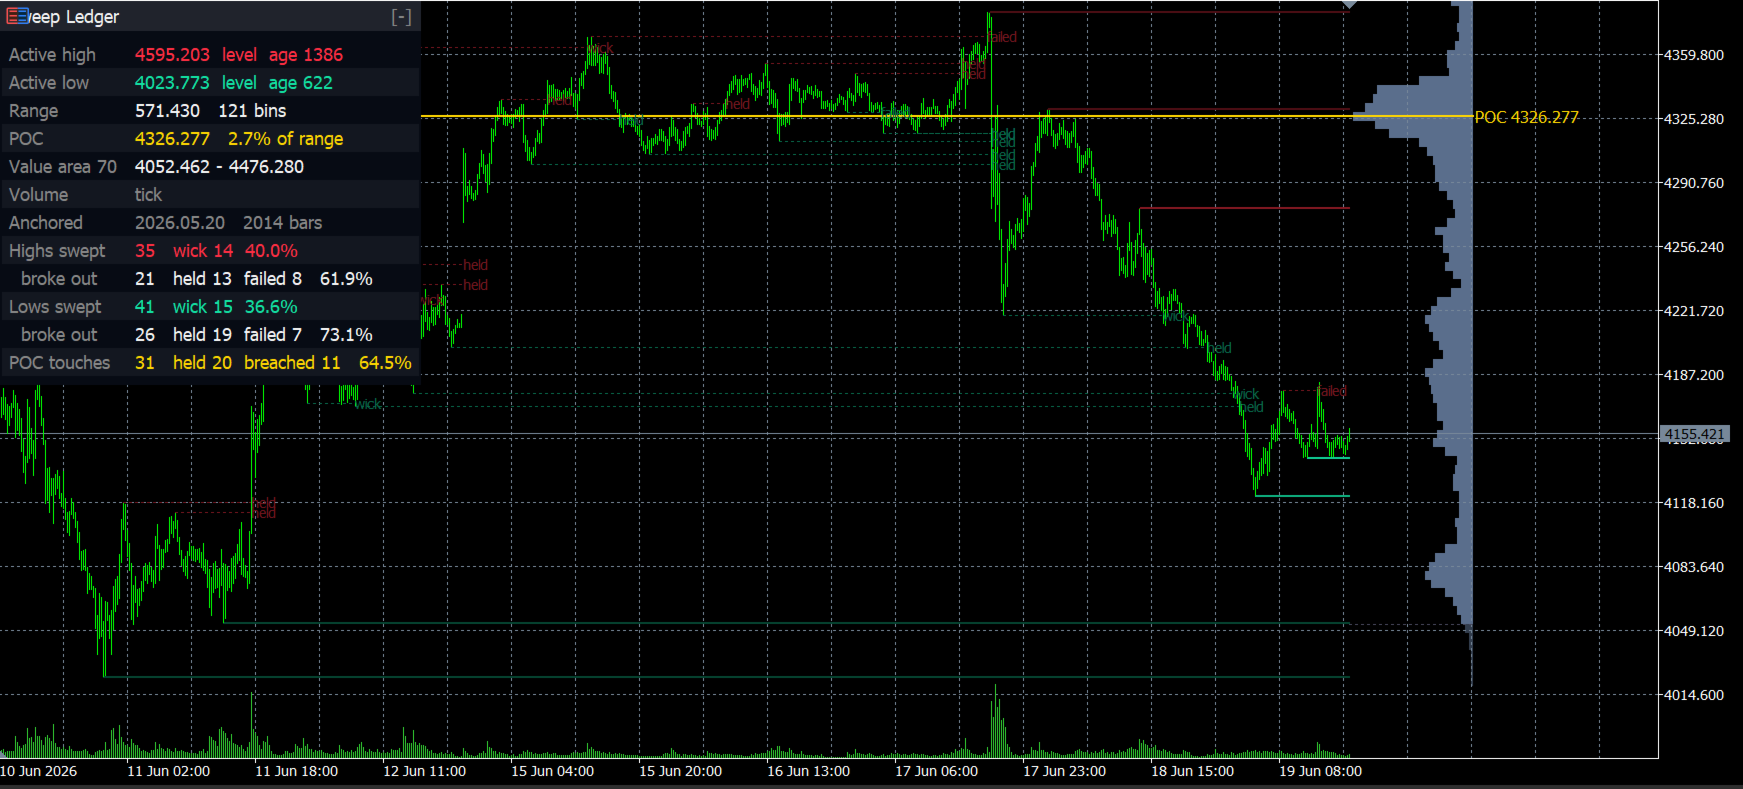
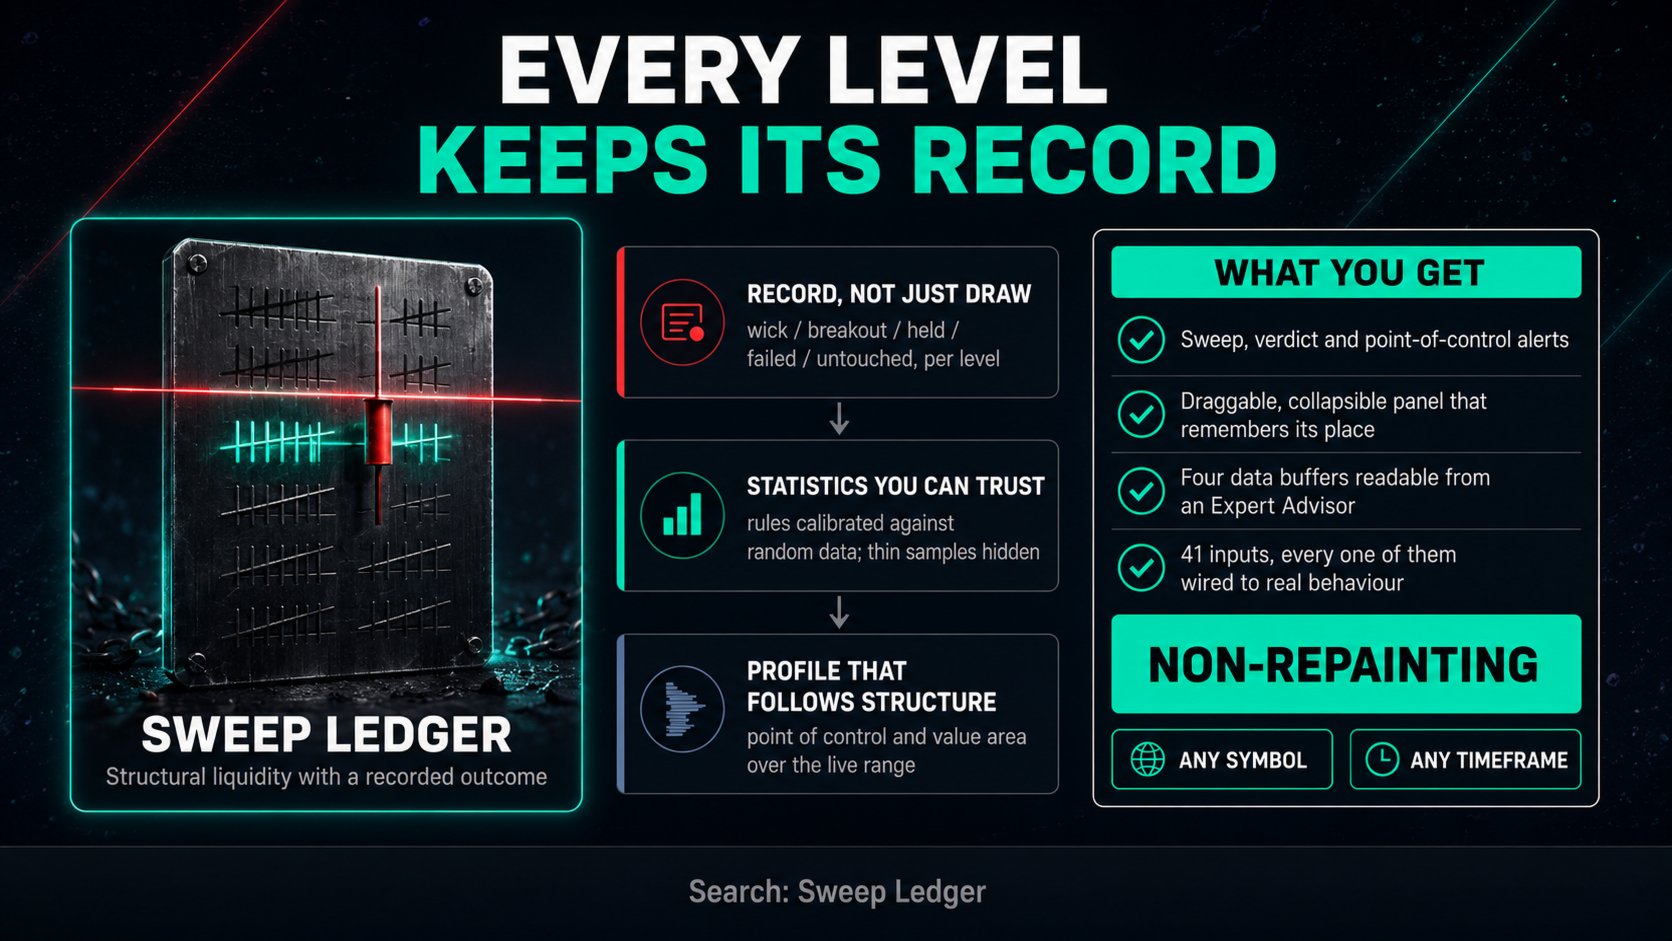
Sweep Ledger keeps a record. Every structural high and low it draws carries an
outcome: whether price only wicked through it, or actually closed beyond it, and
whether that breakout was still holding a fixed number of bars later. The running
tally sits on the panel, so you can see how levels on this symbol and this
timeframe have actually behaved before you commit to the next one.


What Gets Recorded

A level is created only after a swing high or low is confirmed by a fixed number
of bars on both sides, so it cannot appear retroactively. From then on it is
tracked until something happens to it, and the result is written once and never
revised.

Wick. Price pushed past the level intrabar but the bar closed back inside.
Breakout. The bar closed beyond the level, which starts a fixed verdict horizon.
Held. At the end of that horizon price was still beyond the level.
Failed. By the end of the horizon price was back inside.
Untouched. The level was never reached while it existed.

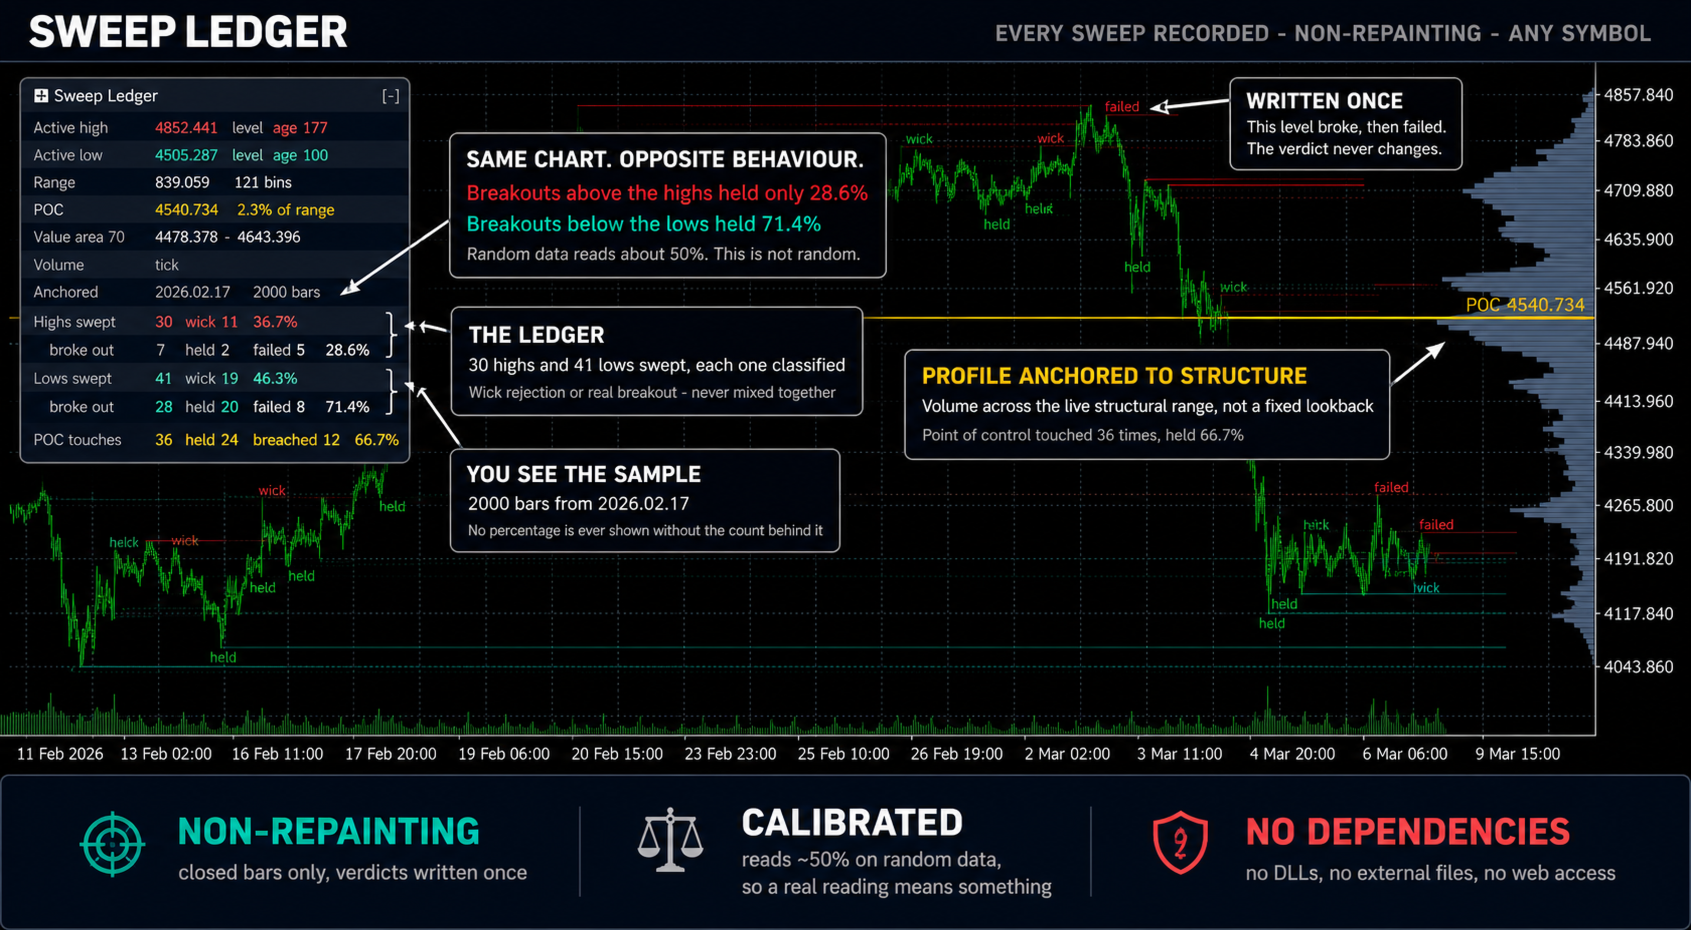
The panel shows the counts and the rates per side, for highs and lows separately.
A breakout whose horizon has not elapsed is counted as pending and is excluded
from the rates, so a decided outcome is never mixed with an undecided one.


The Statistics Are Calibrated, Not Just Computed

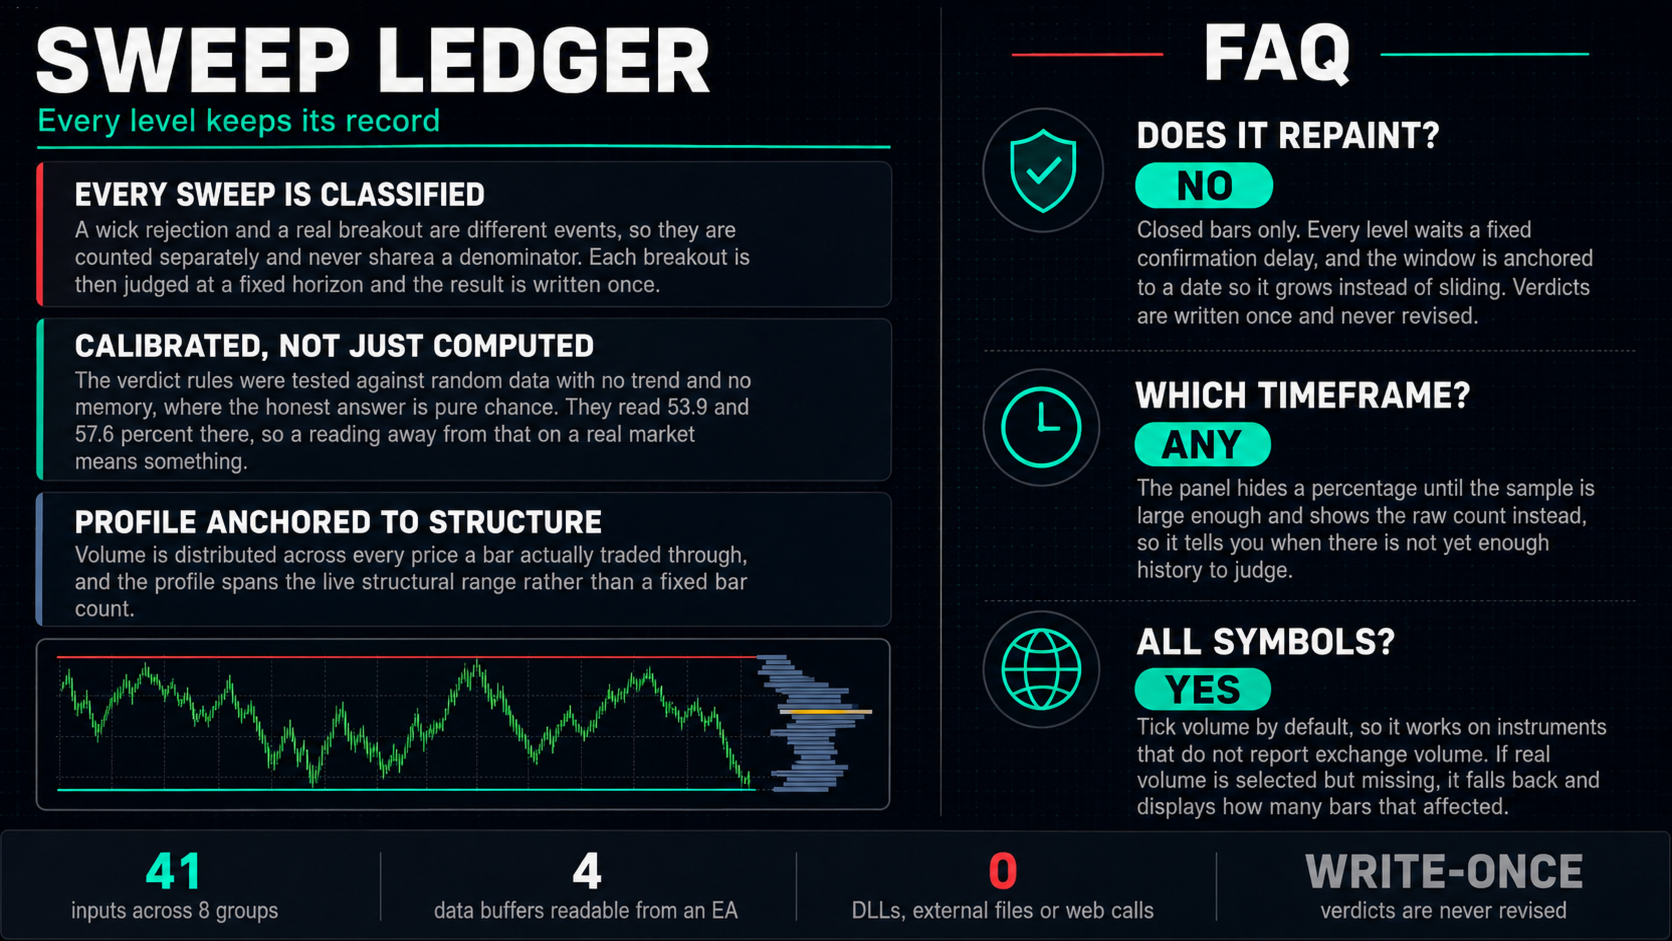
Any rule that scores two outcomes can be built so that one of them is easier to
reach, and it will then report an impressive number that means nothing. The
verdict rules here were checked against synthetic random data with no trend and
no memory, where the honest answer is close to a coin flip. The follow-through
rate reads 53.9 percent on that data and the point of control hold rate reads
57.6 percent, both close enough to neutral that a reading away from those levels
on a real market carries information.

Two consequences you can see in the product. First, wick rejections and breakouts
are counted separately and never share a denominator, because they are different
events. Second, a percentage is withheld entirely until the sample is large
enough, and the raw count is shown instead. A rate computed from a handful of
samples is indistinguishable from chance, and showing it as a percentage would
invite you to trade on noise.


Structural Volume Profile

The profile is built between the currently active structural high and low rather
than over a fixed bar count, so it describes the range the market is actually
working in. Each bar of volume is distributed across every price bin its range
covers, weighted by overlap, instead of being dumped into the bin holding its
close, which would invent a volume spike at the close of every wide bar.

The point of control and the value area are derived from that profile and drawn
to the right of price. Point of control touches get their own small ledger, with
the level frozen at the moment of the touch so the recorded outcome cannot drift
as the profile keeps filling.

If a symbol reports no real volume while the real volume source is selected, the
indicator falls back to tick volume, counts how many bars that affected, and
displays the count. A core feature that degrades silently is worse than one that
says so.


Non-Repainting, And Why

Three things enforce it rather than one claim asserting it.

Only closed bars are processed. The bar in progress never contributes to a level,
a sweep, a verdict or a volume bin.

Every level waits for confirmation. A swing is only knowable a fixed number of
bars after it happened, so a level cannot be inserted into the past.

The calculation window is anchored to a date rather than to a bar count. A
window measured backwards from the newest bar slides forward every time a bar
closes, which moves where the calculation began and can therefore change what it
concluded about history. Here the start is pinned for as long as the indicator
stays on the chart, so the window only ever grows and nothing already decided
moves under you. Re-attaching it re-anchors on purpose, so that asking for one
month gives you the most recent month rather than one that ended weeks ago, and
the panel always prints the anchor date and the bar count so you know exactly
what the totals cover. If the chart has not downloaded enough history to give you
the window you asked for, the panel says so rather than quietly handing you a
shorter one.

Underneath all of that, a level is judged only by the bars around it. Its verdict
does not depend on where the window began, so a mark on your chart means the same
thing no matter when you loaded it.


Panel

The panel is draggable and collapsible, and it remembers its position and state
per chart across timeframe changes. Layout is measured from the actual rendered
text rather than assumed, so it stays correct at any font size and on any display
scaling. Every figure on it is counted from the current calculation, never from
whether something initialised successfully.


Alerts

Three independent alerts, each switched separately, and each routable to popup,
push notification or email: a level being swept, a verdict being written, and a
point of control touch resolving. Alerts fire on closed bars only.

Email alerts are sent by the terminal, not by the indicator, so they require
MT5 - Tools - Options - Email to be configured first. Popup and push need no
setup.


Reading It From An Expert Advisor

Four data buffers are exposed through iCustom: the active structural high, the
active structural low, the point of control of the current profile, and the net
count of sweeps on each bar, positive when highs were swept and negative when
lows were. All four draw nothing on the chart.


Parameters

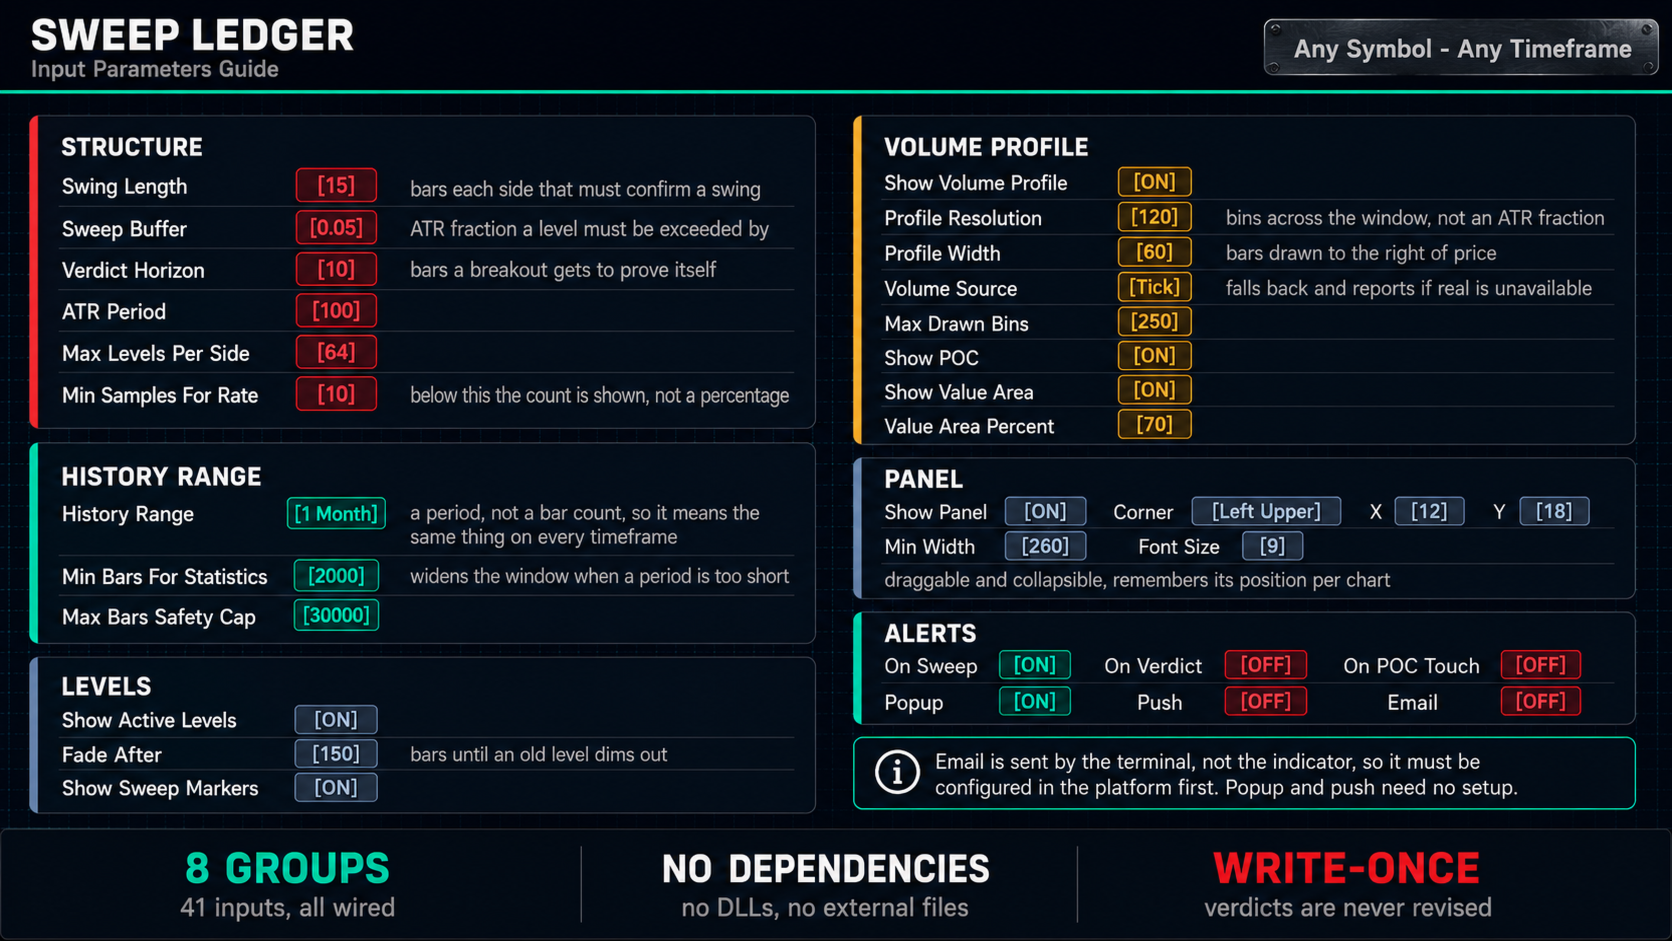
41 inputs in 8 groups. The defaults below are a working starting point.

Structure. Swing Length 15 bars each side, Sweep Buffer 0.05 ATR, Verdict Horizon
10 bars, ATR Period 100, Max Levels Kept Per Side 64, Min Samples Before Showing
Rate 10.

History Range. Range as a period rather than a bar count - 3 Days, 7 Days,
15 Days, 1 Month, 3 Months or All - because a fixed bar count means a completely
different span on M1 than on H4. Min Bars Regardless Of Range 2000, which widens
the window on the higher timeframes, where a month holds 504 bars of H1 and 30 of
D1 - far too few for any rate to clear its sample floor. Max Bars Safety Cap
30000.

Volume Profile. Profile Resolution 120 bins across the window - a bin count
rather than a fraction of volatility, so the resolution is the same on every
symbol and in every regime. Profile Width 60 bars, Volume Source tick or real,
Max Drawn Profile Bins 250, Value Area Percent 70, and switches for the profile,
the point of control and the value area.

Levels. Show Active Levels, Fade After 150 bars, Show Sweep Markers.

Panel, Colors, Alerts, Diagnostics. Panel corner, position, minimum width and
font size; the full colour set; the three alerts and their three delivery
methods; and a diagnostics log switch that reports per-pass counts when you are
tuning.


Usage

Start by leaving the defaults alone and reading the panel rather than the chart.
Give it enough history for the counts to mean something. The rates stay hidden as
raw counts until the sample reaches the minimum, which is the signal that the
numbers are not yet worth acting on.

What you are looking for is a side that behaves differently from a coin flip on
your instrument and timeframe. A high follow-through rate on one side says
breakouts there tend to continue; a low one says they tend to get faded. Both are
tradeable, in opposite directions, and both are visible before you take the trade
rather than after.

Swing Length sets what counts as structural. Larger values track fewer, more
significant levels; smaller values track more of them. Verdict Horizon sets how
long a breakout is given to prove itself, and it should reflect how long you
would actually hold a trade.


Compatibility

MetaTrader 5, any symbol, any timeframe. Uses tick volume by default so it works
on instruments that do not report exchange volume, with an explicit fallback
counter when real volume is selected but unavailable. No DLLs, no external files,
no internet access, and no dependence on any other indicator.


Support

For questions and support, please use the comments section of this product page
or contact the author through the MQL5 messaging system.
Produtos recomendados
Overview Harmonic Patterns MT5 is a technical analysis indicator designed for the MetaTrader 5 platform. It identifies and displays harmonic price patterns, such as Butterfly, Cypher, Crab, Bat, Shark, and Gartley, in both bullish and bearish directions. The indicator calculates key price levels, including entry, stop loss, and three take-profit levels, to assist traders in analyzing market movements. Visual elements and customizable alerts enhance usability on the chart. Features Detects six ha
Multi Timeframe Smc Bias Finder Trading in alignment with higher timeframe structure is one of the most consistently profitable habits a trader can build. The difficulty has always been execution: switching between timeframes, manually reading structure, and keeping track of whether the Daily, 4-Hour and 1-Hour are all pointing in the same direction before committing to a position. Multi Timeframe Smc Bias Finder resolves that entirely. Three tools in one indicator: A live multi-timeframe bias d
A Master Edition é uma ferramenta analítica de nível profissional projetada para visualizar a estrutura do mercado através da lente do volume e do fluxo de dinheiro. Ao contrário dos indicadores de volume padrão, esta ferramenta exibe um Perfil de Volume Diário diretamente no seu gráfico, permitindo ver exatamente onde a descoberta de preços ocorreu e onde o "dinheiro inteligente" está posicionado. Esta Master Edition é projetada para clareza e velocidade, apresentando um sistema único de Auto-T
Este é sem dúvida o indicador de reconhecimento automático de formação de preço harmônico mais completo que você pode encontrar para a MetaTrader Platform. Ele detecta 19 padrões diferentes, leva as projeções de Fibonacci tão a sério quanto você, exibe a Zona de Reversão Potencial (PRZ) e encontra níveis adequados de stop loss e take-profit. [ Guia de instalação | Guia de atualização | Solução de problemas | FAQ | Todos os produtos ] Detecta 19 formações harmônicas de preços diferentes Traça
Description The indicator uses market profile theory to show the most relevant trading zones, on a daily basis. The zones to be shown are LVN (low volume nodes) and POC (point of control). An LVN zone is one which represents price areas with the least time or volume throughout the day. Typically, these areas indicate a supply or demand initiative, and in the future, they can turn into important breakout or retracement zones. A POC zone is one which represents price areas with the most time or vo
Weis Wave Scouter
Jean Carlos Martins Roso
Descubra o poder da análise avançada de volume com o Weis Wave Scouter, um indicador revolucionário para MetaTrader 5 que combina os princípios consagrados do método Wyckoff e da análise VSA (Volume Spread Analysis). Desenvolvido para traders que buscam precisão e profundidade em suas operações, este indicador oferece uma leitura tática do mercado por meio da análise de ondas de volume cumulativo, ajudando a identificar pontos-chave de reversão e continuação de tendência. O Weis Wave Scouter a
Smart ATR Grid Pro
Syamsurizal Dimjati
SMART ATR GRID PRO++ – Adaptive Grid Intelligence Suite is a next-generation, institutional-grade grid trading indicator engineered for traders who demand precision, adaptability, and comprehensive market structure analysis. By seamlessly integrating   Adaptive Volatility Grid System ,   KAMA Candle Trend Filtering ,   Multi-Factor Trend Detection (ADX + EMA20/50) ,   Dynamic Heatmap Zone Engine , and   Real-Time Market Regime Classification , this indicator delivers a complete decision-making
No Demand No Supply MT5
Trade The Volume Waves Single Member P.C.
No Demand No Supply   This indicator identifies   No Demand –No Supply candles to your chart and plots volume bars colored according to the signal. It can be applied to all timeframes or to a specific one only. It can also be used as regular volume indicator  with exceptional future of WEIGHTED VOLUME. Furthermore is has an alert notification, sound and email when a signals occurs. The indicator does not repaint but the alert will come on two candles back due to the definition of No Demand No Su
Was: $249  Now: $99   Market Profile defines a number of day types that can help the trader to determine market behaviour. A key feature is the Value Area, representing the range of price action where 70% of trading took place. Understanding the Value Area can give traders valuable insight into market direction and establish the higher odds trade. It is an excellent addition to any system you may be using. Inspired by Jim Dalton’s book “Mind Over Markets”, this indicator is designed to suit the
O WaveTrend Oscillator MT5 é um poderoso indicador de trading projetado para aprimorar sua análise de mercado ao identificar mudanças de momentum e potenciais reversões de tendência. Ideal para traders de todos os níveis, essa ferramenta oferece insights valiosos sobre condições de sobrecompra e sobrevenda em vários mercados, incluindo forex, criptomoedas e commodities. Com sua capacidade de gerar sinais de compra e venda precisos, o WaveTrend Oscillator MT5 capacita os traders a tomarem decisõe
TRI Visualizer
Yoshimi Mon 三 Ura
TRI Visualizer MT5 – Thermodynamic Market Analysis Overview The TRI (Thermal Range Indicator) Visualizer Enhanced is a rare market analysis indicator that goes beyond conventional technical analysis, applying principles of thermodynamics from physics. It interprets market price fluctuations as “thermodynamic energy,” enabling the highly accurate detection of subtle market changes that are often overlooked. Innovative Mechanisms 1. Dual Calculation Engines Classic TRI Mode Formula: |Close
UR Gamma MT5
Krzysztof Jan Debski
UR Gama (alimentado por cálculos semelhantes encontrados em sistemas de aprendizado de máquina) O UR Gamma é uma ferramenta de análise financeira de ponta que oferece uma visão nova e aprimorada do clássico indicador WaveTrend. Ao incorporar técnicas avançadas de Processamento de Sinal Digital, o UR Gamma aborda algumas das limitações dos algoritmos WaveTrend tradicionais e fornece uma abordagem mais precisa, robusta e dinâmica para identificar e medir tendências na ação do preço. Vantagens d
Wapv Price and volume
Eduardo Da Costa Custodio Santos
O Indicador WAPV Price and Volume para MT5 faz parte do conjunto de ferramentas do (Wyckoff Academy Wave Market) e ( Wyckoff Academy Price and Volume). O Indicador WAPV Price and Volume para MT5 foi criado para facilitar a visualização da movimentação do volume  no gráfico de forma intuitiva. Com ele você pode observar os momentos de pico de volume e momentos em que o mercado não tem interesse profissional Identificar momentos que o Mercado esta se movimentando por inércia e não por moviment
Wolfe Waves são padrões de negociação naturais presentes em todos os mercados financeiros e representam uma luta por um preço de equilíbrio. Esses padrões podem se desenvolver em prazos de curto e longo prazo e são um dos padrões de reversão preditiva mais confiáveis existentes, normalmente precedendo movimentos de preços fortes e longos. [ Guia de instalação | Guia de atualização | Solução de problemas | FAQ | Todos os produtos ] Sinais de negociação claros Surpreendentemente fácil de negociar
Monster Harmonics Indicator is a harmonic pattern indicator. It recognizes Gartley, Bat, Crab, Butterfly, Cypher, White Swan, Black Swan, Shark and AB=CD patterns. Projected patterns that are not yet completed are recognized, too. Monster even shows the PRZ (Potential Reversal Zone). Users can add their own user defined patterns to Monster. Besides the current pattern, Monster also shows all patterns in the symbols history. Monster will provide alerts for developing patterns. Introduced by H.M.
Cumulative Volume Delta MA-X MTF (com Momento de Gradiente) Este indicador realiza uma análise multi-timeframe do Delta de Volume Acumulado (CVD) para o MetaTrader 5. Ele calcula a diferença líquida entre a pressão de compra e venda analisando dados de volume real ou de ticks , fornecendo uma representação visual do sentimento do fluxo de ordens. Lógica e Recursos do Indicador O indicador utiliza uma abordagem matemática para a análise de volume: Origem dos Dados: Suporta tanto Volume Real (par
Triangle Pattern Gann v3.1 - Complete Feature Documentation Core Functionality OverviewTriangle Pattern Gann v3.1 is a sophisticated MetaTrader 5 indicator that combines W.D. Gann's geometric trading principles with advanced triangle pattern recognition to deliver actionable trading signals. Primary Features1. Triangle Pattern Detection SystemAscending Triangle Recognition Function: Automatically identifies bullish continuation patterns Detection Criteria: Flat horizontal resistance line
Flow Architect
Alex Amuyunzu Raymond
Flow Architect Lite - Professional Market Structure Toolkit Free Version Features: Core Structure Analysis: Daily VWAP Engine   - Volume-weighted average price for institutional level tracking Standard Deviation Bands (SD1)   - Dynamic support and resistance zones Break of Structure Detection   - Visual markers for market structure shifts Fair Value Gap Identification   - Highlighted imbalance zones on your charts ATR Volatility Context   - Real-time Average True Range measurement Clean Informat
Volume Delta Candle
Muhammad Muzaffar Hussan
Volume Delta Candles: A Comprehensive Tool for In-Depth Trading Analysis Unlock a seamless way to interpret trading experience within each candle. With Volume Delta Candles, there's no need for additional volume indicators—everything you need is built in. This advanced tool utilizes lower timeframes or live market data to present the percentage of buying versus selling volume within each candle as an intuitive color-coded bar. Before diving in, ensure you’re familiar with Volume and Volume Delta
Portuguese (Brazilian) Explicação das Vantagens (Sem mencionar o código) 1. Diferenciação Detalhada do Mercado (3 Dimensões) Esta ferramenta isola especificamente o movimento "Lateral" (Sideways) . O trader vê: Força de compra (Touros). Força de venda (Ursos). Importante: Quando o mercado está sem direção, evitando entradas falsas. 2. Oscilador de Força (0-100) Zonas Extremas: Define sobrecompra e sobrevenda. Preenchimento de Área: Colore as zonas críticas para fácil visualização. 3. Filtragem d
Renko Plus
Eadvisors Software Inc.
Com o Renko Plus você consegue utilizar os recursos na funcionalidade Indicador, basta adicioná-lo ao gráfico do Metatrader5.             O gráfico Renko é um tipo de gráfico, desenvolvido pelos japoneses, que é construído usando o movimento de preços em vez de preços e intervalos de tempo padronizados, como a maioria dos gráficos. Acredita-se que tenha o nome da palavra japonesa para tijolos, "renga", já que o gráfico se parece com uma série de tijolos.             Um novo tijolo
PriceMagnet Volume Profile Stop guessing where the smart money is sitting. See it. PriceMagnet Volume Profile is a precision volume-analysis indicator built for MetaTrader 5 traders who want to trade with institutional context instead of guesswork. Rather than plotting volume as a flat bar under your chart, PriceMagnet reconstructs a full horizontal volume histogram directly on price — showing you exactly which price levels attracted the most trading activity over your selected lookback window,
Price Magnet — Price Density and Attraction Levels Indicator Price Magnet is a professional analytical tool designed to identify key support and resistance levels based on statistical Price Density. The indicator analyzes a specified historical period and detects price levels where the market spent the most time. These zones act as “magnets,” attracting price action or forming a structural base for potential reversals. Unlike traditional Volume Profile tools, Price Magnet focuses on price-time d
Indicador Padroes de Reversao para Candles
SMART2TRADER SOLUCOES DE SOFTWARES INTELIGENTES LTDA
Desenvolvido pela Smart Trader - Smart Reversion Pattern é um indicador capaz de identificar padrões de reversão , tanto reversões de alta quanto reversões de baixa. Ele foi desenhado para fornecer um rápido conhecimento dos padrões, em tempo real. Também pensamos na parte de interface, criando um visual limpo e agradável para identificar no gráfico os padrões de formação. Obs: Caso algum padrão que você precise não esteja listado, basta entrar em contato conosco e solicitar a inclusão - geralme
The Accumulation / Distribution is an indicator which was essentially designed to measure underlying supply and demand. It accomplishes this by trying to determine whether traders are actually accumulating (buying) or distributing (selling). This indicator should be more accurate than other default MT5 AD indicator for measuring buy/sell pressure by volume, identifying trend change through divergence and calculating Accumulation/Distribution (A/D) level. Application: - Buy/sell pressure: above
Passband Filter Pro Passband Filter Pro is a trend and cycle oscillator for MetaTrader 5. It is built on the Ehlers Super Passband Filter, a band pass filter that removes long term trend drift and short term noise so that only the dominant market cycle remains. The result is a clean oscillator with a color cloud that shows overbought and oversold conditions, cycle turns, and momentum on forex, gold, indices, stocks and crypto. Most traders enter too early or too late. Simple moving averages la
The Super Arrow Indicator provides non-repainting buy and sell signals with exceptional accuracy. Key Features No repainting – confirmed signals remain fixed Clear visual arrows: green for buy, red for sell Real-time alerts via pop-up, sound, and optional email Clean chart view with no unnecessary clutter Works on all markets: Forex, gold, oil, indices, crypto Adjustable Parameters TimeFrame Default:   "current time frame" Function:   Sets the time frame for indicator calculation Options:   Can
WAPV Weis Wave Chart Forex
Eduardo Da Costa Custodio Santos
O Weis Wave Chart Forex para MT 5 é um um indicador de Preço e Volume. A leitura de Preço e Volume foi amplamente divulgada através de Richard Demille Wyckoff com base nas três leis criadas por ele: Oferta e Demanda, Causa e Efeito e Esforço x Resultado. Em 1900 R.Wyckoff já utilizava o gráfico de Ondas em suas análises. Muitos anos depois, por volta de 1990 , David Weis Automatizou o gráfico de ondas de R. Wyckoff e hoje nós trazemos a evolução do gráfico de ondas de David Weis. Ele mostra
"Impulses and Corrections 5" is created to help traders navigate the market situation. The indicator shows multi-time frame upward and downward "Impulses" of price movements. These impulses are the basis for determining the "Base" , which is composed of zones of corrections of price movements, as well as "Potential" zones for possible scenarios of price movement. Up and down impulses are determined based on a modified formula of Bill Williams' "Fractals" indicator. The last impulse is always "U
WBS SMC Without Repaint – Ultimate XAUUSD Scalping Engine (M5 Timeframe) Take your Gold trading to the institutional level with "WBS SMC Without Repaint", a highly advanced premium indicator engineered specifically for XAUUSD (Gold) on the M5 (5-Minute) timeframe.  Built upon the core pillars of Smart Money Concepts (SMC) combined with precise algorithmic candle pattern recognition, this tool identifies high-probability institutional footprints in real-time. Best of all: 100% ABSOLUTELY
Os compradores deste produto também adquirem
Este produto foi atualizado para o mercado de 2026 e otimizado para as versões mais recentes do MT5. AVISO DE ATUALIZAÇÃO DE PREÇO: Smart Trend Trading System está atualmente disponível por $99 . O preço aumentará para $199 após as próximas 30 compras . OFERTA ESPECIAL: Após comprar o Smart Trend Trading System, envie-me uma mensagem privada para receber o Smart Universal EA GRÁTIS e transformar seus sinais do Smart Trend em operações automatizadas. Smart Trend Trading System é um sistema de tr
Trend Sniper X
Sarvarbek Abduvoxobov
5 (11)
Trend Sniper X é um indicador de acompanhamento de tendência multi-timeframe para MetaTrader 5 que ajuda os traders a identificar a direção da tendência e potenciais pontos de reversão com clareza e precisão. Informações de preço: O preço atual é promocional e está sujeito a alterações à medida que futuras atualizações e novos recursos forem lançados. Canal Code2Profit Domine o mercado com análise de múltiplos tempos gráficos! Como maximizar sua taxa de acerto com o Trend Sniper X: Regras princi
Divergence Bomber
Ihor Otkydach
4.89 (94)
De vez em quando, faço transações pessoalmente com este sistema. Avalia a minha estratégia de trading manual «BOMBER» numa conta real - LIVE SIGNAL Cada comprador deste indicador recebe adicionalmente, e de forma gratuita: A ferramenta exclusiva "Bomber Utility", que acompanha automaticamente cada operação, define os níveis de Stop Loss e Take Profit e fecha operações de acordo com as regras da estratégia; Arquivos de configuração (set files) para ajustar o indicador em diferentes ativos; Set f
Neuro Poseidon MT5
Daria Rezueva
4.85 (54)
Neuro Poseidon is a new indicator by Daria Rezueva. It combines precise trading signals with adaptive TP/SL levels - creating best possible trades as a result! Message me and get  Neuro Poseidon Assistant  as a gift to automize your trading process! What makes it stand out? 1. Proven profitability on all assets and timeframes 2. Only confirmed BUY and SELL signals present on the chart 3. Adaptive TP & SL levels generated by the software for each trade 4. Easy to understand - suitable for al
Welcome to ENTRY IN THE ZONE AND SMC MULTI TIMEFRAME Entry In The Zone and SMC Multi Timeframe is a real-time market analysis tool based on Smart Money Concepts (SMC), designed to analyze market structure, price direction, and key trading zones. It supports both Single-Timeframe Analysis and Multi-Timeframe Analysis, providing a clearer view of the overall market structure across multiple timeframes, with real-time BUY / SELL signals that do not repaint. It is designed to help filter trading opp
SuperScalp Pro
Van Minh Nguyen
4.61 (31)
SuperScalp Pro – Sistema Profissional de Scalping com Confluência Multicamadas SuperScalp Pro é um sistema profissional de scalping com confluência em múltiplas camadas, desenvolvido para ajudar os traders a identificar oportunidades de maior probabilidade com confirmações de entrada mais claras, níveis de Stop Loss e Take Profit baseados no ATR e filtragem flexível de sinais para XAUUSD, BTCUSD e os principais pares de Forex. Acesse os arquivos de configuração otimizados para XAUUSD, BTCUSD, pa
A lenda está de volta: Entry Points Pro 10. O relançamento do lendário indicador que se manteve por 3 anos no Top-3 do MQL5 Market. Centenas de avaliações entusiasmadas (589 nas duas versões), milhares de traders operam com ele todos os dias, 31.000+ downloads da versão demo   MT4+MT5 . Li cada avaliação de vocês ao longo de cinco anos — e, em vez de promessas, coloquei as respostas dentro da versão 10. Do autor que está no mercado desde 1999 e valoriza a honestidade, a própria reputação e os se
Vamos ser honestos primeiro. Nenhum indicador sozinho vai te tornar lucrativo. Se alguém te disser o contrário, está te vendendo um sonho. Qualquer indicador que mostre setas perfeitas de compra/venda pode ser feito para parecer impecável — basta dar zoom na parte certa da história e tirar um print das operações vencedoras. Nós não fazemos isso.  SMC Intraday Formula é uma ferramenta. Ela lê a estrutura do mercado para você, identifica as zonas de maior probabilidade de preço e mostra exatament
M1 Sniper MT5
Oleg Rodin
5 (6)
O   M1 SNIPER   é um sistema indicador de negociação fácil de usar. É um indicador de seta projetado para o período M1. O indicador pode ser usado como um sistema independente para scalping no período M1 e pode ser usado como parte do seu sistema de negociação existente. Embora este sistema de negociação tenha sido projetado especificamente para negociação no M1, ele também pode ser usado em outros períodos. Originalmente, desenvolvi este método para negociar XAUUSD e BTCUSD. Mas considero-o úti
O UZFX {SSS} Scalping Smart Signals v4.0 MT5 é um indicador de negociação de alto desempenho, sem repintura, concebido para scalpers, day traders e swing traders que exigem sinais precisos e em tempo real em mercados em rápida evolução. Desenvolvido pela (UZFX-LABS), este indicador combina a análise da ação do preço, a confirmação de tendências e a filtragem inteligente para gerar sinais de compra e venda de alta probabilidade, sinais de alerta e oportunidades de continuação de tendências em tod
Atomic Analyst MT5
Issam Kassas
4.44 (54)
Este produto foi atualizado para o mercado de 2026 e otimizado para as versões mais recentes do MT5. AVISO DE ATUALIZAÇÃO DE PREÇO: Atomic Analyst está atualmente disponível por $99 . O preço aumentará para $199 após as próximas 30 compras . OFERTA ESPECIAL: Após comprar o Atomic Analyst, envie-me uma mensagem privada para receber o Smart Universal EA GRÁTIS e transformar seus sinais do Atomic Analyst em operações automatizadas. Atomic Analyst é um indicador de trading de Price Action sem repa
GoldenX Entry MT5
Kareem Abbas
5 (15)
GoldenX Entry é um indicador para MT5 com um algoritmo adaptativo Smart Entry Trend, um sistema de pontuação de sinais, um detector de regime de mercado e um filtro de volatilidade. Cada sinal inclui um nível de entrada calculado, três níveis de Take-Profit (TP1, TP2, TP3) e um nível de Stop-Loss. Ele é construído sobre múltiplas camadas analíticas projetadas para se adaptar a diferentes condições de mercado, combinando um sistema analítico multicamadas com um otimizador integrado e um sistema d
Superhero
Ihor Otkydach
5 (2)
O indicador SUPERHERO é um sistema de negociação multimoeda concebido numa base «tudo incluído». O indicador analisa o mercado de forma independente e fornece sinais sobre quando abrir e encerrar posições. Utiliza ordens Stop Loss e Take Profit. O rácio R:R é de 1:1. De vez em quando, faço pessoalmente operações com base nos sinais deste sistema, e eis os resultados que obtenho — SINAL EM TEMPO REAL Este sistema pode enviar notificações push para o seu smartphone, para que possa realizar transaç
Session High Low Lines Indicator that plots key intraday reference levels directly on the chart: the previous day's high/low and the current day's high/low, updated automatically as the new day forms. An optional previous week high/low can also be displayed. These levels are widely used as reference points for potential support and resistance zones, breakout confirmation, and range context during a trading session. Features Previous day High/Low lines Current day High/Low lines (updates in real
Zoryk Gold
Reda El Koutbane
5 (6)
O desconto termina em 24 horas — próximo preço $ 69 ZORYK — Sistema avançado de sinais para XAUUSD no MetaTrader 5 Você conhece essa sensação. Você passa muito tempo analisando o ouro. Espera pela entrada certa. Finalmente abre a operação e o preço começa imediatamente a se mover contra você. Você fecha cedo demais, move o Stop Loss ou hesita por alguns segundos. Depois disso, o mercado alcança exatamente o destino que você esperava originalmente, mas sem você dentro da operação. O problema ne
Gann Made Easy   é um sistema de negociação Forex profissional e fácil de usar, baseado nos melhores princípios de negociação usando a teoria do sr. W. D. Gann. O indicador fornece sinais precisos de COMPRA e VENDA, incluindo níveis de Stop Loss e Take Profit. Você pode negociar mesmo em movimento usando notificações PUSH. Entre em contato comigo após a compra para receber instruções de negociação e ótimos indicadores extras gratuitamente! Provavelmente você já ouviu muitas vezes sobre os método
Axiom Matrix
Issam Kassas
5 (6)
AXIOM MATRIX MT5 PREÇO DE LANÇAMENTO: $99 Axiom Matrix está disponível pelo preço de lançamento de $99. O preço aumentará para $199 após as primeiras 30 compras. Após a sua compra, envie-me uma mensagem direta para receber as instruções e reivindicar o seu bônus exclusivo de presente. Axiom Matrix é um scanner de mercado profissional multissímbolo e multitimeframe, além de um painel de decisão para MetaTrader 5. Ele escaneia o seu Market Watch, analisa múltiplos timeframes, lê múltiplos motores
SkyHammer Signal Pro Indicador profissional de sinais de tendência sem repaint, com níveis Entry, SL e TP bloqueados SkyHammer Signal Pro é um indicador estruturado de tendência e momentum, desenvolvido para traders que procuram sinais claros, fixos e verificáveis. Funciona melhor em timeframes baixos, como M1 e M5 . O indicador não tenta prever topos ou fundos do mercado. Em vez disso, ele aguarda estrutura de mercado confirmada, direção de tendência, força de momentum, volatilidade saudável e
The Oracle Pro
Ottaviano De Cicco
5 (1)
The Oracle Pro: Motor de Viés Multi-Timeframe Sintético para MT5 ️ Oferta de Lançamento de Verão — Adquira o The Oracle Pro por USD 199 (primeiros compradores). O preço sobe com a tração; preço final USD 399. The Oracle Pro é um motor de viés multi-timeframe premium para MetaTrader 5, criado para traders exigentes e profissionais. Responde com disciplina a uma pergunta: qual é o viés direcional em cada timeframe agora, qual a sua força e quanto os timeframes concordam? Tudo é calculado apenas e
Crystal Heikin Ashi Signals
Muhammad Jawad Shabir
5 (3)
Crystal Heikin Ashi Signals - Professional Trend & Signal Detection Indicator Advanced Heikin Ashi Visualization with Intelligent Signal System for Manual & Automated Trading Final Price: $149 ---------> Price goes up $10 after every 10 sales . Limited slots available — act fast . Overview Crystal Heikin Ashi Signals is a professional-grade MetaTrader 5 indicator that combines pure Heikin Ashi candle visualization with an advanced momentum-shift detection system. Designed for both manual traders

Currency Strength Wizard   é um indicador muito poderoso que fornece uma solução completa para uma negociação bem-sucedida. O indicador calcula o poder deste ou daquele par forex usando os dados de todas as moedas em vários intervalos de tempo. Esses dados são representados em uma forma de índice de moeda fácil de usar e linhas de energia de moeda que você pode usar para ver o poder desta ou daquela moeda. Tudo o que você precisa é anexar o indicador ao gráfico que deseja negociar e o indicador

Azimuth Pro
Ottaviano De Cicco
5 (7)
Azimuth Pro V2: Estrutura Fractal Sintética e Entradas Confirmadas para MT5 Visão geral Azimuth Pro é um indicador de estrutura swing multinível da Merkava Labs . Quatro camadas de swing aninhadas, VWAP ancorado em swings, detecção de padrões ABC, filtragem estrutural de três timeframes e entradas confirmadas em barra fechada — um gráfico, um fluxo de trabalho dos micro-swings aos macro-ciclos. Este não é um produto de sinais cegos. É um fluxo de trabalho baseado em estrutura para traders que v
Trend Catcher ind mt5
Ramil Minniakhmetov
5 (18)
INDICADOR TREND CATCHER O Indicador Trend Catcher analisa os movimentos de preços do mercado, utilizando uma combinação de indicadores de análise de tendências adaptativos, proprietários e personalizados pelo autor. Identifica a verdadeira direção do mercado, filtrando o ruído de curto prazo e focando a força do momentum subjacente, a expansão da volatilidade e o comportamento da estrutura de preços. Utiliza também uma combinação de indicadores personalizados de suavização e filtragem de tendê
FiboSniper Pro
Van Minh Nguyen
5 (1)
FiboSniper Pro – Sistema Profissional de Trading com Grid de Fibonacci e Múltiplos Filtros FiboSniper Pro é um sistema avançado de indicadores de análise técnica que combina Fibonacci Envelopes com filtros multicamadas, incluindo ADX, EMA, RSI, ATR e filtros de horário, ajudando a identificar oportunidades de entrada filtradas, além de níveis automáticos de Stop Loss e Take Profit baseados na volatilidade do ATR. Foi desenvolvido especificamente para traders que utilizam estratégias de scalping
Reversion King Indicator
Eugen-alexandru Zibileanu
5 (6)
Um novo Rei chegou à cidade - Indicador + Gestão de Ordens (TP1 + TP2 + TP3) + Enviador opcional de sinais para Telegram INCLUÍDO (GRÁTIS) (SISTEMA COMPLETO DE TRADING e SINAIS) Nosso melhor EA para Ouro: Gold Slayer Este indicador inclui uma estratégia avançada, um sistema de trading com gestão de ordens personalizável e um sistema de reversão à média que combina extensões de envelopes, apoiado por múltiplos filtros inteligentes de confirmação, como o RSI, para capturar entradas de reversão de
Este produto foi atualizado para o mercado de 2026 e otimizado para as versões mais recentes do MT5. AVISO DE ATUALIZAÇÃO DE PREÇO: Smart Price Action Concepts está atualmente disponível por $200 . O preço aumentará para $299 após as próximas 30 compras . OFERTA ESPECIAL: Após comprar, envie-me uma mensagem privada para receber Bônus grátis + Presente . Antes de tudo, vale destacar que esta ferramenta de trading é um indicador sem repaint, sem redesenho e sem atraso, o que a torna ideal para tr
Power Candles MT5
Daniel Stein
5 (9)
Power Candles V3 - Indicador de força com auto-otimização O Power Candles V3 transforma a força da moeda e do instrumento num plano de negociação prático em todos os gráficos aos quais está associado. Em vez de se limitar a colorir as velas, executa uma otimização automática em tempo real em segundo plano e apresenta-lhe os melhores valores de Stop Loss, Take Profit e limiar de sinal para o símbolo em questão. Basta um clique para o adotar na negociação em tempo real — as linhas de entrada, Stop
Btmm state engine pro
Garry James Goodchild
5 (4)
BTMM State Engine Pro by G-Labs — Beat The Market Maker indicator for MetaTrader 5. Asian session range, London and New York kill zones, level progression (L1/L2/L3), peak formation detection (PFH/PFL), entry signals, and a multi-pair scanner from one chart. Stop scanning charts one pair at a time. The State Engine tracks the BTMM daily cycle automatically — Asian box, room boundaries, level blocks, peak formations, and filtered entries — while the scanner dashboard shows level, peak status, d
M1 Quantum MT5
Hamed Dehgani
4.27 (11)
Sinais de Trading ao Vivo usando o M1 Quantum: Sinal   (Operação executada automaticamente pelo Quantum Trade Assistant , incluído gratuitamente neste produto.) Últimas Notícias : A versão 1.64 foi lançada. Agora, todas as operações têm um Stop Loss colocado atrás das zonas relevantes de Suporte/Resistência. A função Smart Close também foi aprimorada para aumentar o desempenho do EA nesta versão. Desde 9 de agosto, o sinal ao vivo está sendo executado na versão 1.64. Plano de Preços: Preço Atua
Quant Direction MT5
Georgios Kalomoiropoulos
Quant Direction é uma ferramenta de análise de mercado tridimensional. Ela oferece uma análise de mercado totalmente objetiva, baseada em algoritmos, que calcula simultaneamente desvios percentuais precisos em diversos parâmetros. Desenvolvido com ferramentas avançadas de modelagem com inteligência artificial e rigorosamente testado, o algoritmo foi projetado para interpretar o mercado com precisão sem precedentes. Você pode analisar qualquer par de moedas ou instrumento financeiro em sua plataf
Mais do autor
ATR Stop Loss Finder automatically calculates and displays dynamic   stop loss levels on your chart based on the Average True Range   indicator. The tool helps traders place logical, volatility-adjusted   stop loss orders rather than relying on fixed pip values or arbitrary   price levels.   The indicator plots two lines directly on the chart: an upper line   for short positions and a lower line for long positions. Both lines   update in real time with each new bar. A small information panel  
Lion Lightning Scalper: Unleash Your Trading Potential with a Professional-Grade Expert Advisor The Lion Lightning Scalper isn't your average Expert Advisor (EA); it's a powerful, cutting-edge tool designed to meet the needs of traders seeking maximum profitability in the volatile Forex market. Why Choose Lion Lightning Scalper? Superior Speed: With sophisticated trading strategies and lightning-fast market analysis, Lion Lightning Scalper can enter and exit the market in fractions of a second
Apex Market Structure is a complete Smart Money toolkit that maps market   structure, order blocks, liquidity and multi-timeframe trend in real time,   directly on your chart. It is built for traders who read price action the   way institutions do: structure breaks, liquidity sweeps, and reaction zones,   all detected automatically and confirmed at bar close.   Everything is drawn for you. No manual line drawing, no guesswork, no second   indicator needed.   How It Works   The indicator con
Triple Signal HARSI turns the classic Heikin Ashi RSI oscillator into a   complete decision tool by adding three layers of confirmation: a built-in   alert engine, a multi-timeframe dashboard, and automatic divergence   detection. Instead of staring at one oscillator, you get momentum,   higher-timeframe context, and reversal warnings in a single window.   How It Works   The indicator converts a zero-centered RSI into smoothed Heikin Ashi   candles, so momentum shifts appear as clean candle
Vertex Structure Dashboard delivers a complete multi-timeframe market structure analysis in a single, compact panel. It monitors up to 9   timeframes simultaneously and displays trend bias, structural breaks, momentum, and value zones in real time — no tab-switching, no manual   tracking.   The panel is fully draggable and collapsible. Its position persists across timeframe changes through GlobalVariables, so your layout stays   exactly where you placed it.   How It Works   Each enabled tim
Ricochet Burst
Keattisuk Viriyasu
Ricochet is an automated trading system for EURUSD on the M1 timeframe, built   around one simple but powerful idea: a losing trade should not be the end of the   move, it should be the start of the next one.   Most systems take a stop loss and walk away. Ricochet does the opposite. The   moment a trade is stopped out, the engine changes state and fires again in the   direction the market just proved it wanted to go. A failed entry becomes the   trigger for the recovery. That is the Ricochet p
Signal Verdict
Keattisuk Viriyasu
Most traders never actually find out whether the signal they follow makes money. Signal Verdict answers that on your own chart. It replays your entry rule across history, opens and closes a simulated position for every signal, and reports what really came out: win rate, expectancy in R, profit factor, drawdown, and how often each take profit was reached. It is not limited to its own signals. Signal Verdict can read the buffers of any indicator installed on your terminal, so the arrows you are
Precedent RSI
Keattisuk Viriyasu
Precedent RSI answers one question on every bar: when the market last looked like this, what happened next. It turns each bar into an eight part momentum fingerprint, searches settled history for the closest matches, and lets the outcomes those matches actually produced decide the direction. Signals are fixed at bar close and never move afterwards. How It Works Every bar is described by eight readings taken from RSI behaviour rather than from the RSI level alone: value, slope, acceleration,
Understudy
Keattisuk Viriyasu
Understudy shows which market regime you are in, and it tells you when its own machine learning is not good enough to be trusted. Most machine learning indicators ask you to take the model on faith. This one measures itself against a fixed structural baseline on every closed bar and publishes the verdict on the chart. It will tell you, in writing, when it is losing. HOW IT WORKS Two forecasters run side by side. The Principal is a fixed structural model. Its weights never change, so it stay
Filtro:
Sem comentários
Responder ao comentário