Structural Break Scanner
- Утилиты
-
Patrick Murimi Njoroge
 I build robust trading tools for MetaTrader. Browse my free articles to learn, get the premium EAs/indicators on the Market, or hire me for custom coding.
 - Версия: 1.0
- Активации: 5
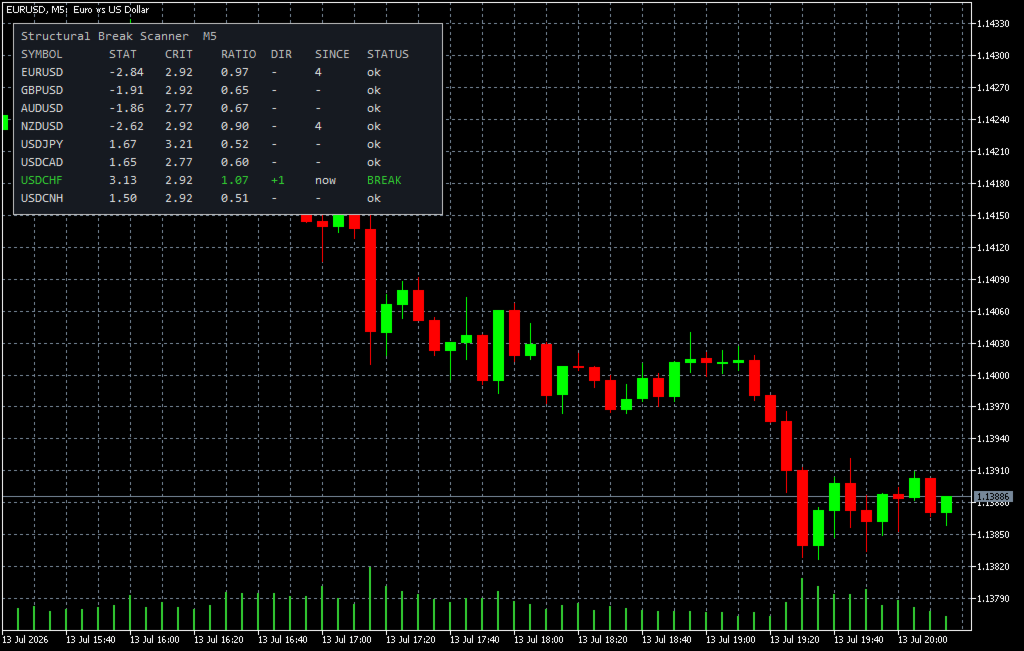
Structural breaks are regime changes in price behavior: sustained drifts and level shifts that invalidate the assumptions behind mean-reversion and trend systems alike. This scanner applies the Chu-Stinchcombe-White (CSW) CUSUM test (Homm and Breitung, 2012) to the log prices of every symbol on your watch list and tells you, at a glance, which markets are currently in a break state, in which direction, and how strong the evidence is relative to the statistical boundary.
The test compares the current log price against every admissible reference point in the evaluation window, standardized by return volatility and the elapsed span, and takes the supremum against the one-sided boundary sqrt(b_alpha + ln(t-n)). The default boundary constant b_alpha = 4.6 corresponds to a 5 percent significance level. This is a statistical monitoring tool: it reports evidence of regime change, and it makes no claim about the profitability of trading that evidence.
Dashboard columns. SYMBOL, STAT (CSW statistic at the supremum), CRIT (boundary at that span), RATIO (statistic over boundary; 1.00 is the signal line), DIR (+1 upward break, -1 downward), SINCE (bars since the most recent break within the backward scan window; “now” while active), STATUS (ok, BREAK, load, bars, flat).
Features.
- Monitors up to 30 symbols from a comma-separated list, on any timeframe, independent of the chart symbol. Empty list scans the chart symbol.
- Timer-driven refresh with a configurable interval; per-symbol error isolation, so one symbol with missing history never blocks the rest.
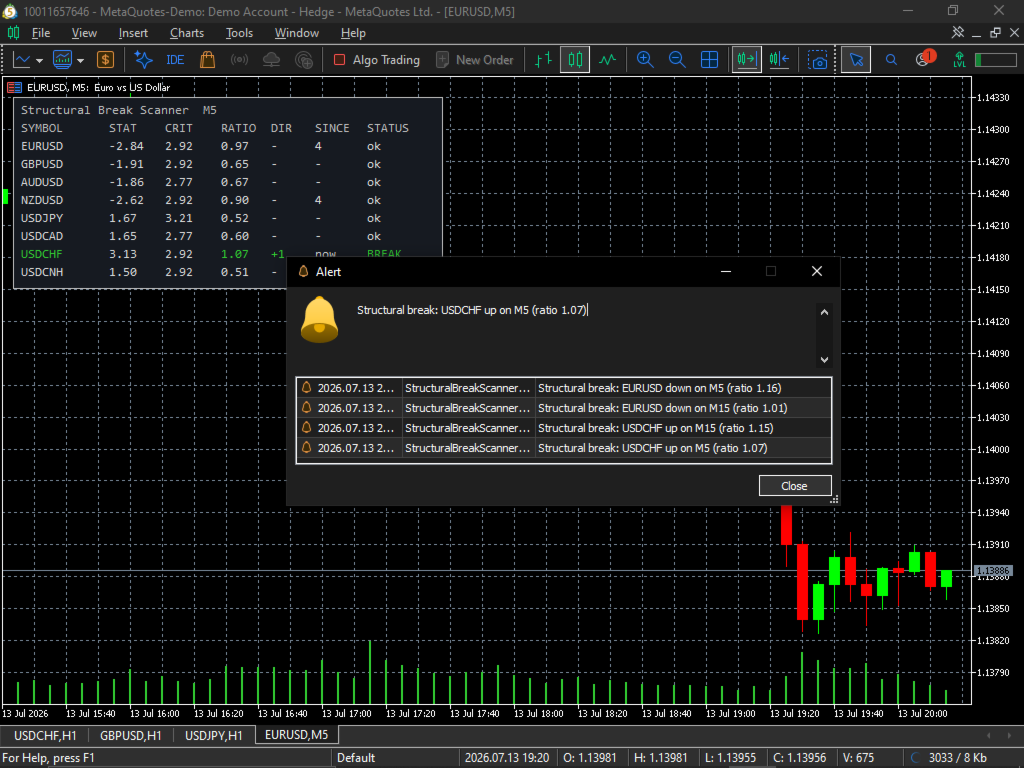
- Alerts on fresh breaks: terminal popup, push notification, and email, each individually switchable, with a per-symbol re-arm interval to prevent alert storms.
- Global signal threshold on the statistic-to-boundary ratio, with optional per-symbol overrides (format SYMBOL:ratio;SYMBOL:ratio).
- Backward scan reports how many bars ago the most recent break fired.
- DPI-aware panel with configurable position, font size, and colors.
- Broker symbols are validated at startup; unavailable names are dropped with a journal message and the scanner falls back to the chart symbol.
Inputs. Scanner: symbol list, timeframe, evaluation window (default 500 bars), completed-bars switch. CUSUM test: minimum span (20), boundary constant (4.6), signal ratio (1.0), per-symbol overrides. History: backward scan depth (96). Refresh: interval in seconds (15). Alerts: popup/push/email switches, re-arm minutes (60). Panel: position, font size, five colors.
Method reference. Homm, U. and Breitung, J. (2012), “Testing for Speculative Bubbles in Stock Markets: A Comparison of Alternative Methods”, Journal of Financial Econometrics. The test is also discussed in Lopez de Prado, “Advances in Financial Machine Learning” (2018), chapter 17. Note the supremum over reference points is subject to multiple-testing inflation; treat the ratio as evidence strength, not as a calibrated p-value.