• Обзор
  • Отзывы
  • Обсуждение (4)
  • Что нового

Easy BUY SELL signal 001

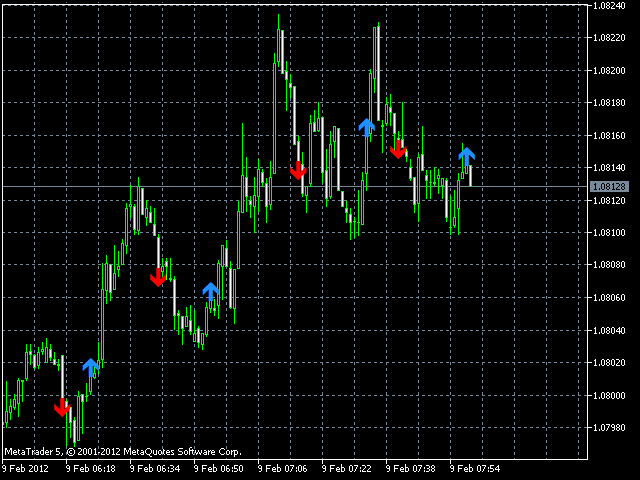
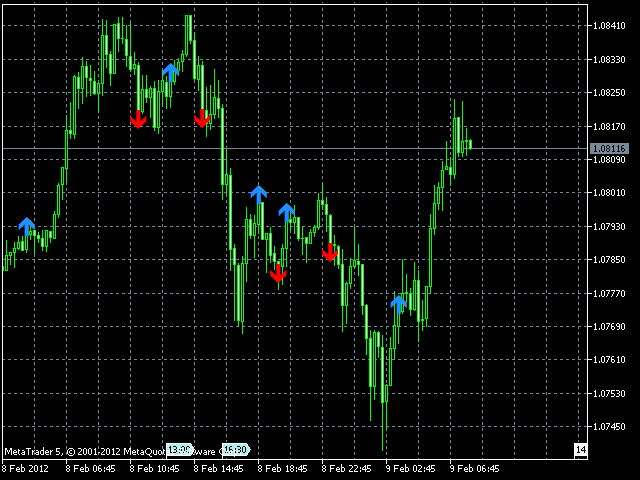
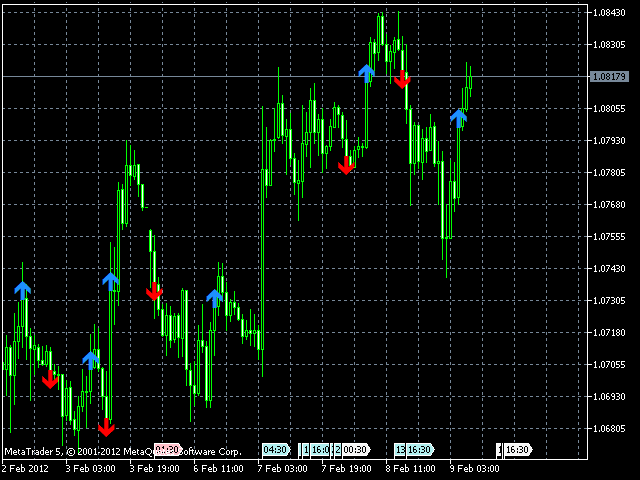
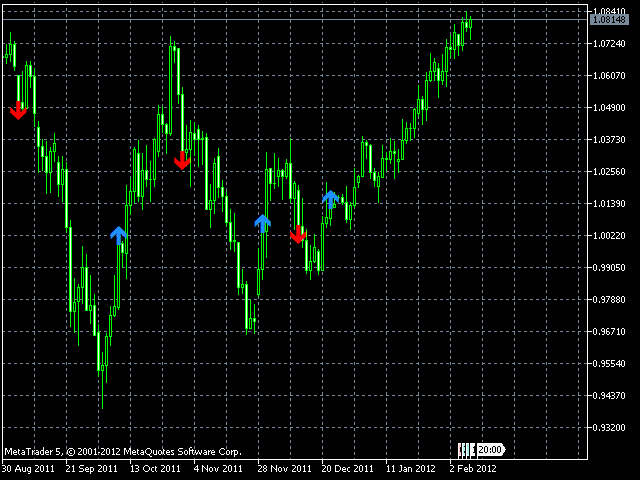
Индикатор показывает сигналы на покупку и продажу.

При закрытии бара и выполнении торговых условий рядом на цене закрытия бара появляется стрелка вверх (сигнал на покупку) или вниз (сигнал на продажу).

Индикатор работает на всех таймфреймах. Во входных параметрах можно указать режим звукового оповещения при появлении сигнала.

Рекомендуем также
KT Psar Arrows MT5
KEENBASE SOFTWARE SOLUTIONS
KT Psar Arrows plots the arrows on chart using the standard Parabolic SAR indicator. A bullish arrow is plotted when the candle's high touch the SAR. A bearish arrow is plotted when the candle's low touch the SAR. The signals are generated in the real-time without waiting for the bar close.  Features A beneficial tool for traders who want to experiment with the trading strategies that include the use of Parabolic Sar indicator.  Can be used to find turning points in the market. Use custom PSA
The indicator determines a special pattern of Joe Dinapoli. It gives very high probability buy and sell signals. Indicator does not repaint. Indicator Usage Buy Signal ''B'' Entry : Market buy order at signal bar close Stop : Low of signal bar Take Profit : First swing high Sell Signal ''S'' Entry : Market sell order at signal bar close Stop : High of signal bar Take Profit : First swing low Indicator Parameters Fast EMA : External Parameter (should be kept as default) Slow EMA: External Param
A useful scanner/dashboard that shows the RSI values for multiple symbols and Time-frames. It can be easily hidden/displayed with a simple click on the scanner man top left of the dashboard. You can input upper and lower RSI values and the colours can be set to show when above/below these values. The default values are 70 and 30. There are also input colours for when the RSI is above or below 50 (but not exceeding the upper/lower levels Symbols and time-frames are input separated by commas.
Mean Reversal Heikin Ashi Indicator calculates special trade reversal points based on Heikin Ashi candlesticks patterns. This indicator can be used on all symbols, even in Forex or B3 Brazillian Markets. You can configure just the position of each arrow. Then, after include the indicator on the graphic, pay attention on each arrow that indicates a long or short trade.
Индикатор помогает зайти в сделку по тренду, при этом, после некоторой коррекции. Он  находит сильные трендовые движения валютной пары на заданном количестве баров, а также находит уровни коррекции к этому тренду.  Если тренд достаточно сильный, а коррекция становится равной заданной в параметрах, то индикатор сигнализирует об этом. Можно устанавливать разные значения коррекции, лучше подходят значения 38, 50 и 62 (уровни Фибоначчи). Кроме этого, можно настраивать минимальную длину тренда, колич
【Super Scanner】Indicator Introduction : The color of the Super Scanner which is green and climbing up means that the price trend is going up.The color of the Super Scanner is red and going down means that the price trend is going down. It is very simple to use it to judge the market trend! What's even better is that the open parameters of the indicators allow investors to adjust. You can adjust【Super Scanner】according to your needs. Adjust it faster to be closer to short-term market fluctuati
The   Bullish Harami candlestick pattern   is formed by two candles. Here’s how to identify the Bullish Harami candlestick pattern: The first candle must be bearish and have a big body The second candle must be small and bullish The second candle is inside the body of the first candle This 2-candle bullish candlestick pattern is a reversal pattern, meaning that it’s used to find bottoms. For this reason, we want to see this pattern after a move to the downside, showing that bulls are starting t
The Trap Play MT5
Carl Gustav Johan Ekstrom
Trap Play   refers to a market situation where price initially makes a new high or low, luring traders into believing a strong trend is forming. However, the price quickly reverses and invalidates the breakout, trapping those traders who entered positions based on the initial move. This sudden reversal often results in a rapid exit of positions, leading to significant price movement in the opposite direction.  Trap plays  can occur in various financial markets and timeframes and are characterize
- This is an implementation of OCC ==> open close cross - This indicator applies twelve different averaging methods to open and close prices separately to signal the trend switching. - All MA methods are set as input as well as period and different offsets applied to linear regression and ALMA averaging. - Buffers 16 and 17 can be used in EAs to detect trend direction. - You can message in private chat for further changes you need.
Draw as many custom candles as possible on a single chart with this special indicator. Your analysis skill will never be the same again for those who know the power that having a hawkeye view of all price action at once provides. Optimized for performance and allows customization on the appearance of candle bodies and wicks. This is an integral part of analysis at our desks, we hope it will never leave your charts too once you can use it to its full potential.
Binary Options Assistant (BOA) KAM Signals Indicator provides signals based on gkNextLevel Binary Options Strategy. Indicators: 3 Moving Averages & Stochastic Stop missing trades, stop jumping from chart to chart looking for trade set-ups and get all the signals on 1 chart! U se any of the BOA Signals Indicator with the  Binary Options Assistant (BOA) Multi Currency Dashboard .  All BOA Signal Indicator settings are adjustable to give you more strategy combinations. The signals can be seen v
Dark Breakout   is an Indicator for intraday trading. This Indicator is based on Trend Following  strategy, providing an entry signal on the breakout. The signal is provided by the arrow, which confirms the breaking of the level. We can enter in good price with this Indicator, in order to follow the main trend on the current instrument. It is advised to use low spread ECN brokers. This Indicator does Not repaint and N ot lag . Recommended timeframes are M5, M15 and H1. Recommended working pairs
It's a multi-symbol and multi-timeframe scanner for our indicator - ACB Breakout Arrows . With default settings, it scans for the buy/sell signals on 28 currency pairs and 9 time-frames concurrently.   Features It can scan 252* combinations of symbols and time-frames from a single chart. Open the signal's chart loaded with a predefined template with a single click.  Easy drag n drop anywhere on the chart. Real-time alerts with popup, sound, push-notifications and email alerts.  Input Para
ИНДИКАТОР, основанный на ИСКУССТВЕННОМ ИНТЕЛЛЕКТЕ, который генерирует возможные записи колл- и пут-опционов для бинарных опционов. Индикатор работает по 3 разным стратегиям: 1) считывая объемы, он посылает сигнал, когда цена должна развернуться 2) через расхождение между ценой и объемом он посылает сигнал, когда тренд должен продолжиться или развернуться. 3) благодаря сближению цены и объема он посылает сигнал о том, что тренд должен продолжиться. Индикатор работает на всех таймфр
KT DMA is a modified and advanced version of the classic Displaced Moving Averages with buy/sell crossover alerts and a Multi-Timeframe scanner that shows DMA's direction across each real-time time frame. A Displaced Moving Average is a simple moving average that moves ahead or backward in a time frame (either short-term or long-term). It also allows you to predict price movement more accurately. Features Depicts the trend direction using the alignment of three moving averages. Buy/Sell signa
Fibonacci automatically draws Fibonacci retracement, Because Fibonacci automatically draws Fibonacci retracement, you can know at a glance the price to buy at a push or sell back. Therefore, you can trade in favorable conditions in a trending market. We are live-streaming the actual operation of the system. Please check for yourself if it is usable. Please check it out for yourself. https://www.youtube.com/@ganesha_forex We do not guarantee your investment results. Investments should be mad
Информационная панель ADR Alert показывает вам, где в настоящее время торгуется цена по отношению к ее нормальному среднему дневному диапазону. Вы будете получать мгновенные оповещения через всплывающие окна, электронную почту или push-уведомления, когда цена превышает свой средний диапазон и уровни выше него по вашему выбору, чтобы вы могли быстро переходить к откатам и разворотам. Черта предназначена для размещения на пустом графике и просто находится в фоновом режиме и предупреждает вас о до
MACD Alerts MT5
KEENBASE SOFTWARE SOLUTIONS
3 (2)
KT MACD Alerts is a personal implementation of the standard MACD indicator available in Metatrader. It provides alerts and also draws vertical lines for the below two events: When MACD crosses above the zero line. When MACD crosses below the zero line. Features It comes with an inbuilt MTF scanner, which shows the MACD direction on every time frame.  A perfect choice for traders who speculate the MACD crossovers above/below the zero line. Along with the alerts, it also draws the vertical line
Our indicator will help you to make a decision whether to Buy or Sell , including where to set the Take Profit and Stop Loss . The Buy/Sell signal will not redraw nor repaint until new signal occurs. The Take Profit and Stop Loss will change following the market conditions. Our indicator will give alert to your mobile/handphone when new buy/sell signal arrive. For best result, combine this indicator with your knowledge on price action and support & resistance, also don't forget to watch for the
Daily VWAP, continues for a period of hours (eg, 10 hours of history), with color to indicate change of direction and bands to map good entry and exit points. The indicator was created to map the center of the market, and find good buying moments, trend analysis or market correction points are easily detected, allowing you to understand moments of exhaustion and buying and selling points Copyright (c) <year> <copyright holders> Permission is hereby granted, free of charge, to any person obtain
Impulse fractals indicator - is counter-trend oriented complex market fractal pattern.  Market creates bull/bear impulse, trend starts, fractals on impulsed wave are an agressive pullback signals. Buy arrow is plotted when market is bearish and it's impulse showed up-side fractal, and sell arrow is plotted when market is bullish and it's impulse showed dn-side fractal. Main indicator's adjustable inputs : impulsePeriod - main period of impulse histogram  filterPeriod  - smoothes impulse accordi
BS Time Band是一个很好的波段交易指示器,这个指标可以单独使用,但是最好是配合 StartPoint 一起使用效果更好,适用于任何时间框架,非常适合喜欢做波段交易的朋友。它能很好的体现出一个波段的完整信息,你可以很快的从这个指示器上寻找到最佳的预警区域,然后配合 StartPoint 找到最佳的buy位置和最佳的sell位置,也能很好根据指示器去坚守自己的持仓定订单。指标不含有未来函数,不会重新绘制,不仅能够应用到自己的手动交易过程中,还能完全可以写入到自己的EA中。(如果你感觉到这个指标能够帮助你进行更准确的交易,请帮忙给个好评,希望我的作品能够帮助更多有需要的人) =================参考使用方法=================== 此指标可以适用于任何交易品种。 做波段建议参数 timeFame:M5 如果配合 StartPoint 建议 StartPoint 的参数为(240,60)
The TrendLinePro indicator for MetaTrader 5 creates a trend line based on the last candle highs and lows. The number of candles to be used to determine the direction can be selected yourself. The trend line can also be used to set an SL. Changes in trend directions can optionally be displayed with an arrow. Input Parameters: Number of Candles for Distance: 3 Display Direction Changes Arrows: false
Heiken Ashi On One Chart Mode Индикатор отображается только на одном из режимов графика: Бары, Свечи, Линия. По умолчанию -- Бары. При переключении режима графика индикатор показывается или пропадает в зависимости от режима графика. Входные параметры: iChartMode: на каком режиме графика отображать индикатор: mBars (Бары) mCandles (Свечи) mLine (Линия) Цвета: LightSeaGreen: бычья свеча Tomato: медвежья свеча
Представляем индикатор энтузиазма тренда (TEI), идеальный инструмент для максимизации прибыли на торговой площадке. Этот инновационный индикатор сочетает в себе силу анализа тренда с волнением рыночных настроений, предоставляя трейдерам уникальное преимущество на постоянно меняющихся финансовых рынках. TEI использует передовые алгоритмы для анализа основного тренда финансового инструмента и энтузиазма трейдеров для выявления возможностей получения высокой прибыли. Это позволяет трейдерам из
1. Why did I develop this series of indicators I found that most traders need to use multiple time frame indicators. They usually switch time frame to see indicators. However, once the timeframe is switched, you cannot see the  corresponding relationship  between  the price in the smaller timeframe  and  the indicator in the larger timeframe . For example: if your price chart is in H1 timeframe, you can see H4, D1 and W1 indicators in H1 timeframe Chart. This is more helpful for you to find t
I do not have the exact indicator for MT4 but the nearest possible look alike can be downloaded from here . Also you may check this link . This is the exact conversion from TradingView: "Donchian Trend Ribbon" By "LonesomeTheBlue". One of the coolest indicators out there to detect trend direction and strength. As a trader you always need such indicator to avoid getting chopped in range markets. There are ten buffers as colors to use in EAs also. The indicator is loaded light and non-repaint. Not
DYNAMIC SR TREND CHANNEL Dynamic SR Trend Channel is a simple indicator for trend detection as well as resistance/support levels on the current timeframe. It shows you areas where to expect possible change in trend direction and trend continuation. It works with any trading system (both price action and other trading system that use indicators) and is also very good for renko charting system as well. In an uptrend, the red line (main line) serves as the support and the blue line serves as the
Niubility Trend  Niubility Trend  displays the trend direction for all time frames in real time. You'll see at a glance at which direction the trends are running, how long they last and how powerful they are. All this makes it an easy-to-use trend trading system for beginners, advanced and professional traders. Features Easy to trade Customizable colors and sizes It is non-repainting and non-backpainting It is fantastic as a trailing stop method It implements alerts of all kinds
This wonderful tool works on any pair producing alerts whenever the market enters the overbought and oversold zones of the market. The signals come as  BUY or SELL but it does not necessarily mean you should go on and execute order, but that you should begin to study the chart for potential reversal. For advanced signal tools check out some of our premium tools like Dual Impulse.
FREE
С этим продуктом покупают
Прежде всего стоит подчеркнуть, что этот торговый индикатор не перерисовывается, не перерисовывает и не отставает, что делает его идеальным как для ручной, так и для роботизированной торговли. Атомный аналитик - это индикатор ценового действия PA, который использует силу и импульс цены, чтобы найти лучший край на рынке. Оборудованный расширенными фильтрами, которые помогают убирать шумы и ложные сигналы, и повышают торговый потенциал. Используя несколько слоев сложных индикаторов, Атомный анали
Прежде всего стоит подчеркнуть, что эта торговая система является индикатором без перерисовки, без повторной отрисовки и без задержки, что делает ее идеальной как для ручной, так и для роботизированной торговли. «Smart Trend Trading System MT5» - это комплексное торговое решение, созданное для новичков и опытных трейдеров. Он объединяет более 10 премиальных индикаторов и предлагает более 7 надежных торговых стратегий, что делает его универсальным выбором для разнообразных рыночных условий. Стр
Представляем       Индикатор Quantum Trend Sniper   , инновационный индикатор MQL5, который меняет способ определения разворотов тренда и торговли ими! Разработан командой опытных трейдеров со стажем торговли более 13 лет,       Снайперский индикатор Quantum Trend       разработан, чтобы вывести ваше торговое путешествие на новые высоты благодаря инновационному способу определения разворотов тренда с чрезвычайно высокой точностью. ***Купите индикатор Quantum Trend Sniper и получите индикатор
Раскройте силу торговли трендами с помощью индикатора Trend Screener: вашего идеального решения для торговли трендами, основанного на нечеткой логике и мультивалютной системе! Повысьте уровень своей торговли по тренду с помощью Trend Screener, революционного индикатора тренда, основанного на нечеткой логике. Это мощный индикатор отслеживания тренда, который сочетает в себе более 13 инструментов и функций премиум-класса и 3 торговые стратегии, что делает его универсальным выбором для превращения
Этот индикатор является уникальным, качественным и доступным инструментом для торговли, включающим в себя наши собственные разработки и новую формулу. В обновленной версии появилась возможность отображать зоны двух таймфреймов. Это означает, что вам будут доступны зоны не только на старшем ТФ, а сразу с двух таймфреймов - таймфрейма графика и старшего: отображение вложенных зон. Обновление обязательно понравится всем трейдерам, торгующим по зонам спроса и предложения. Важная информация Для мак
Прежде всего стоит подчеркнуть, что этот Торговый Инструмент является Неперерисовывающимся Нерепейнтинговым Индикатором, что делает его идеальным для профессиональной торговли. Индикатор Концепций Умного Действия Цены - очень мощный инструмент как для новичков, так и для опытных трейдеров. Он объединяет более 20 полезных индикаторов в одном, комбинируя передовые торговые идеи, такие как анализ Inner Circle Trader и стратегии торговли концепциями умных денег. Этот индикатор сосредотачивается н
Сейчас 147 долл. США (увеличиваясь до 499 долл. США после нескольких обновлений) - неограниченные учетные записи (ПК или Mac) Руководство пользователя + Обучающие видео + Доступ к приватному Discord-каналу + VIP-статус и мобильная версия + Лицензия на 5 ПК с неограниченным количеством аккаунтов и терминалов MT4. Сколько раз вы покупали индикатор торговли с замечательными обратными тестами, доказательствами производительности на живых счетах и зашикарными цифрами и статистикой, но после испо
Получайте ежедневную информацию о рынке с подробностями и скриншотами через наш утренний брифинг здесь, на mql5 , и в Telegram ! FX Power MT5 NG - это новое поколение нашего популярного измерителя силы валют FX Power. Что же предлагает этот измеритель силы нового поколения? Все, что вы любили в оригинальном FX Power ПЛЮС Анализ силы GOLD/XAU Еще более точные результаты расчетов Индивидуально настраиваемые периоды анализа Настраиваемый предел расчета для еще более высокой производительности Спец
FX Volume MT5
Daniel Stein
4.94 (17)
Получайте ежедневную информацию о рынке с подробностями и скриншотами в нашем утреннем брифинге здесь, на mql5 , и в Telegram ! FX Volume - это ПЕРВЫЙ и ЕДИНСТВЕННЫЙ индикатор объема, который дает РЕАЛЬНОЕ представление о настроении рынка с точки зрения брокера. Он дает потрясающее представление о том, как институциональные участники рынка, такие как брокеры, позиционируют себя на рынке Forex, гораздо быстрее, чем отчеты COT. Видеть эту информацию прямо на своем графике - это настоящий геймчей
AW Trend Predictor MT5
AW Trading Software Limited
4.76 (54)
Сочетание тренда и пробоя уровней в одной системе. Продвинутый алгоритм индикатора фильтрует рыночный шум, определяет тренд, точки входа, а также возможные уровни выхода из позиции. Сигналы индикатора записываются в статистический модуль, который позволяет выбирать наиболее подходящие инструменты, показывая эффективность истории сигналов. Индикатор рассчитывает отметки ТейкПрофитов и стоплосса. Руководство пользователя ->  ЗДЕСЬ  / MT4 версия ->  ЗДЕСЬ Как торговать с индикатором: Торговля с Tr
Топовый индикатор МТ5, дающий сигналы для входа в сделки без перерисовки! Идеальные точки входа в сделки для  валют, крипты, металлов, акций, индексов !  Смотрите  видео  (6:22) с примером отработки всего одного сигнала, окупившего индикатор. Версия индикатора для MT4 Преимущества индикатора Сигналы на вход без перерисовки Если сигнал появился, он никуда НЕ исчезает! В отличие от индикаторов с перерисовкой, которые ведут к потере депозита, потому что могут показать сигнал, а потом убрать его.
TPSpro TRENDPRO   —  трендовый индикатор, который автоматически анализирует рынок и предоставляет информацию о тренде и каждой его смене а также дающий сигналы для входа в сделки без перерисовки! Индикатор использует каждую свечу, анализируя их отдельно. относя к разным импульсам – импульс вверх или вниз. Точные точки входа в сделки  для  валют, крипты, металлов, акций, индексов! -  Version MT4                ПОЛНОЕ ОПИСАНИЕ          /        СЕТАПЫ ДЛЯ ТОРГОВЛИ                        Рекоменд
Представляем       Quantum Breakout PRO   , новаторский индикатор MQL5, который меняет ваш способ торговли в зонах прорыва! Разработан командой опытных трейдеров со стажем торговли более 13 лет,       Квантовый прорыв PRO       разработан, чтобы поднять ваше торговое путешествие к новым высотам с его инновационной и динамичной стратегией зоны прорыва. Quantum Breakout Indicator покажет вам сигнальные стрелки на зонах прорыва с 5 целевыми зонами прибыли и предложением стоп-лосса на основе по
TrendDecoder Premium MT5
Christophe, Pa Trouillas
5 (1)
Определите диапазоны и следующие вероятные движения  | Получите самые ранние сигналы и силу трендов    |  Получите четкие выходы перед разворотом  |  Определите уровни Фибо, которые будет тестировать цена   |  Индикатор без перерисовки и задержек - идеально подходит для ручной и автоматической торговли - подходит для всех активов и всех временных единиц $ 69   на старте - затем снова   $149 После покупки   пожалуйста, свяжитесь с моим каналом  для получения рекомендуемых настроек Версия МТ4 :  
Bill Williams Advanced предназначен для автоматического анализа графика по системе " Profitunity " Билла Уильямса. Индикатор анализирует сразу четыре таймфрейма. Инструкция/Мануал ( Обязательно читайте перед приобретением ) Преимущества 1. Автоматически анализирует график по системе "Profitunity" Билла Уильямса. Найденные сигналы помещает в таблицу в углу экрана. 2. Оснащён трендовым фильтром по индикатору Аллигатор. Большинство сигналов системы рекомендуется использовать только по тренду.
Step into the realm of Forex trading with confidence and precision using XQ, a cutting-edge Forex indicator designed to elevate your trading game to unprecedented heights. Whether you're a seasoned trader or just stepping into the world of currency exchange, XQ Forex Indicator empowers you with the insights and signals needed to make informed trading decisions. The signal conditions are a combination of three indicators, and XQ Forex Indicator only display  medium and long-term trends . The ind
Станьте Breaker Trader и получайте прибыль от изменений структуры рынка по мере изменения цены. Индикатор выключателя блока ордеров определяет, когда тренд или движение цены приближаются к истощению и готовы развернуться. Он предупреждает вас об изменениях в структуре рынка, которые обычно происходят, когда произойдет разворот или серьезный откат. Индикатор использует собственный расчет, который определяет прорывы и ценовой импульс. Каждый раз, когда новый максимум формируется около возможн
Auto Order Block with break of structure based on ICT and Smart Money Concepts Futures Break of Structure ( BoS )             Order block ( OB )            Higher time frame Order block / Point of Interest ( POI )    shown on current chart           Fair value Gap ( FVG ) / Imbalance   ,  MTF      ( Multi Time Frame )    Volume Imbalance     ,  MTF          vIMB Gap’s Equal High / Low’s     ,  MTF             EQH / EQL Liquidity               Current Day High / Low           HOD /
IX Power , наконец, предлагает непревзойденную точность FX Power для нефорексных символов. Он точно определяет интенсивность краткосрочных, среднесрочных и долгосрочных трендов в ваших любимых индексах, акциях, товарах, ETF и даже криптовалютах. Вы можете   анализировать все, что   может предложить ваш терминал. Попробуйте и почувствуйте, как   значительно улучшается ваш тайминг   при торговле. Ключевые особенности IX Power 100% точные результаты расчетов без перерисовки - для всех торгов
The Volume by Price Indicator for MetaTrader 5 features Volume Profile and Market Profile TPO (Time Price Opportunity). Get valuable insights out of currencies, equities and commodities data. Gain an edge trading financial markets. Volume and TPO histogram bar and line charts. Volume Footprint charts. TPO letter and block marker charts including split structures. Versatile segmentation and compositing methods. Static, dynamic and flexible ranges with relative and/or absolute visualizations. Lay
TrendLine PRO MT5
Evgenii Aksenov
4.78 (49)
Индикатор   Trend Line PRO   является самостоятельной торговой стратегией. Он показывает смену тренда, точку входа в сделку, а так же автоматически рассчитывает три уровня Take Profit и защиту от потери Stop Loss Trend Line PRO   идеально подходит для всех символов Meta Trader:  валют, металлов, криптовалют, акций и индексов   Преимущества Trend Line PRO: Никогда не перерисовывает свои сигналы Возможность использования  как самостоятельную стратегию Имеет три автоматических уровня Take Profi
ICT, SMC, SMART MONEY CONCEPTS, SMART MONEY, Smart Money Concept, Support and Resistance, Trend Analysis, Price Action, Market Structure, Order Blocks, BOS/CHoCH,   Breaker Blocks ,  Momentum Shift,   Supply&Demand Zone/Order Blocks , Strong Imbalance,   HH/LL/HL/LH,    Fair Value Gap, FVG,  Premium  &   Discount   Zones, Fibonacci Retracement, OTE, Buy Side Liquidity, Sell Side Liquidity, BSL/SSL Taken, Equal Highs & Lows, MTF Dashboard, Multiple Time Frame, BigBar, HTF OB, HTF Market Structure
Представляем   Quantum Heiken Ashi PRO Свечи Heiken Ashi, разработанные для обеспечения четкого понимания рыночных тенденций, известны своей способностью отфильтровывать шум и устранять ложные сигналы. Попрощайтесь со сбивающими с толку колебаниями цен и познакомьтесь с более плавным и надежным представлением графиков. Что делает Quantum Heiken Ashi PRO действительно уникальным, так это его инновационная формула, которая преобразует данные традиционных свечей в легко читаемые цветные столбцы. Кр
Gartley Hunter Multi - Индикатор для поиска гармонических моделей одовременно на десятках торговых инструментов и на всех классических ценовых диапазонах: (m1, m5, m15, m30, H1, H4, D1, Wk, Mn). Инструкция/Мануал ( Обязательно читайте перед приобретением ) | Версия для МТ4 Преимущества 1. Паттерны: Гартли, Бабочка, Акула, Краб. Летучая мышь, Альтернативная летучая мышь, Глубокий краб, Cypher 2. Одновременный поиск паттернов на десятках торговых инструментов и на всех классических таймфреймах
Профиль Рынка (Market Profile) определяет ряд типов дней, которые помогают трейдеру распознать поведение рынка. Ключевая особенность - это область значений (Value Area), представляющая диапазон ценового действия, в котором произошло 70% торговли. Понимание области значений может помочь трейдерам вникнуть в направление рынка и установить торговлю с более высокими шансами на успех. Это отличное дополнение к любой системе, которую вы возможно используете. Blahtech Limited представляет сообществу Me
Важным ключевым элементом в трейдинге являетсязоны или уровни, от которых принимаются решения о покупке или продаже торгового инструмента. Несмотря на попытки крупных игроков скрыть свое присутствие на рынке, они неизбежно оставляют следы. Наша задача заключалась в том, чтобы научиться находить эти следы и правильно их интерпретировать. Первые Импульсные Уровни (ПИУ)     -      Reversal First Impulse levels (RFI)   -  Version MT4                INSTRUCTIONS                 RUS                 E
Версия MT4   |   FAQ Индикатор Owl Smart Levels – это полноценная торговая система внутри одного индикатора, которая включает в себя такие популярные инструменты анализа рынка как усовершенствованные фракталы Билла Вильямса , Valable ZigZag, который строит правильную волновую структуру рынка, а также  уровни Фибоначчи, которые   отмечают точные уровни входа в рынок и места взятия прибыли. Подробное описание стратегии Инструкция по работе с индикатором Советник-помошник в торговле Owl Helper При
**   All Symbols   x   All Time frames   scan just by pressing scanner button ** ***Contact me after the purchase to send you instructions and add you in "Swing scanner group" for sharing or seeing experiences with other users. Introduction: Swing Scanner   is the indicator designed to detect swings in the direction of the trend and possible reversal swings. The indicator studies several price and time vectors to track the aggregate trend direction and detects situations in which the market is o
Dark Power MT5
Marco Solito
4.84 (56)
Dark Power  is an Indicator for intraday trading. This Indicator is based on   Trend Following  strategy, also adopting the use of an histogram to determine the right power . We can enter in good price with this Indicator, in order to follow the   strong trend   on the current instrument. The histogram is calculated based on the size of the bars and two moving averages calculated on the histogram determine the direction of the signal Key benefits Easily visible take profit/stop loss lines Int
40% СКИДКА НА РОЖДЕСТВО! ПОВЫШЕНИЕ ЦЕНЫ ДО $250 С 1 ЯНВАРЯ! Представляем GoldenGate Entries: Революционное Торговое Решение! Откройте для себя революционный подход к торговле с GoldenGate Entries (GGE), передовым индикатором, разработанным для повышения вашего опыта торговли. GGE предоставляет обширный набор функций, чтобы предоставить пользователям точность и уверенность в их торговых решениях. Пары: Любые (валюты - товары - акции - акции - криптовалюты) Таймфреймы: 15 минут до H1 Ос
Другие продукты этого автора
Reverse TradeCopier for Followers   can copy trades from an account that is running Reverse TradeCopier Source . Features: Copies trades from one source (master) account to multiple following (slave) accounts. Allows investor (read only) password for source (master) account. There are no complicated settings and input parameters, everything is easy. Works with different brokers. Works with different quotes symbols (EURUSD_FX, eurusd_m, etc.). Can copy orders from 4-digit quotes platform to 5-dig
。。。。。。。。。。。。。。。。。。。。。。。。。。。。。。。。。。。。。。。。。。。 This indicator is based on Bollinger Bands indicator. It helps user clearly know the Band is expand or contract. The method of use is the same as the traditional Brin channel index. Users can use different color areas to distribute forest channel indicators in expansion or contraction stage. -------------------------------------------------------------------------------------------
FREE
Reverse TradeCopier for Followers can copy trades from an account that is running   Reverse TradeCopier for Source . Features: Copies trades from one source (master) account to multiple following (slave) accounts. Allow investor (read only) password for source (master) account. There are no complicated settings and input parameters, everything is easy. Works with different brokers. Works with different quotes symbols (EURUSD_FX, eurusd_m, etc.). Can copy orders from 4-digit quotes platform to 5-
FREE
Скрипт показывает статистику торговли за указанный период. Например, если вы хотите получить статистику торгов победителя ATC2010 ( bobsley ): Войдите на его счет под инвесторским паролем (MetaTrader5); Откройте график рабочего символа советника (EURUSD); Запустите скрипт на графике; В поле "date from" введите "2010.10.1", и вы увидите статистику его торговли.
If you want something as below: Sell FOREX trading signal. Manage multiple accounts. Follow the trading from somebody. "TradeCopier_follow" and   "TradeCopier_source"   can help you! Features: Copying from one source (master) account to multiple follower (slave) accounts. Allow investor (read only) password for the source (master) account. There are no complicated settings and input parameters, everything is easy. Works with different Brokers. Works with different symbols (EURUSD_FX, eurusd_m, e
FREE
The Synchronized Charts script allows comparing bars of different symbols or different periods of the same symbol. Attach the script to a chart and move bars or change the scale, all opened chart will move synchronously with the current one. The bars on different charts aligned to the border according to their open time. Please be sure the relevant history datas have been downloaded before synchronize charts. 。。。。。。。。。。。。。。。。。。。。。。。。。。。。。。。。。。。。。。。。。。。。。。。。。。
Нередко на графиках появляются сомнительные "разрывы". Они могут быть вызваны некачественными историческими данными. Предлагаемый скрипт поможет пользователям определить "разрывы свечей" за последние 2 года. Он находит и отмечает гэпы знаками вопроса и выводит общее число найденных "разрывов". Также предусмотрена возможность передвижения по гэпам и сохранения отчета с данными гэпа в файл.
Some trading strategies are suitable for the quiet market with less volatility, while others are suitable for the volatile and violent market. Either way, traders should have a clear measure of how hot or cold the market is. This product is convenient for traders to compare the degree of cold heat of different trading varieties, or the trading heat of the same trading variety in different time periods. You can put it on different charts to get the intuition. It's easy to see which is more hot an
This indicator is used to indicate the difference between the highest and lowest prices of the K line, as well as the difference between the closing price and the opening price, so that traders can visually see the length of the K line. The number above is the difference between High and Low, and the number below is the difference between Close and Open. This indicator provides filtering function, and users can only select K lines that meet the criteria, such as positive line or negative
Some traders don't like expose Take Profit/Stop Loss level in their positions, this Expert Advisor can help them. Put it to chart and set Take Profit/Stop Loss pips (0 means ignore), it watch the price of the symbol on chart and close the position if price reach Hidden TP/SL level. It hide user's TP/SL price in effect. Welcome to contact me. 。。。。。。。。。。。。。。。。。。。。。。。。。。。。。
This script allows traders to easily close positions if their profit/loss reaches or exceeds a value specified in pips. The script allows users to easily close positions if their profit/loss reaches or exceeds a value specified in pips. Please set slippage value first. Sometimes some positions do not close due to high volatility of the market. Please set larger slippage or restart the script. ..............................................................................................
Скрипт для удаления отложенных ордеров Иногда бывают случаи, когда необходимо удалить множество установленных отложенных ордеров (Pending Orders), этот скрипт поможет вам в этом! Использование: Запустите скрипт на графике. Разрешите авто-торговлю во вкладке "Общие" и укажите входные параметры. Входные параметры: TypeOfPending: тип отложенных ордеров, которые нужно удалить. mySymbol: символ, по которому удалить ордера. Формат символа задается в виде строки, например "EURUSD" или "eurusd".
Скрипт показывает время в различных городах мира, выбранных пользователем (более 30 крупнейших городов). Также он показывате время GMT, серверное время и местное время. Список городов сортируется автоматически по времени. Настройки можно сохарнить на вкладке "Входные параметры" для использования при последующих запусках. Примечание: Переход на зимнее/летнее время в скрипте не учитывается.
Some trading strategies are suitable for the quiet market with less volatility, while others are suitable for the volatile and violent market. Either way, traders should have a clear measure of how hot or cold the market is. This product is convenient for traders to compare the degree of cold heat of different trading varieties, or the trading heat of the same trading variety in different time periods. You can put it on different charts to get the intuition. It's easy to see which is more hot an
Painting Deals
Jinsong Zhang
4.67 (3)
Скрипт для отображения совершенных сделок по символу на активном чарте. Также позволяет проанализировать сделки на других счетах при входе с инвесторским паролем. Тип отображаемой стрелки зависит от направления позиции: Стрелка вправо показывает сделки "In" и "In/Out",  Стрелка влево показывает сделки "Out" Синие стрелки соответствуют сделкам "Buy", красные - сделкам "Sell". Помимо сделок истории, индикатор отображает совершаемые сделки в реальном времени, также он показывает уровни Stop Loss и
The Synchronized Charts script allows comparing bars of different symbols or different periods of the same symbol. Attach the script to a chart and move bars or change the scale, all opened charts will move synchronously with the current one. The bars on different charts aligned to the border according to their open time. Please be sure the relevant history datas have been downloaded before synchronize charts.
This script allows traders to easily close positions if their profit/loss reaches or exceeds a value specified in pips. The script allows users to easily close positions if their profit/loss reaches or exceeds a value specified in pips. Please set slippage value first. Sometimes some positions do not close due to high volatility of the market. Please set larger slippage or restart the script. ............................................................................................
Этот скрипт уведомляет трейдера о различных событиях путем проигрывания звуковых файлов, отсылки Email и текстовых сообщений на мобильное устройство. Поддерживаются следующие виды событий: Новые сделки (вход/переворот/выход). Истечение отложенных ордеров. Потеря соединения терминала с торговым сервером. Завершение работы скрипта/терминала. Способ уведомления настраивается отдельно для каждого типа событий. Если вы собираетесь использовать уведомления по Email, убедитесь в корректности настроек н
Этот скрипт информирует пользователя о завершении обратного отсчета, работает подобно будильнику. Существует 2 способа начать обратный отсчет: Установить количество оставшихся минут. Пример: если необходимо получить сигнал через час, установите значение 60. Указать время оповещения в явном виде. Если вы хотите установить свой звуковой сигнал, скопируйте звуковой файл в папку [каталог_данных_терминала\Sound] и укажите имя файла в параметрах скрипта. Звуковой файл должен быть в формате .wav.
Иногда на графиках видны ценовые разрывы (gaps). Они могут появляться по многим причинам: Праздники; Важные события; Ошибочные исторические данные. Этот скрипт помогает легко проверить ценовые разрывы за последние 2 года. Он находит и маркирует такие гепы на графике при помощи знака "?". Скрипт также выводит общее количество найденных гепов, реализована возможность навигации и сохранения отчета в файл.
----------------------------------------------------------------------------------------- This is a trend indicator, as you can see here. When the white line is above the red, it means a bull market. Conversely, the white line below the red line is a bear market. This index is suitable for long - term trading and is suitable for most trading varieties. --------------------------------------------------------------------------------------------
Данный индикатор предназначен для сравнения силы валютных пар. Индикатор сравнивает валютные пары. Трендовая линия в Currency Strength рисуется на основе всех выбранных валютных пар, что позволяет отчетливее видеть движения рынка. Чем выше линия валютной пары, тем больше ее сила. Входные параметры: Вы можете выбрать 3 пары для сравнения; Вы можете указать базовую дату - дату начала расчетов силы валютных пар.
.................................. This script is intended to help users to get information about ticks and spreads (e.g. ticks count, minimum/maximum/average spread). It can export reports in the CSV format with this information. Traders can see spread statistics in real time in the chart window It is useful for comparing spreads of different brokers. --------------------------------------------------------------------------
This is visualization tool based on the Depth of Market. It works with the symbols that have the Depth of Market available. It's a visual indicator that shows the volume of each Bid/Ask price and ratio of total volume of Bids/Asks. Note: check if your broker supports DOM before purchasing. 。。。。。。。。。。。。。。。。。。。。。。。。。。。。。。。。。。。。。。。。。。。。。。。。。。。 。。。。。。。。。。。。。。。。。。。。。。。。。。。。。。。。。。。。。。。。。。。。。。。。。。。
Данный индикатор предназначен для сравнения выбранных инструментов. Instruments Relativeness показывает зависимость между инструментами. Трендовая линия в Instruments Relativeness рисуется по ценам каждого из инструментов, что позволяет более отчетливо видеть движения на рынке. Входные параметры: Можно выбрать 3 инструмента; Можно выбрать базовую дату - дату, с которой будет начинаться расчет Instruments Relativeness.
Большую часть времени рынок находится в состоянии небольших колебаний. Индикатор Trade Area помогает пользователям распознать это время. Индикатор состоит из 5 линий: Area_high, Area_middle, Area_Low, SL_high и SL_low. Рекомендации: Когда цена находится между линиями Area_high и Area_Low, время начинать торговлю. На уровне Area_Low - покупка, на уровне Area_high - продажа. Линии SL_high и SL_low являются уровнем стоп лосса. Измените параметр Deviations для регулирования SL_high и SL_low.
This indicator is used to indicate the difference between the highest and lowest prices of the K line, as well as the difference between the closing price and the opening price, so that traders can visually see the length of the K line. The number above is the difference between High and Low, and the number below is the difference between Close and Open. This indicator provides filtering function, and users can only select K lines that meet the criteria, such as positive line or negative line.
Данный скрипт позволяет сравнивать котировки и спреды от разных брокеров, чтобы найти брокера с наилучшими ценами Ask/Bid и спредом. Лучшего поставщика цен можно определить по его оценке. Вы можете сравнивать до шести брокеров одновременно. Использование: откройте несколько клиентских терминалов MetaTrader 5 от разных брокеров и запустите скрипт на каждом терминале.
This is a multi-currency paired trading system.I won't go into the details of how it works, but what the user needs to care about is how it actually works. It is highly recommended that you download the product and test it thoroughly, including back testing with the historical data and foward testing in the simulated account. As this EA trades multiple currency pairs, relevant historical data will be automatically downloaded at the first time of its historical review, with data volume around 6GB
This tool is used to generate a K - line reflection chart of a currency pair for foreign exchange transactions. For example, if the currency pair is EURUSD, a custom currency pair named EURUSD_ref is generated and a chart for that currency pair is opened. The price of a custom pair of currency is the inverse of the price of the original pair, which is the equivalent of a new pair of currency, the USDEUR. The usage is simple, put it on any chart, the new chart will open, and then draw the co
Фильтр:
Нет отзывов
Ответ на отзыв
Версия 1.1 2021.11.20
Recompile as required by MQL5.community