ATF Trend Following Trend Bar OBOS
- Indicadores
-
Anon Candra N
 I am a professional trader who has been in the stock market for several years. After making in-depth observations of the stock market, I developed the trading tools that have helped my trading career so far. The good news is, you can have these trading tools on this website.
 - Versão: 1.0
- Ativações: 20
If you are curious about the position of the stochastic, RSI, CCI curve, whether it is at the OBOS level or not, then this trading tool is for you.
Introducing the advanced trading tools of 2024.
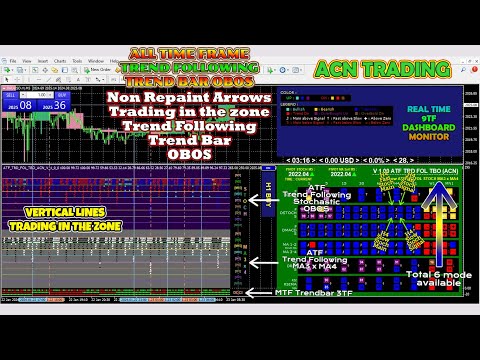
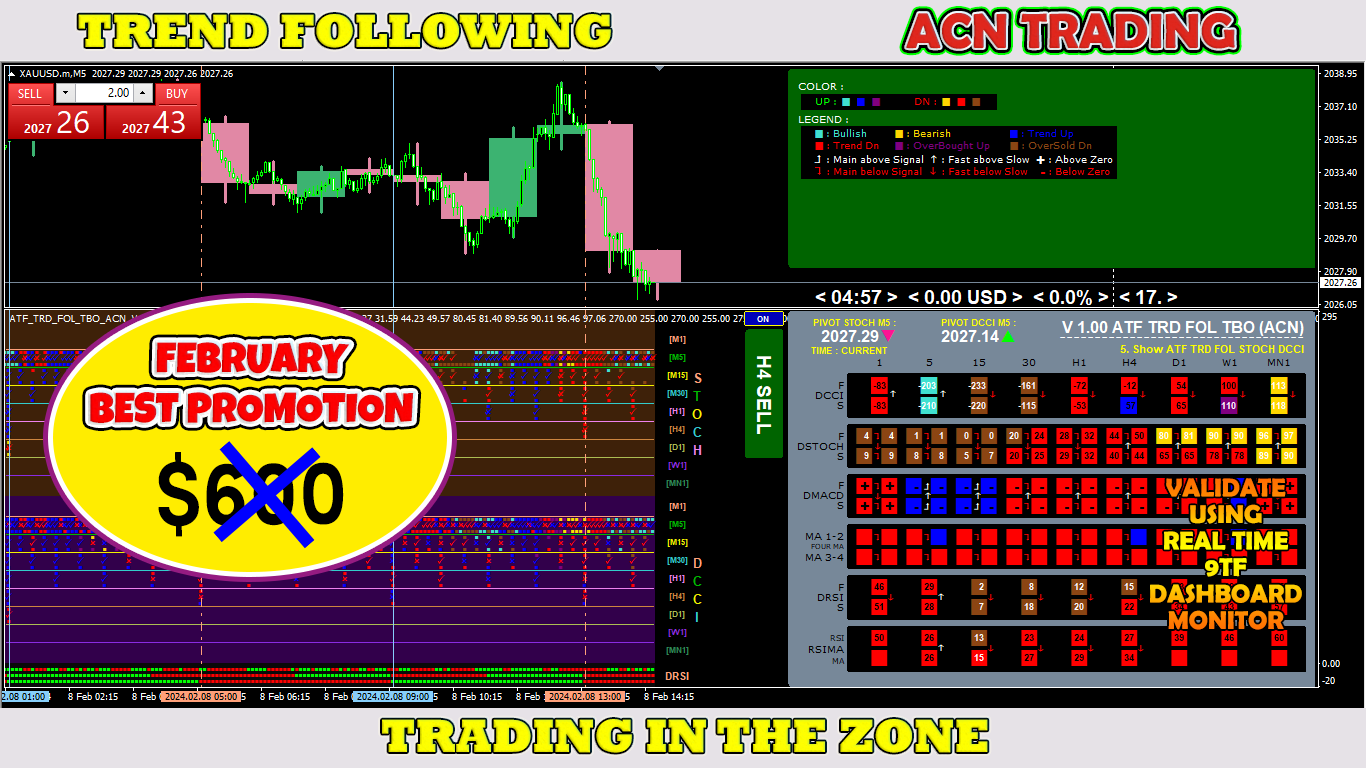
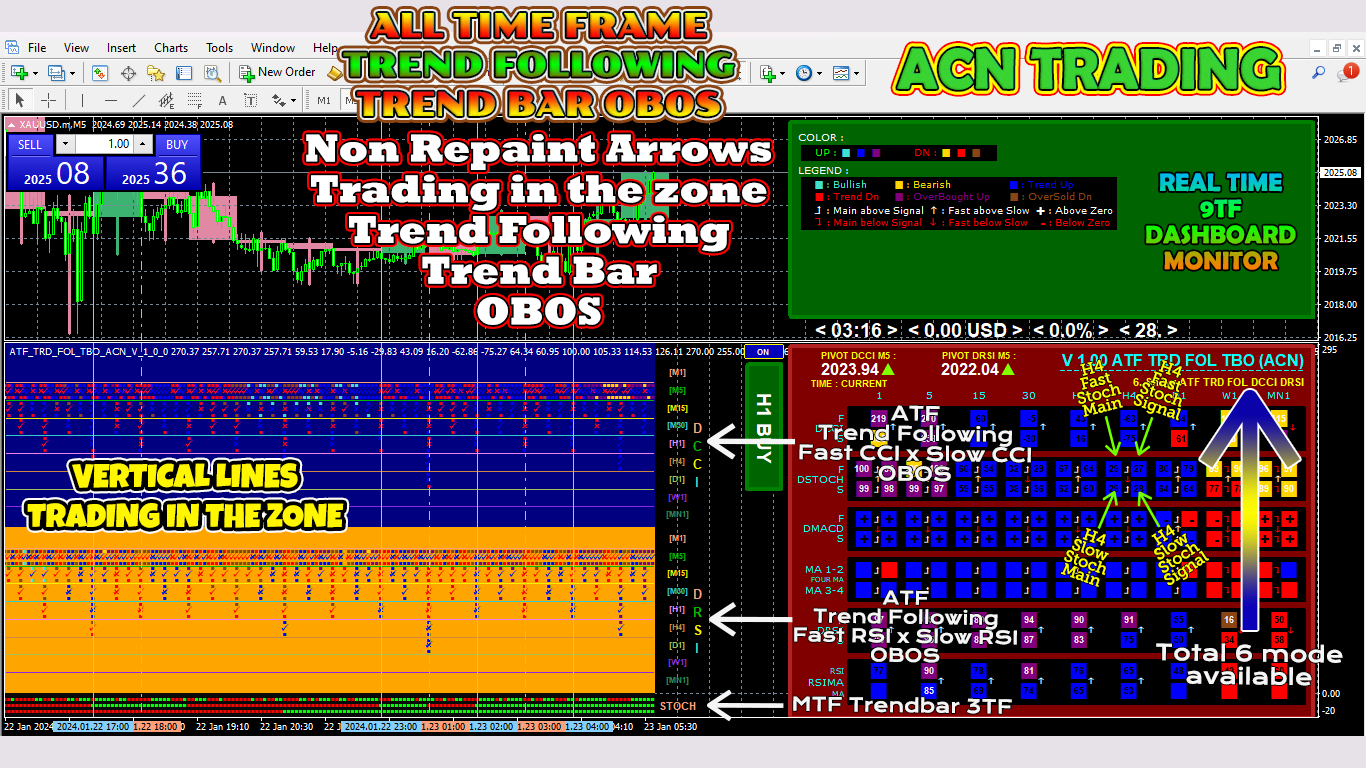
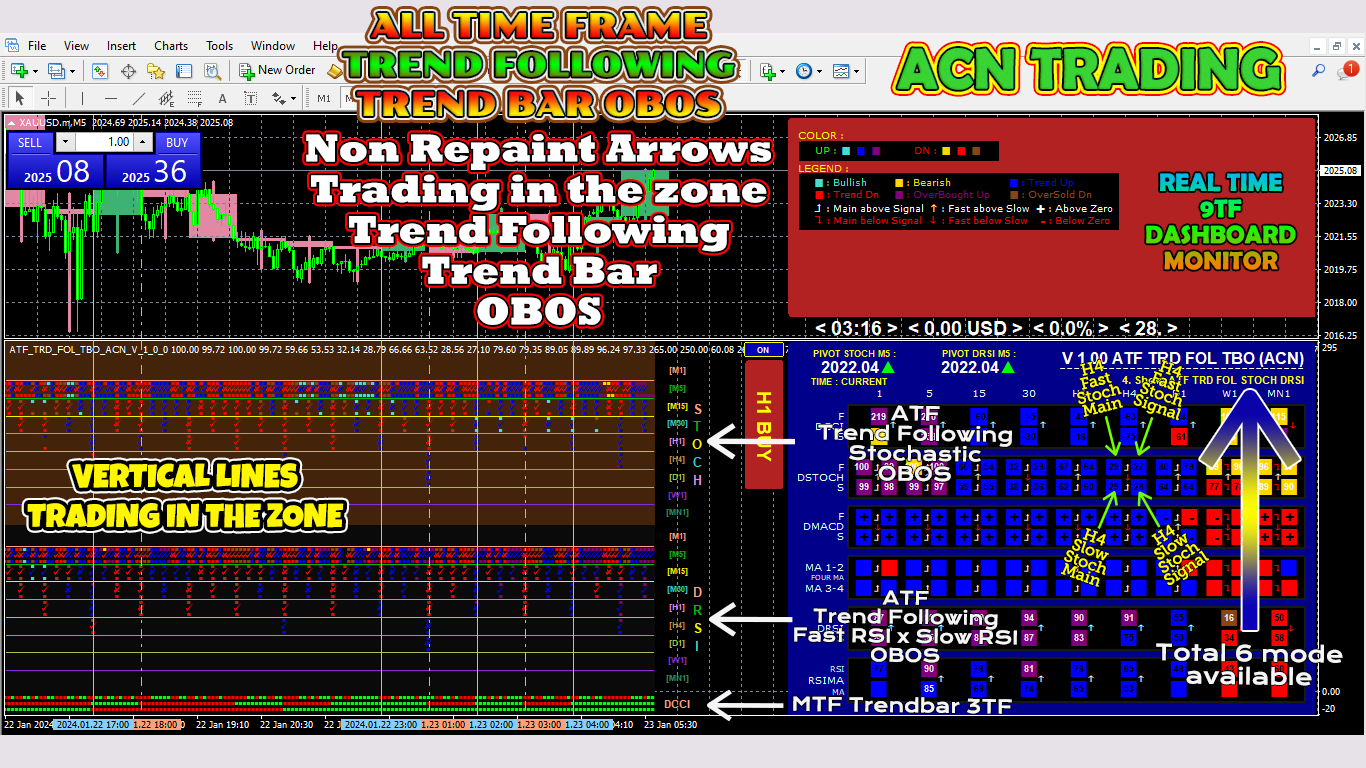
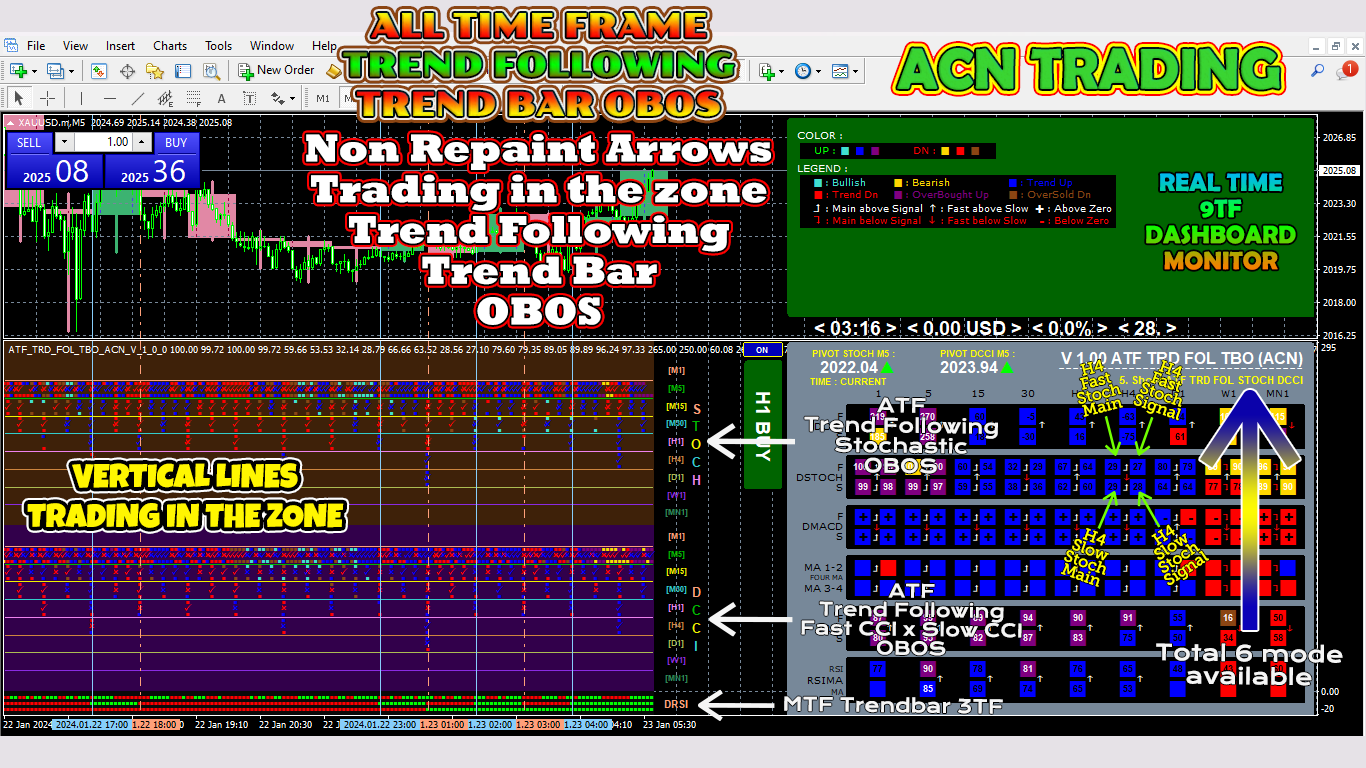
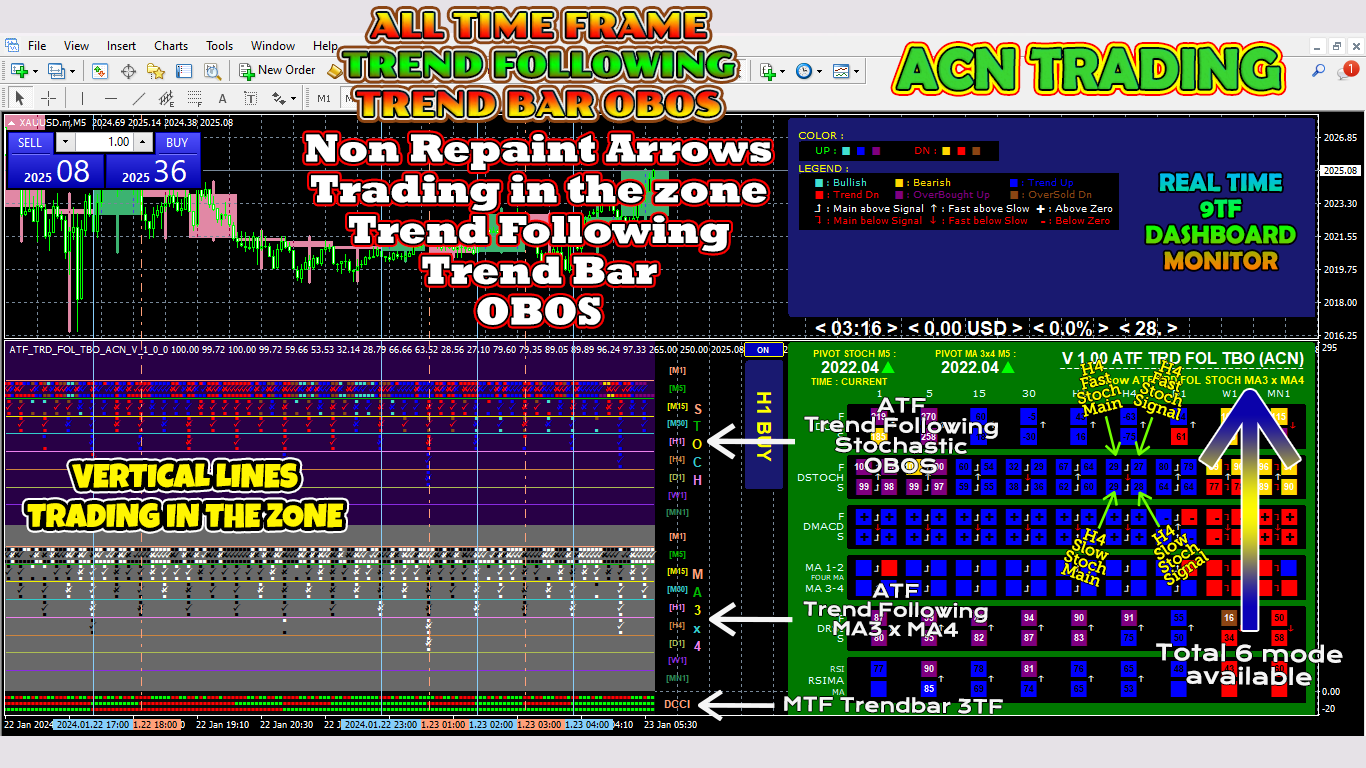
ATF Trend Following Trend Bar OBOS.
This indicator is similar to MTF PPAAF Model S but have two layers.
Click here to learn more about MTF PPAAFS.
This trading tool is equipped with various powerful features :
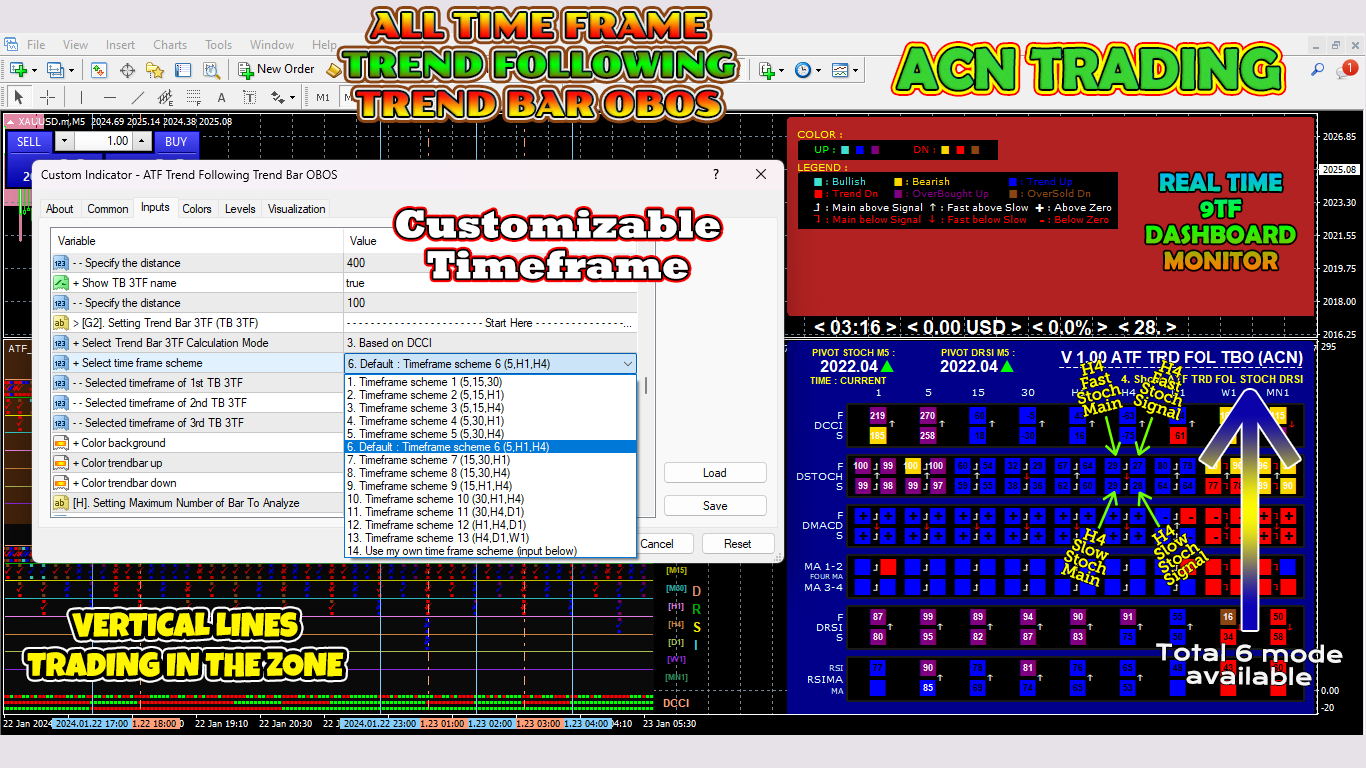
- MTF = Multi Time Frame = Time Frame can be changed.
- On/off button.
- Customizable parameter, color etc.
- Non Repaint Arrows.
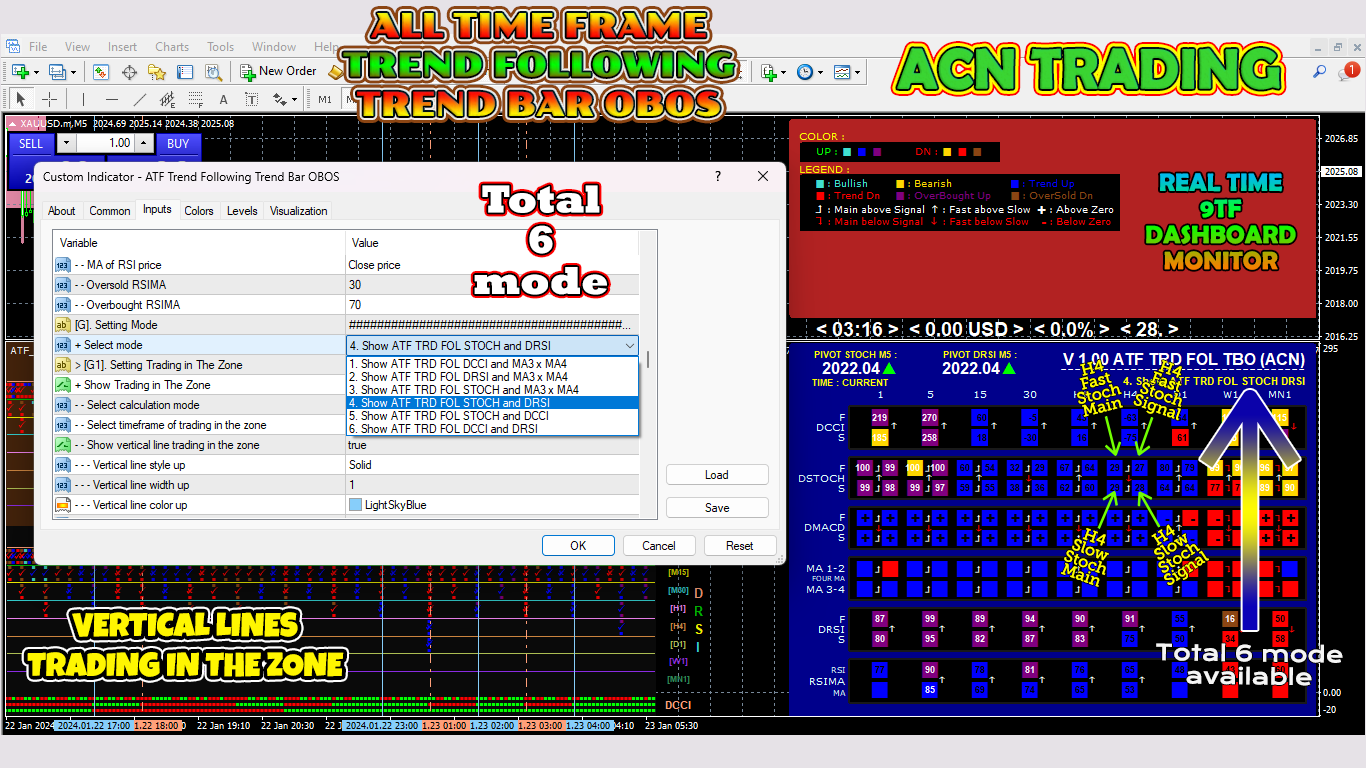
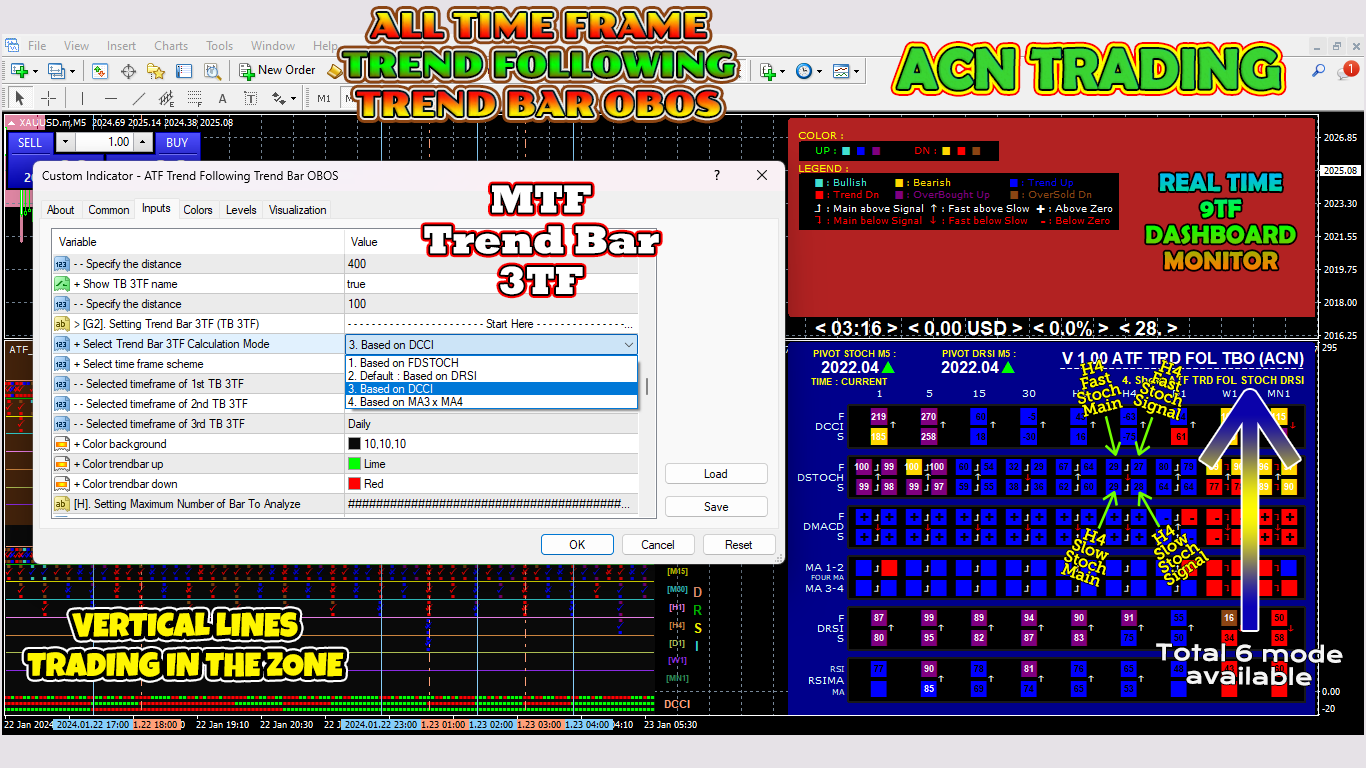
- Total 6 mode available.
- Mode 1 : Can show all time frame (ATF) fast CCI x slow CCI and MA3 x MA4.
- Mode 2 : Can show all time frame (ATF) fast RSI x slow RSI and MA3 x MA4.
- Mode 3 : Can show all time frame (ATF) fast stochastic main line x fast stochastic signal line and MA3 x MA4.
- Mode 4 : Can show all time frame (ATF) fast stochastic main line x fast stochastic signal line and fast RSI x slow RSI.
- Mode 5 : Can show all time frame (ATF) fast stochastic main line x fast stochastic signal line and fast CCI x slow CCI.
- Mode 6 : Can show all time frame (ATF) fast CCI x slow CCI and fast RSI x slow RSI.
- Can show crossover all time frame (symbol = cross).
- Can show trend following all time frame (symbol = checkmark).
- MTF Trend Bar 3TF : Stoch, DRSI, DCCI, MA3x4.
- There are 6 level color OBOS : Bullish, Bearish, Trend Up, Trend Down, OverBought Up and OverSold Down.
- Pivot level.
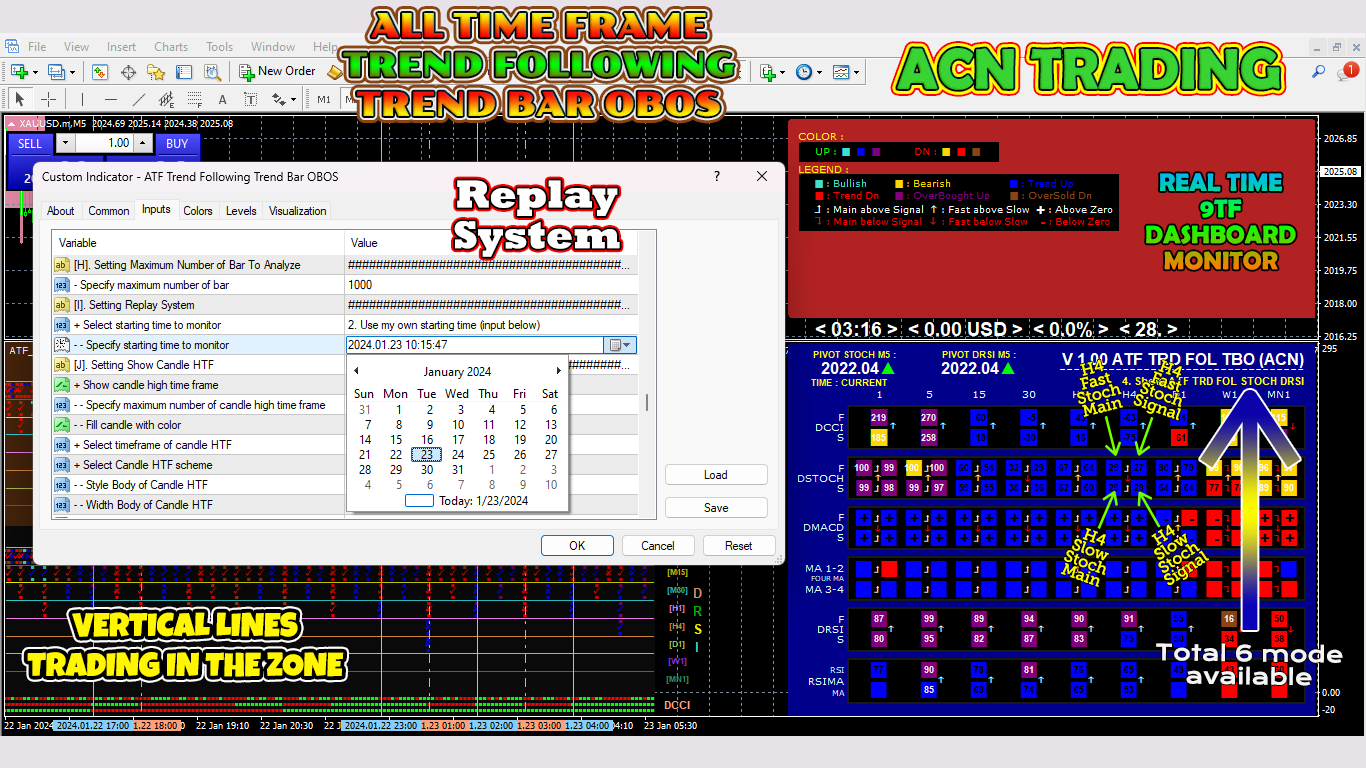
- Replay system.
- Candle high time frame.
- Beautiful 20 dashboard color scheme.
- Beautiful 11 ATF color scheme.
- TSPI = Time Spread Profit Info.
- Vertical lines trading in the zone.
- Status quo trading in the zone.
- Horizontal lines as separator.
This trading tool has gone through various in-depth research.
I am sure this tool will help you become a pro trader and achieve financial success.
Download it now.
Thank you.
#priceaction #tradingtool #stochrsi #rsiindicator #stochasticcci #ccima #stochma #movingaverage #rsima #dashboard #trading