Portfolio Command Desk
- Utilitários
-
Seckin Erkut
 Algo Trading Systems Developer. I develop strategies and portfolios not by hypes but from solid academic literature.
I put my money where my mouth is, be sure to check the performance of my EAs through my signals. - Versão: 1.0
- Ativações: 10
Envelope monitoring for multi-EA accounts. Each magic number is watched against its own backtest; you get a traffic light on the chart and an alert only when a state changes. Includes the full free measurement layer.
What it is
You run several Expert Advisors on one account. This utility reads their closed history, groups it by magic number, and watches every system against its own backtest: a traffic light on the chart, and an alert only when a state actually changes. Underneath sits a full measurement layer - per-system statistics, combined drawdown, correlation, Monte Carlo. It never places an order.
What this adds over the free Desk
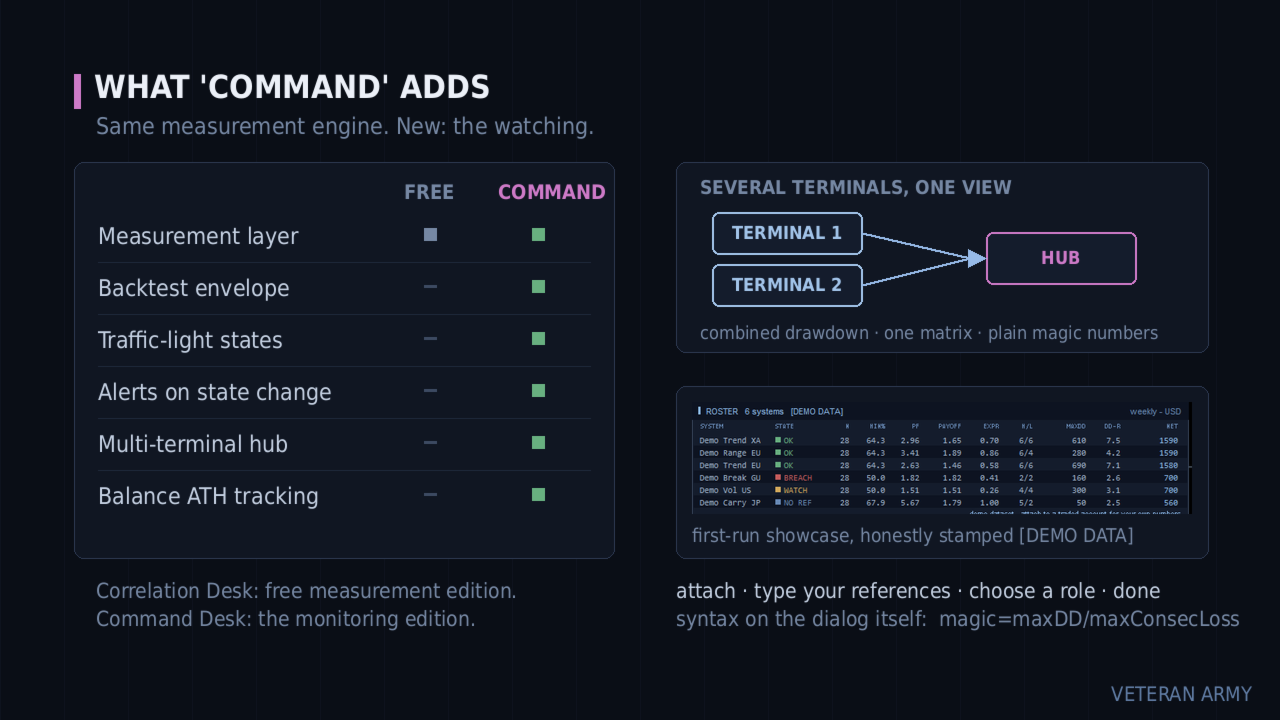
The free Portfolio Correlation Desk measures your portfolio. This one stands guard over it.
Free edition: https://www.mql5.com/en/market/product/188832
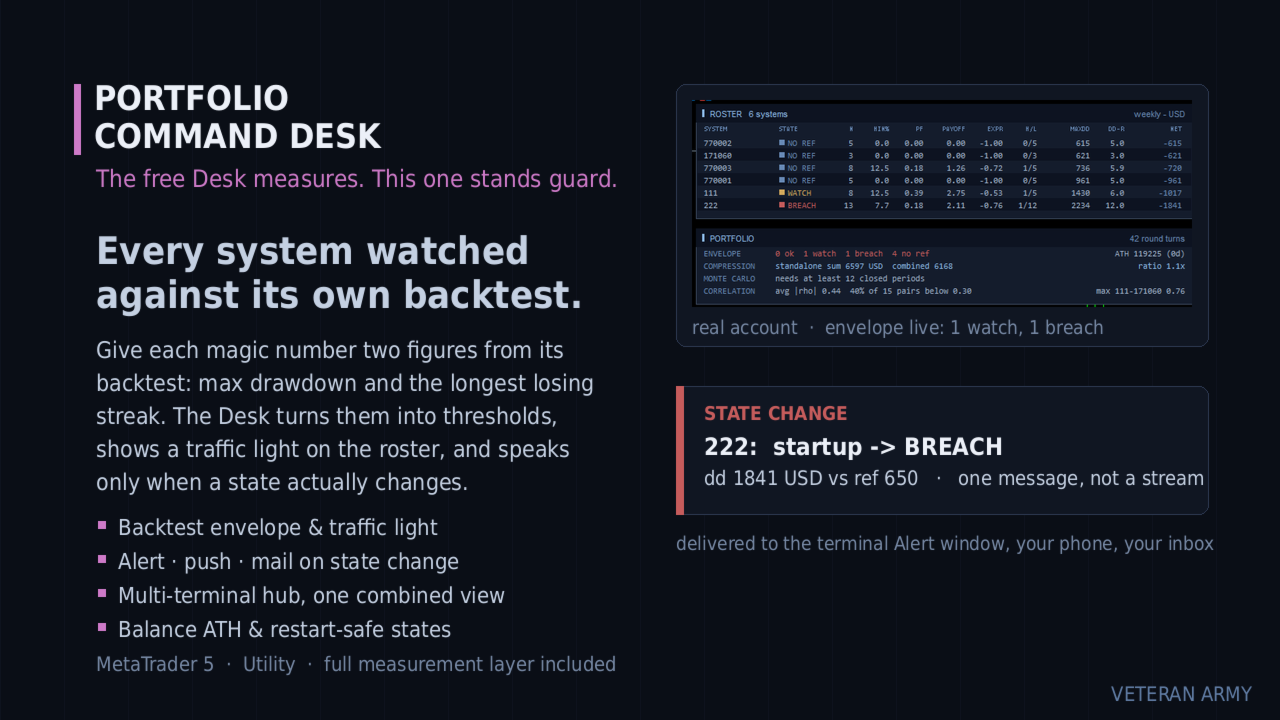
Every system is watched against its own backtest. You give each magic number two figures: the backtest maximum drawdown and the longest losing streak. The Desk turns them into thresholds and shows a traffic light on the roster - OK, WATCH, BREACH.
It speaks only when something changes. A system crossing into WATCH is one message - terminal Alert, push to your phone, e-mail, your choice. No repeats while it stays there, and one message when it recovers. Restarting the terminal does not replay old alerts.
Several terminals, one view. Run it on every MetaTrader on your VPS and let one of them aggregate the rest: one combined drawdown, one correlation matrix, one roster across all of them.
Everything the free edition measures is included and unchanged.
The envelope
The idea comes from a simple question: is this system still behaving like its backtest, or has it left that envelope?
You answer with one input line, and the syntax is printed right on the input dialog:
| 111=800/6;222=650/4 | (magic = maxDD / maxConsecLoss) |
From those two figures per system the Desk builds the thresholds:
- WATCH when the current drawdown reaches 1.5x your reference, or the live losing streak reaches max(1.5x, +3) of your reference streak.
- BREACH when the current drawdown reaches 2.0x the reference.
- OK again when it comes back down - one recovery message, not a stream. A small hysteresis band keeps a value hovering at a line from flapping.
Systems without a reference simply show a grey NO REF badge. They are still measured, just not judged.
The envelope watches the CURRENT drawdown, not the all-time record - a system that recovers turns green again, which is the whole point.
It still measures
The complete free layer is inside: per-system statistics, standalone vs combined drawdown with the compression ratio, the Monte Carlo reshuffle with percentiles, and the correlation heat map on daily, weekly or monthly profit and loss. If you only want measurement, the free Portfolio Correlation Desk is that product.
Multi-terminal
Each terminal runs the same EA with a role, named in plain words on the input dialog: "this terminal only", "publish this terminal into the hub folder", or "aggregate every published terminal".
Publishers write their closed history into the shared MetaTrader folder; the hub merges every published terminal with its own trades and runs the whole analysis on the combined data. All terminals must be on the same machine or VPS - that is where the shared folder lives. The hub view refreshes within one refresh period, about 15 seconds.
The hub shows plain magic numbers, with no terminal prefix, to keep the panel readable. For efficient tracking we recommend giving EAs on different terminals different magic numbers.
Alerts always fire on the terminal that owns the system, so nothing is ever notified twice.
The panels
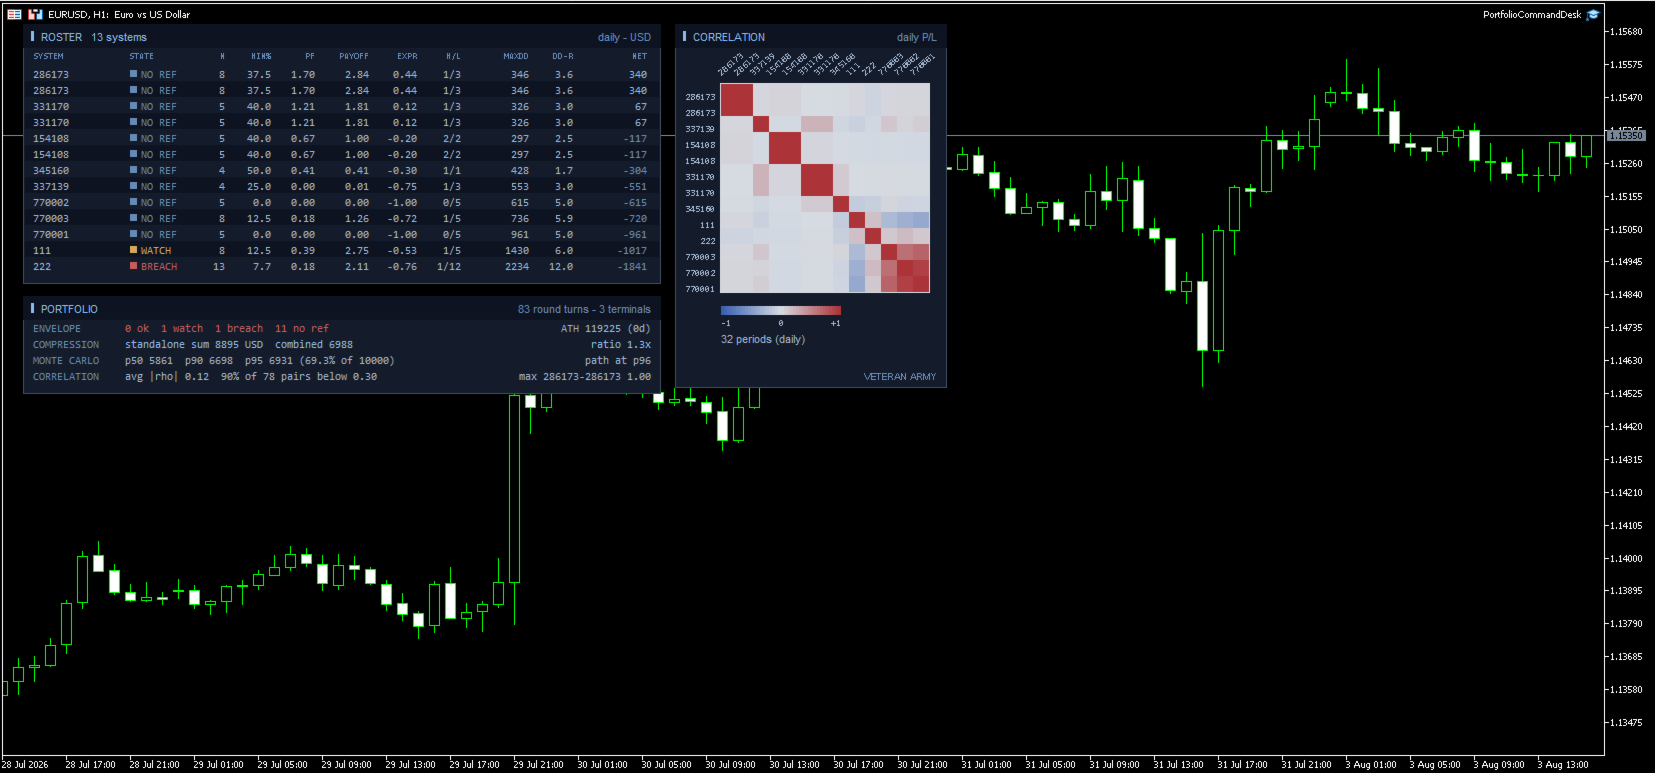
ROSTER - one row per system with a colored STATE cell, then the full statistics: trades, win rate, profit factor, payoff, expectancy in R, streaks, max drawdown, DD in R, net.
PORTFOLIO - the ENVELOPE line first (how many ok / watch / breach / no ref), with the balance all-time high and its age on the right. Then compression, Monte Carlo and correlation, as in the free edition.
CORRELATION - the heat map. Axis labels are drawn at a slant so full magic numbers stay readable even with forty systems on the grid.
A new balance high is one quiet notification too, with how long the previous peak stood.
Inputs
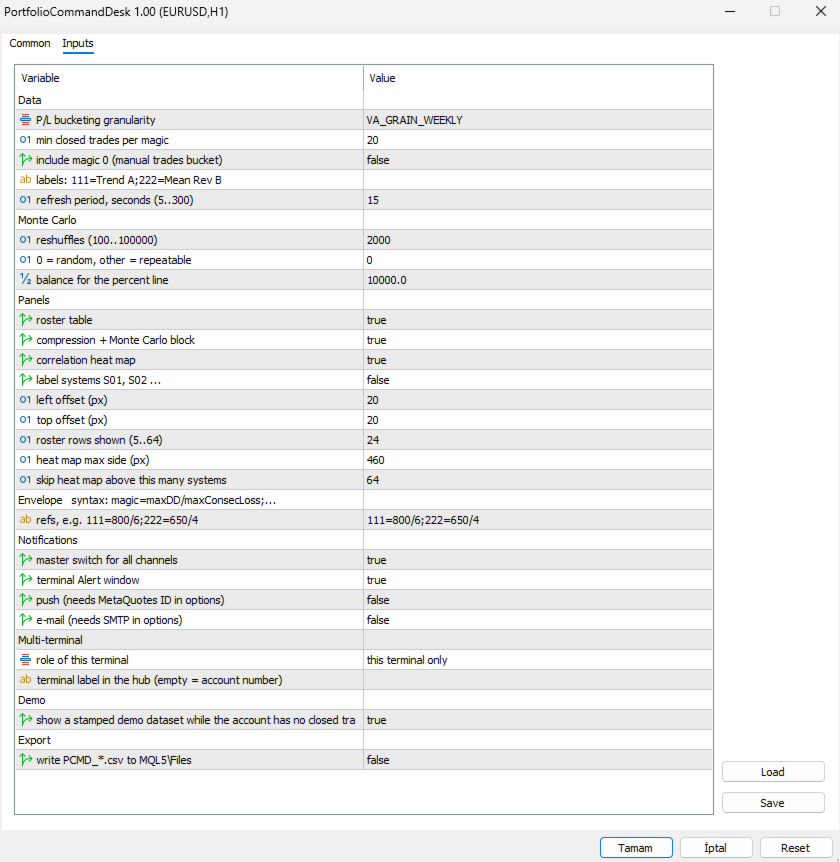
The dialog is grouped, and the envelope group carries the syntax in its own heading so you never have to look it up.
Envelope
- refs - one line, one entry per system: 111=800/6;222=650/4 . Read it as magic = maximum drawdown / longest losing streak, both taken from that system's backtest. Spaces are fine, a trailing semicolon is fine, and a repeated magic simply overrides the earlier one. Systems you leave out are still measured; they just show a grey NO REF badge instead of being judged. Malformed entries are skipped and counted in the log so a typo never passes unnoticed.
Notifications
- master switch for all channels - one flag to silence everything without losing your per-channel setup.
- terminal Alert window - the pop-up inside MetaTrader.
- push - to the MetaQuotes app on your phone. Needs your MetaQuotes ID in the terminal options; if it is missing, the log says so once.
- e-mail - needs SMTP configured in the terminal options, same one-time note if it is not.
Multi-terminal
- role of this terminal - three plain choices: this terminal only, publish this terminal into the hub folder, or aggregate every published terminal. Publishers write their history to the shared folder; the aggregator merges all of them with its own trades.
- terminal label in the hub - a short name for this terminal. Left empty it uses the account number. Only used to tell published files apart, not shown on the panel.
Data
- P/L bucketing granularity - correlate on daily, weekly or monthly results. Monthly is the default and the safest; on sparse daily buckets the empty cells pull correlations toward zero. Weekly suits accounts that trade often.
- min closed trades per magic - systems below this count are left out of the report and out of the combined portfolio, so the comparison stays like for like. Raise it if young systems are muddying the picture.
- include magic 0 - off by default. On most terminals that bucket holds manual trades and any EA left on its default magic.
- labels: 111=Trend A;222=Mean Rev B - give systems names instead of numbers: 111=Trend A;222=Mean Rev B . Names appear on the roster, the heat map axis and in the alert text.
- refresh period, seconds - how often the panel looks for new closed trades, 5 to 300. The aggregator also re-reads the published files on this beat, so it sets how fresh the combined view is.
Monte Carlo
- reshuffles - how many times your period results are reordered, 100 to 100000. 2000 is plenty.
- 0 = random, other = repeatable - the seed. 0 draws a random seed each run. Any other value makes the percentiles repeatable, which matters when the figure goes into a report or a comparison over time.
- balance for the percent line - reference balance used only to express the 95th percentile drawdown as a percentage.
Panels
- roster table, compression + Monte Carlo block, correlation heat map - turn each block on or off independently.
- label systems S01, S02 ... - hides real magic numbers behind generic labels. Useful for screenshots and for sharing results.
- left offset / top offset - where the panels sit on the chart, in pixels from the top left corner.
- roster rows shown - 5 to 64. Cap it when you have more systems than you want on screen; the ones with the largest net still come first.
- heat map max side - the largest square the grid may occupy, in pixels. The cell size follows from it.
- skip heat map above this many systems - above this count the heat map is skipped, because the grid would need more rectangles than the chart can redraw comfortably. The other panels carry on.
Demo
- show a stamped demo dataset while the account has no closed trades - a deterministic sample portfolio with the traffic light live on it, so you can see the product working before you have history. Every title carries [DEMO DATA]. Demo data never notifies, never writes CSV and never touches the state file. Your first real closed trade replaces it permanently.
Export
- write PCMD_*.csv to MQL5\Files - writes the roster (including the state column) and the correlation matrix to disk on each refresh. Disabled automatically while the demo dataset is on display.
What it does not do
It never places, modifies or closes an order. It does not produce signals or predictions. It does not connect to any network or external service - the multi-terminal hub is plain files in the shared MetaTrader folder on your own machine.
Drawdowns are measured on closed trades and do not include the floating excursion of open positions. Alerts require the terminal to be running, which on a VPS it is.
Getting started
Attach to any chart. Type your references. Turn on the channels you want. If you run several terminals, pick the roles. Done - it only talks to you when a state changes.
MetaTrader 5.