Volume Trio

Three institutional lenses. One deterministic engine.

Most tools show you one dimension of the market. This indicator fuses the three that professionals cross-check constantly — and makes them talk to each other on a single chart:

  • WHERE — Session Volume Profile. Per-session horizontal profiles with POC, VAH/VAL and a shaded Value Area, split into buying vs. selling pressure. You see the levels the market has actually accepted — and the thin air pockets it hasn't.
  • WHEN — CVD Pressure Divergence. A signed volume-pressure histogram with a strict, multi-gate Regular divergence engine (Classic -> Continuity -> Swing -> Minimum Separation). Confirmed +RD/-RD events are drawn on price and on the pane, with rich hover tooltips, alerts and live counters. An optional Micro 5m confirmation validates pivots with closed 5-minute sub-bars for an earlier known-time. 
  • HOW FAR — Anchored VWAP with sigma bands. Daily/Weekly/Monthly VWAP with +/- standard-deviation bands (default 2.0). Hover any line and a tooltip tells you exactly what you are looking at.

Plus an independent ET (Exhaustion Trajectory) lane that flags when the participation behind a sustained push is fading — a slow "pay attention" flag, deliberately separate from the divergence engine.


Why the combination is the edge

Each layer filters the noise of the others. A divergence alone is a statistic; a divergence at the POC or a Value Area edge is pressure disagreement meeting a level the market has already proven it defends. A 2-sigma VWAP tag

alone is just stretch; stretch plus a fading-pressure print plus a profile shelf underneath is a complete, three-dimensional context. That cross-confirmation is what one-dimensional indicators cannot give you.


Two strategy hints to explore

  1. Reversion at the band. Try the m15 and m5 timeframe: when price tags the 2.0 standard-deviation VWAP band, watch for a CVD divergence print, targeting a rotation back to VWAP or the session POC. In our observation, divergences that print inside key Volume Profile zones — the POC, the VAH/VAL boundaries, or a prior session's ledge — are considerably more decisive than those appearing in low-volume gaps.
  2. Continuation at VWAP. Note which side of VWAP price has been accepted on today — where most bars have closed so far. When price stretches away on that side and then returns to VWAP, watch for a reversal print at the line: a CVD divergence back in the accepted direction, or an ET flag against the pullback. The idea is that the accepted side reasserting itself at VWAP is the day's trend defending its average. Treat the print as context for your own timing and exits, not as a mechanical trigger.

Both are research starting points, not trading systems: forward-test them yourself, on your own instruments, spreads and sessions, before risking anything. Past behaviour never guarantees future results.

Don't have time to track your whole watchlist?

Volume Trio Multi is the Pro edition of this indicator. The engine is the same. It alerts you when the stars are aligned for a pair in your watchlist.

If you want to track many pairs at the same time without spending hours watching charts, that is what Multi is built for. The terminal does the watching; you step in only when something actually lines up. And when you do open a chart, more of the profile's history is already drawn for you: where value formed during the session, where it moved, and which levels the market has left unfinished.

What it adds first is a watchlist scanner: the same three-layer logic run across the symbols already in your Market Watch, on a timeframe you choose, with an alert for each of the two strategy hints above — the reversion reading, when a divergence lines up with a sigma-band tag or a key profile zone, and the continuation reading, when the day's accepted side of VWAP defends the line with a divergence in its direction. A dashboard shows every symbol's state at a glance, and clicking a row opens that chart.

Beyond the scanner: composite profiles over the last N sessions or a custom date range, developing POC and Value Area traces with VPOC migration, naked POC tracking, and hover tooltips on every line drawn on the chart.

In short: this free version reads one chart. Multi watches your whole list.

For Multi Version: https://www.mql5.com/en/market/product/188176

This free edition stays free and stays complete. It is not a trial, and nothing here is time-limited or reduced in function.


Built honestly

  • All readings derive from provider-local volume and OHLC — a pressure proxy, not centralized order flow. Markers are context, never buy/sell signals.
  • Fully deterministic on closed bars: reloads and timeframe switches reproduce the identical event history.
  • Auto profiles tuned for 5m / 15m / 30m; graceful manual fallbacks everywhere (nothing silently goes dark).
  • Diagnostics panel exposes the whole engine: every counter, every rejection gate, the full ET state.
  • Three master layer toggles, dark/light auto theme, alert channels (popup / sound / push), English glossary panel.


Quick start

  1. Drop it on a 5m or 15m chart with defaults (Auto profile does the tuning).
  2. Hover the blue VWAP line and its dotted bands — the tooltips introduce themselves.
  3. Turn on the Diagnostics and Glossary panels while you learn the markers, then switch them off.
This tool provides analytical context only and makes no profitability claims.

Trading involves substantial risk; test every idea independently.

Every abbreviation on the chart

Main chart (price window)

Mark Meaning How to read it
POC (gold bar + label) Point of Control — the price level with the highest traded activity of that session's profile The session's strongest "magnet" / acceptance level. Price tends to revisit it.
VAH (green label) Value Area High — upper boundary of the zone holding the configured percent (default 70%) of session activity Above VAH = price trading at a premium vs. the session's accepted value.
VAL (green label) Value Area Low — lower boundary of the same zone Below VAL = price trading at a discount vs. accepted value.
Profile bars (horizontal green/red) Per-price-level activity, split into buying vs. selling pressure by the proxy Long bars = heavy acceptance ("shelves"). Thin gaps = low-volume air pockets price crosses quickly.
Shaded band The Value Area itself The session's "fair" zone between VAH and VAL.
Dotted vertical line Session boundary (Daily / Weekly / Monthly anchor) Each profile is built per session.
Blue line Anchored VWAP — volume-weighted average price since the session anchor The session's volume-fair price. Hover it: a tooltip confirms what it is.
Dotted blue lines VWAP sigma bands — VWAP +/- (multiplier x standard deviation), default 2.0 Statistical stretch. Hover a band: the tooltip shows the exact multiplier.
C +RD / C -RD (green / red) Confirmed Regular Divergence, bullish (+) or bearish (-), confirmed by Standard chart bars Price made a lower low while the pressure index made a higher low (+RD), or a higher high with a lower pressure high (-RD). The connecting line joins the two pivot origins.
M +RD / M -RD The same event confirmed by Micro 5m mode Identical logic; the pivot was validated earlier using a quota of closed 5-minute sub-bars instead of full chart bars.
ET+ (cyan) Exhaustion Trajectory, bullish setup proxy Price kept pressing lower while downside participation faded sharply in the second half of the measured window. Watched as bullish-reaction context.
ET- (orange) Exhaustion Trajectory, bearish setup proxy Price kept pressing higher while upside participation faded. Watched as pullback context.

Every divergence and ET label carries a hover tooltip with the measured span, the price change, the pressure-index change and a plain-language interpretation.


Indicator pane (bottom window)

Element Meaning
Histogram Signed volume-pressure proxy: rolling sum (Periodic) or EMA of the per-bar pressure delta. Green above zero = net buying pressure, red below = net selling pressure.
Muted hues by design so markers stay readable.
Divergence lines + C/M labels The pane mirror of every confirmed divergence, joining the two pressure pivots.
Diagnostics panel (optional, top-right) Live engine state: timeframe/profile, pressure mode, pivot geometry, confirmation mode, structure guard, continuity epochs, pivot/event counters, rejection counters
(E=epoch, S=swing, M=min-separation, Q=micro quota), full ET status, layer toggles.
Glossary panel (optional, top-left) A one-screen reminder of every abbreviation.


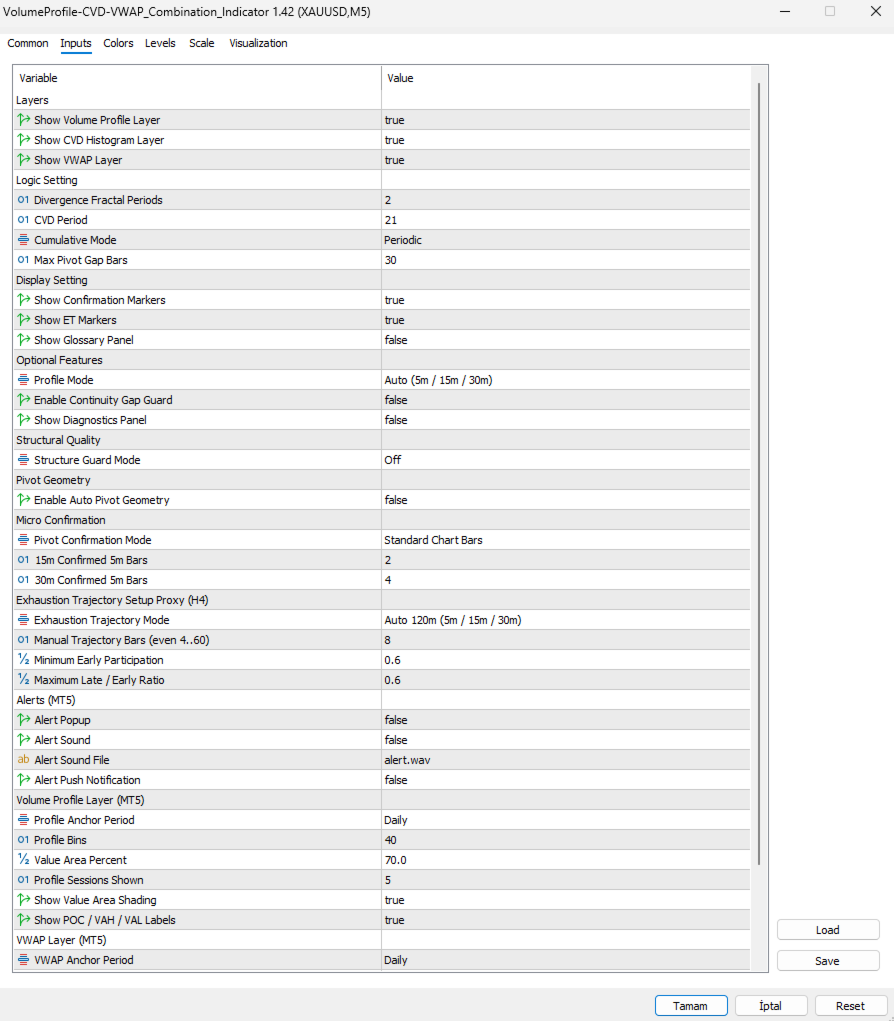
Inputs, group by group

Layers
  • Show Volume Profile / CVD Histogram / VWAP Layer — master switches. The CVD engine keeps computing even when its plot is hidden, so divergences and alerts stay alive.
Logic Setting
  • Divergence Fractal Periods (2) — manual pivot width (left/right bars in Standard mode; left width in Micro mode).
  • CVD Period (21) — window of the pressure histogram (Periodic sum or EMA).
  • Cumulative Mode (Periodic) — Periodic = moving sum of the last P deltas; EMA = exponential average, faster on new bars.
  • Max Pivot Gap Bars (30) — exclusive upper bound for the distance between the two divergence pivots.
Display Setting
  • Show Confirmation Markers (on) — C/M +/-RD labels only; lines, counters and alerts are unaffected.
  • Show ET Markers (on) — ET+/ET- labels only; ET events and alerts continue.
  • Show Glossary Panel (off) — the abbreviation cheat-sheet.
Optional Features
  • Profile Mode (Auto) — on exact 5m/15m/30m charts, P/Trend/Gap auto-set to 63/150/<90, 21/50/<30, 11/25/<15. Elsewhere the Manual values apply.
  • Enable Continuity Gap Guard (off) — rejects pivot pairs separated by a chart-time gap larger than 1.5x the nominal bar; weekend gaps count.
  • Show Diagnostics Panel (off) — the live engine table.
Structural Quality
  • Structure Guard Mode (Off) — optional extra admission rules: Swing Guard (an opposite pivot must sit between the pair), Minimum Separation (gap >= Left + right-footprint + 1), or both.
Pivot Geometry
  • Enable Auto Pivot Geometry (off) — on 5m/15m/30m uses L=4/3/2 with R=2 instead of the manual n/n.
Micro Confirmation
  • Pivot Confirmation Mode (Standard) — Standard = classic right-side chart bars. Micro 5m = the pivot on the previous closed host bar is validated by a quota of closed 5-minute sub-bars, giving an earlier known-time. Only on exact 15m/30m charts; elsewhere it falls back to Standard.
  • 15m / 30m Confirmed 5m Bars (2 / 4) — the closed sub-bar quota. Touching the pivot level exactly is tolerated; a decisive break before the quota completes cancels the candidate.
Exhaustion Trajectory Setup Proxy (H4)
  • Exhaustion Trajectory Mode (Auto 120m) — Auto uses W=24/8/4 bars on 5m/15m/30m; elsewhere the Manual window applies as chart bars.
  • Manual Trajectory Bars (8) — even 4..60; the observation window W. The engine needs 4W bars of clean history (3W calibration + W observation).
  • Minimum Early Participation (0.60) — required early-half intensity, normalized by the prior 3W mean absolute delta.
  • Maximum Late / Early Ratio (0.60) — how much of the early intensity may survive into the late half; lower = stricter fade requirement.
Alerts (MT5)
  • Popup / Sound / Sound File / Push — delivery channels for divergence and ET alerts. All default off; events fire on the live closed bar only.
Volume Profile Layer
  • Profile Anchor Period (Daily), Profile Bins (40), Value Area Percent (70), Profile Sessions Shown (5), Show Value Area Shading (on), Show POC / VAH / VAL Labels (on).
VWAP Layer
  • VWAP Anchor Period (Daily), Show VWAP Sigma Bands (on), VWAP Band Multiplier (2.0).
Appearance
  • Color Theme (Auto — follows the chart background), Max Drawn
  • Divergences (150 — older drawings are pruned; counters keep the truth).


Practical notes

  • Load on m15 or m5 with defaults for the tuned experience (Auto profile). Micro 5m mode requires M5 history; the indicator retries automatically while the terminal downloads it.
  • Open the Diagnostics panel whenever something looks quiet — the rejection counters tell you exactly which gate is filtering candidates.
  • The engine is fully deterministic on closed bars: scrolling back, reloading or switching timeframes reproduces the identical event history.

Produtos recomendados
Value Chart Candlesticks
Flavio Javier Jarabeck
4.57 (14)
The idea of a Value Chart indicator was presented in the very good book I read back in 2020 , " Dynamic Trading Indicators: Winning with Value Charts and Price Action Profile ", from the authors Mark Helweg and David Stendahl. The idea is simple and the result is pure genius: Present candlestick Price analysis in a detrended way! HOW TO READ THIS INDICATOR Look for Overbought and Oversold levels. Of course, you will need to test the settings a lot to find the "correct" one for your approach. It
FREE
Daily High Low Danilo Monteiro
Danilo Hudson Couto Monteiro
4 (2)
# Indicador Daily High - Danilo Monteiro - MT5 ## Descrição O Daily High/Low Labels é um indicador personalizado para MetaTrader 5 que exibe automaticamente as máximas e mínimas diárias no gráfico, facilitando a identificação rápida dos níveis importantes de preço. O indicador marca os preços com etiquetas e linhas horizontais, permitindo uma visualização clara dos níveis críticos do dia atual e anterior. ## Principais Características ### 1. Marcação Automática - Exibe automaticamente as máxi
FREE
LT Donchian Channel
Thiago Duarte
4.86 (7)
Donchian Channel (ou canal de Donchian) é um indicador criado por  Richard Donchian. Ele é  formado tomando a máxima mais alta e a mais baixa mais baixa do último período especificado em velas. A área entre alta e baixa é o canal para o período escolhido. Sua configuração é simples. É possível ter a média entre a linha superior e inferior além de alertas quando o preço atinge um dos lados. Se tiver alguma dúvida ou encontrar alguma falha, me contate. Faça bom uso!
FREE
Institutional Tick Engine Lite: Ferramenta de Velocidade de Ticks e Reversão Institutional Tick Engine Lite é um indicador técnico projetado para analisar a velocidade do mercado e a lógica da microestrutura usando dados brutos de ticks. Processa dados em tempo real para fornecer métricas para scalping e day trading. Recursos Incluídos Monitor de Velocidade de Ticks: Histograma em tempo real mostrando "Ticks Por Segundo" (TPS). Sinais de Reversão (Lite): Identifica pontos de reversão prováveis b
FREE
Indicador Regressão Linear – Par de Ativos - INTRADAY Indicador é um oscilador que faz o plot do Resíduo resultado da regressão linear entre os dois ativos inseridos como input do indicador, representado pela fórmula: Y = aX + b + R Onde Y é o valor do ativo dependente, X é o valor do ativo independente, a é a inclinação da reta entre os dois ativos, b é a intersecção da reta e R é o resíduo. O resíduo representa a quantidade da variabilidade que Y que o modelo ajustado não consegue explicar. E
FREE
MIDAS Super VWAP
Flavio Javier Jarabeck
4.27 (11)
Imagine VWAP, MVWAP and MIDAS in one place... Well, you found it! Now you can track the movement of Big Players in various ways, as they in general pursue the benchmarks related to this measuring, gauging if they had good execution or poor execution on their orders. Traders and analysts use the VWAP to eliminate the noise that occurs throughout the day, so they can measure what prices buyers and sellers are really trading. VWAP gives traders insight into how a stock trades for that day and deter
FREE
Follow The Line MT5
Oliver Gideon Amofa Appiah
4.6 (35)
This indicator obeys the popular maxim that: "THE TREND IS YOUR FRIEND" It paints a GREEN line for BUY and also paints a RED line for SELL. (you can change the colors). It gives alarms and alerts of all kinds. IT DOES NOT REPAINT and can be used for all currency pairs and timeframes. Yes, as easy and simple as that. Even a newbie can use it to make great and reliable trades. NB: For best results, get my other premium indicators for more powerful and reliable signals. Get them here: https://www.m
FREE
Heiken Ashi Smoothwave
Alexandre Vincent Traber
Visão geral Heiken Ashi Smoothwave transforma seu gráfico em velas Heiken Ashi suavizadas diretamente na janela principal do gráfico, substituindo as velas padrão para uma visão de tendência mais limpa. Sem janela separada, sem confusão. Como funciona Calcula os valores OHLC de Heiken Ashi a partir de dados reais de preço em cada barra. Plota velas Heiken Ashi coloridas diretamente sobre o gráfico principal. Oculta automaticamente as velas nativas do gráfico, deixando visíveis apenas as velas H
FREE
Girassol Sunflower MT5 Indicator
Saullo De Oliveira Pacheco
3.86 (7)
Este é o famoso indicador Girassol para Metatrader5. Este indicador marca possíveis topos e fundos nos gráficos dos preços. O indicador identifica topos e fundos no historico de preços do ativo, tenha em mente que o girassol atual, do ultimo candle repinta, pois não é possivel identificar um topo até que o mercado reverta e também não é possivel identificar um fundo sem que o mercado para de cair e comece a subir. Se você estiver procurando por um programador profissional para Metatrader5, entre
FREE
VWAP and MVWAP
Flavio Javier Jarabeck
4 (9)
Volume Weighted Average Price (VWAP) is a trading benchmark commonly used by Big Players that gives the average price a Symbol has traded throughout the day. It is based on both Volume and price. Additionally we put in this indicator the MVWAP (Moving Volume Weighted Average Price). For those who do not know the usage and the importance od this indicator I recommend a great article about this subject at Investopedia ( https://www.investopedia.com/articles/trading/11/trading-with-vwap-mvwap.asp )
FREE
Stackable VWAP
Flavio Javier Jarabeck
3.5 (4)
Volume Weighted Average Price (VWAP) is a trading benchmark commonly used by Big Players that gives the average price a Symbol has traded throughout the day. It is based on both Volume and price. Additionally we put in this indicator the MVWAP (Moving Volume Weighted Average Price). For those who do not know the usage and the importance od this indicator I recommend a great article about this subject at Investopedia ( https://www.investopedia.com/articles/trading/11/trading-with-vwap-mvwap.asp
FREE
Donchian Breakout And Rsi
Mattia Impicciatore
4.5 (2)
Descrição geral Este indicador é uma versão aprimorada do Canal Donchian clássico, enriquecida com funções práticas para o trading real. Além das três linhas padrão (máxima, mínima e linha do meio), o sistema detecta breakouts e os mostra visualmente com setas no gráfico, exibindo apenas a linha oposta à direção da tendência atual para uma leitura mais limpa. O indicador inclui: Sinais visuais : setas coloridas nos breakouts Notificações automáticas : alerta pop-up, push e e-mail Filtro RSI : pa
FREE
Phoenix Delta Volume
Nigel Nii Darku Narnor Darko
5 (1)
This is the Phoenix Institutional SMC Dashboard (Emerald-Teal Edition). It is engineered to provide retail traders with the same "Volume-at-Price" clarity used by institutional desks. Below is a full breakdown of the benefits, the high-confluence logic for entries, and how to manage your trades using the current visual engine. Strategic Benefits to the User Sentiment over Price: Most indicators only look at where the price is. This dashboard tells you how much effort (Volume Delta) was required
FREE
Support and Ressistance
Raphael Lorenz Baumgartner
Suporte e Resistência do Último Dia Plataforma: MetaTrader 5 Tipo: Indicador personalizado Exibição: Janela do gráfico (sobreposição) Funções: Calcula zonas de suporte e resistência com base nos máximos e mínimos do dia anterior. Usa uma janela deslizante ( SampleWindowSize ) para detectar faixas de preço recentes. Detecta suporte quando a faixa de preços atual está abaixo dos extremos anteriores. Detecta resistência quando a faixa de preços está acima. Mostra quatro buffers: LDResistanceHigh –
FREE
Waves Sizer
Flavio Javier Jarabeck
3.86 (7)
Wyckoff fans, enjoy! Ideally to be used with the Weis Waves indicator, but it can be easily used alone, the Waves Sizer puts the range (in resulting Price movement) done by the Price on its market swings. You can control how accurate or loose will be the swings. This tool is very helpful for visually know how much the Price has traveled in your Timeframe. This way you can confront this level of effort with the resulting Volume, etc... Weis Waves indicator: https://www.mql5.com/en/market/produc
FREE
Super Trend eu
Emin Ulucanli
4.83 (6)
SUPERTREND; É um indicador de tendência baseado no SuperTrend ATR criado por Olivier Seban. Ele pode ser usado para detectar mudanças na direção da tendência e localizar paradas. Quando o preço cai abaixo da curva do indicador, ele fica vermelho e indica uma tendência de baixa. Por outro lado, quando o preço se move acima da curva, o indicador fica verde, indicando uma tendência de alta. Como outros indicadores, funciona bem em SuperTrend quando usado em conjunto com outros indicadores como MACD
FREE
Dual RSI
Paul Conrad Carlson
3.5 (2)
Indicator alerts for Dual Relative strength index rsi. Large rsi preset at 14 is below 30 small rsi preset at 4 is below 10 for buy bullish signals . Large rsi preset are 14 is above 70 small rsi preset at 4 is above 90 for sell bearish signals . Includes mobile and terminal alerts. draws lines when alerts. This indicator can help identify extremes and then the tops or bottoms of those extremes .
FREE
RaysFX Pattern Detector è uno strumento di analisi tecnica all'avanguardia progettato per i trader che basano le loro decisioni sull'azione dei prezzi (Price Action). Questo indicatore scannerizza automaticamente il grafico in tempo reale per identificare e segnalare i pattern candlestick più affidabili e noti, eliminando il lavoro manuale e aiutandoti a non perdere mai un'opportunità di trading. Che tu sia un trader discrezionale, un principiante che sta imparando a riconoscere le candele, o un
FREE
VWAP Indicator
LUC JACOBUS A VERHEECKE
4.11 (27)
Volume Weighted Average Price (VWAP) The volume weighted average price (VWAP) is a  trading   benchmark  used by traders that gives the average price a security has traded at throughout the day, based on both volume and price. It is important because it provides traders with insight into both the trend and value of a security. This indicator VWAP V2 is free and is the manual version of the extended Easy VWAP indicator (30 Euro), where the date and time properties are automatically entered. With
FREE
Renko subwindow
Alexandre Vincent Traber
Overview Renko SubWindow desenha um gráfico Renko em velas coloridas numa janela de indicador separada, sem afetar o gráfico principal. O tamanho do tijolo pode ser fixo em pontos ou calculado dinamicamente via ATR para tijolos adaptativos baseados na volatilidade. How it works Reconstrói os tijolos Renko a partir dos preços de fecho do símbolo/timeframe atual. Um novo tijolo é formado quando o preço ultrapassa o tamanho definido a partir do fecho do tijolo anterior. Os tijolos são representado
FREE
Profissional de entrada de tendência premium TZ Trade Logics, apresenta a você a versão aprimorada da entrada de tendência Premium Este lançamento traz a você um estado de negociação muito mais relaxado com recursos avançados para filtragem de tendências e tempos de entrada de sinais premium. Para nós, não é a criação do produto que importa! mas continuada manutenção e educação aos usuários. por meio de nossos meios dedicados de chegar até nós, você terá um guia detalhado sobre como usar o p
FREE
PROMETHEUS TECHNICAN VERSION Free | By THE SONS A gift from The Sons — no strings, no trial, no expiry. Every trader deserves access to professional-grade market intelligence. That belief is why Prometheus Technical Version exists, and why it costs nothing. Consider it our handshake to the trading community. What You're Getting This is not a simplified tool dressed up as a gift. Prometheus Technican Version is a fully built, institutional-quality technical analysis indicator running a dual-model
FREE
Basic Vwap
james mugendi
4 (1)
Simple Vwap with the daily, weekly and monthly VWAP is the abbreviation for   volume-weighted average price , which is a technical analysis tool that shows the ratio of an asset's price to its total trade volume. It provides traders and investors with a measure of the average price at which a stock is traded over a given period of time. How it's used Identify entry and exit points:   Traders can use VWAP to determine when to buy or sell an asset.   Understand price trends :  Traders can use V
FREE
DS RVOL: The Relative Volume Indicator for MT5 RVOL is a straightforward Relative Volume (RVOL) indicator for MetaTrader 5. It shows you how current volume compares to a historical average, providing a quick way to gauge the strength of a price move. How it Works Relative Volume is a simple ratio: R V O L = C u rre n t V o l u m e ​/ A v er a g e H i s t or i c a l V o l u m e RVOL > 1.0 : Volume is higher than usual. This suggests there's strong interest and potential for a sustained move. RVOL
FREE
Wave Box Market Frenquency
Jean Jacques Huve Ribeiro
4.75 (4)
Totally linked to the result of a movement and the duration he had. Its height records how many ticks the asset walked during a given movement, its width shows us the duration that movement had. Its configuration must be in line with the Weis Wave Indicator configuration to observe the movement force and can indicate a possible accumulation or distribution of the movement;
FREE
Weis Wave Scouter Basic
Jean Carlos Martins Roso
5 (1)
O Weis Wave Scouter Basic é a versão essencial do nosso renomado indicador para MetaTrader 5, projetado para traders que desejam explorar os conceitos do método Wyckoff e da análise VSA (Volume Spread Analysis) de forma acessível e eficiente. Baseado na leitura de ondas de volume, este indicador simplificado permite identificar os movimentos de mercado com clareza, focando nos princípios de esforço x resultado e oferta e demanda, conforme ensinado por Richard Wyckoff. Com o Weis Wave Scouter Bas
FREE
VWAP + Volume Profile Combined Indicator FREE Launch Offer OVERVIEW Professional combination of VWAP (Volume Weighted Average Price)  and Volume Profile in a single MT5 indicator. This powerful tool  combines two of the most respected institutional trading tools  into one seamless display. KEY FEATURES 1. VWAP with 6 calculation modes 2. Volume Profile with Value Area analysis 3. Point of Control identification 4. Standard deviation bands 5. Dynamic color changing 6. Separate buy/sell vol
FREE
Swiss VWAPsimple
Terence Gronowski
4.8 (5)
Swiss VWAPsimple Motivation Did not find free VWAP that works, the one that I found craseh. So I created a VWAP which calculates values only for the actual day. So computer resouces are not over stressed. What is VWAP, how is it used?  VWAP stands for Volume Weighed Average Price, it calculates the running sum of tick volume and the runnung sum of price times tickvolume. The division of these sums result in a weighed price (Sum P*V/Sum V). The calculation starts normally at midnight. The values
FREE
VolumeBasedColorsBars
Henrique Magalhaes Lopes
VolumeBasedColorsBars — Free Powerful Volume Analysis for All Traders Unlock the hidden story behind every price bar! VolumeBasedColorsBars is a professional-grade, 100% FREE indicator that colorizes your chart candles based on real, adaptive volume analysis. Instantly spot surges in market activity, identify exhaustion, and catch the moves that matter. This indicator gives you:    • Dynamic color-coded bars for instant volume context    • Adaptive thresholds based on historical, session-awar
FREE
Tabajara V5
Flavio Javier Jarabeck
4.84 (37)
Metatrader 5 version of the famous Andre Machado's Tabajara indicator. If you don't know Andre Machado's Technical Analysis work you don't need this indicator... For those who need it and for those several friend traders who asked this porting from other platforms, here it is... FEATURES 8-period Moving Average 20-period Moving Average 50-period Moving Average 200-period Moving Average Colored candles according to the inflexion of the 20-period MA SETTINGS You can change the Period of all MA's
FREE
Os compradores deste produto também adquirem
Este produto foi atualizado para o mercado de 2026 e otimizado para as versões mais recentes do MT5. AVISO DE ATUALIZAÇÃO DE PREÇO: Smart Trend Trading System está atualmente disponível por $99 . O preço aumentará para $199 após as próximas 30 compras . OFERTA ESPECIAL: Após comprar o Smart Trend Trading System, envie-me uma mensagem privada para receber o Smart Universal EA GRÁTIS e transformar seus sinais do Smart Trend em operações automatizadas. Smart Trend Trading System é um sistema de tr
Trend Sniper X
Sarvarbek Abduvoxobov
4.88 (32)
Trend Sniper X é um indicador de acompanhamento de tendência para múltiplos tempos gráficos no MetaTrader 5 que ajuda os traders a identificar a direção da tendência e potenciais pontos de reversão com clareza e precisão. para MT4: https://www.mql5.com/en/market/product/193245 Informações sobre o preço: O preço atual é promocional e está sujeito a alterações à medida que novas atualizações e funcionalidades forem lançadas. Oferta Bônus: Para obter o Auto-Trade Assistant EA GRATUITO para este in
Vamos ser honestos primeiro. Nenhum indicador sozinho vai te tornar lucrativo. Se alguém te disser o contrário, está te vendendo um sonho. Qualquer indicador que mostre setas perfeitas de compra/venda pode ser feito para parecer impecável — basta dar zoom na parte certa da história e tirar um print das operações vencedoras. Nós não fazemos isso.  SMC Intraday Formula é uma ferramenta. Ela lê a estrutura do mercado para você, identifica as zonas de maior probabilidade de preço e mostra exatament
Neuro Poseidon MT5
Daria Rezueva
4.79 (53)
Neuro Poseidon is a new indicator by Daria Rezueva. It combines precise trading signals with adaptive TP/SL levels - creating best possible trades as a result! Message me and get  Neuro Poseidon Assistant  as a gift to automize your trading process! What makes it stand out? 1. Proven profitability on all assets and timeframes 2. Only confirmed BUY and SELL signals present on the chart 3. Adaptive TP & SL levels generated by the software for each trade 4. Easy to understand - suitable for al
SuperScalp Pro
Van Minh Nguyen
4.63 (32)
SuperScalp Pro - Professional Multi-Layer Confluence Scalping System SuperScalp Pro é um indicador avançado de scalping que aprimora o Supertrend clássico com vários filtros inteligentes de confirmação. Ele ajuda a identificar oportunidades de Buy/Sell com maior probabilidade, reduzindo significativamente os sinais falsos. Setas claras de Buy e Sell aparecem diretamente no gráfico, enquanto os níveis de Stop Loss e Take Profit baseados em ATR são calculados automaticamente em tempo real. Após a
Welcome to ENTRY IN THE ZONE AND SMC MULTI TIMEFRAME Entry In The Zone and SMC Multi Timeframe is a real-time market analysis tool based on Smart Money Concepts (SMC), designed to analyze market structure, price direction, and key trading zones. It supports both Single-Timeframe Analysis and Multi-Timeframe Analysis, providing a clearer view of the overall market structure across multiple timeframes, with real-time BUY / SELL signals that do not repaint. It is designed to help filter trading opp
Zoryk Gold
Reda El Koutbane
5 (7)
O desconto termina em 24 horas — próximo preço $ 69 ZORYK — Sistema avançado de sinais para XAUUSD no MetaTrader 5 Você conhece essa sensação. Você passa muito tempo analisando o ouro. Espera pela entrada certa. Finalmente abre a operação e o preço começa imediatamente a se mover contra você. Você fecha cedo demais, move o Stop Loss ou hesita por alguns segundos. Depois disso, o mercado alcança exatamente o destino que você esperava originalmente, mas sem você dentro da operação. O problema ne
GoldenX Entry MT5
Kareem Abbas
5 (16)
GoldenX Entry é um indicador para MT5 com um algoritmo adaptativo Smart Entry Trend, um sistema de pontuação de sinais, um detector de regime de mercado e um filtro de volatilidade. Cada sinal inclui um nível de entrada calculado, três níveis de Take-Profit (TP1, TP2, TP3) e um nível de Stop-Loss. Ele é construído sobre múltiplas camadas analíticas projetadas para se adaptar a diferentes condições de mercado, combinando um sistema analítico multicamadas com um otimizador integrado e um sistema d
UNIX Scalper — Gold Scalping Indicator for MetaTrader 5 UNIX Scalper is a focused Gold scalping indicator designed primarily for XAUUSD on M1, M2, M3, M5, M10 and M15. It gives the trader a clear BUY, SELL or WAIT decision together with the complete trade plan: Entry, Stop Loss, TP1 and TP2 . The concept is simple: wait for the signal, follow the levels, move the Stop Loss to Break Even after TP1, and trade with discipline. Learn UNIX Scalper Everything you need to learn and use the product is
Reversion King Indicator
Eugen-alexandru Zibileanu
5 (7)
Um novo Rei chegou à cidade - Indicador + Gestão de Ordens (TP1 + TP2 + TP3) + Enviador opcional de sinais para Telegram INCLUÍDO (GRÁTIS) (SISTEMA COMPLETO DE TRADING e SINAIS) Nosso melhor EA para Ouro: Gold Slayer Este indicador inclui uma estratégia avançada, um sistema de trading com gestão de ordens personalizável e um sistema de reversão à média que combina extensões de envelopes, apoiado por múltiplos filtros inteligentes de confirmação, como o RSI, para capturar entradas de reversão de
O UZFX {SSS} Scalping Smart Signals v5.0 MT5 é um indicador de negociação de alto desempenho, sem repintura, concebido para scalpers, day traders e swing traders que exigem sinais precisos e em tempo real em mercados em rápida evolução. Desenvolvido pela (UZFX-LABS), este indicador combina a análise da ação do preço, a confirmação de tendências e a filtragem inteligente para gerar sinais de compra e venda de alta probabilidade, sinais de alerta e oportunidades de continuação de tendências em tod
Atomic Analyst MT5
Issam Kassas
4.45 (55)
Este produto foi atualizado para o mercado de 2026 e otimizado para as versões mais recentes do MT5. AVISO DE ATUALIZAÇÃO DE PREÇO: Atomic Analyst está atualmente disponível por $99 . O preço aumentará para $199 após as próximas 30 compras . OFERTA ESPECIAL: Após comprar o Atomic Analyst, envie-me uma mensagem privada para receber o Smart Universal EA GRÁTIS e transformar seus sinais do Atomic Analyst em operações automatizadas. Atomic Analyst é um indicador de trading de Price Action sem repa
M1 Sniper MT5
Oleg Rodin
5 (7)
O   M1 SNIPER   é um sistema indicador de negociação fácil de usar. É um indicador de seta projetado para o período M1. O indicador pode ser usado como um sistema independente para scalping no período M1 e pode ser usado como parte do seu sistema de negociação existente. Embora este sistema de negociação tenha sido projetado especificamente para negociação no M1, ele também pode ser usado em outros períodos. Originalmente, desenvolvi este método para negociar XAUUSD e BTCUSD. Mas considero-o úti
Gold Entry Sniper
Tahir Mehmood
5 (19)
Gold Entry Sniper – Painel ATR Multi-Tempo Profissional para Scalping e Swing Trading em Ouro Gold Entry Sniper é um indicador avançado para MetaTrader 5 projetado para fornecer sinais de compra/venda precisos para XAUUSD e outros ativos, com base na lógica de Trailing Stop ATR e análise multi-tempo . Ideal tanto para scalpers quanto para swing traders. Principais Recursos e Vantagens Análise Multi-Tempo – Veja a tendência de M1, M5 e M15 em um único painel. Trailing Stop Baseado em ATR – Níveis
Gann Made Easy   é um sistema de negociação Forex profissional e fácil de usar, baseado nos melhores princípios de negociação usando a teoria do sr. W. D. Gann. O indicador fornece sinais precisos de COMPRA e VENDA, incluindo níveis de Stop Loss e Take Profit. Você pode negociar mesmo em movimento usando notificações PUSH. Entre em contato comigo após a compra para receber instruções de negociação e ótimos indicadores extras gratuitamente! Provavelmente você já ouviu muitas vezes sobre os método
ATSTRONG PRO: Indicador de Estrutura de Mercado e Rompimento Motor de Detecção de Rompimento | 5 Alvos TP Dinâmicos | Painel de Controle ao Vivo | Sem Repintura Preço de Lançamento Preço Atual: $59 — O preço aumenta em $10 após cada 10 vendas. ATSTRONG PRO é um indicador avançado de rompimento e estrutura de mercado institucional projetado para MetaTrader 5. Ele detecta pivôs de swing de alta probabilidade, identifica zonas agrupadas de acúmulo de suporte e resistência, e sinaliza Quebra de E
Currency Strength Wizard   é um indicador muito poderoso que fornece uma solução completa para uma negociação bem-sucedida. O indicador calcula o poder deste ou daquele par forex usando os dados de todas as moedas em vários intervalos de tempo. Esses dados são representados em uma forma de índice de moeda fácil de usar e linhas de energia de moeda que você pode usar para ver o poder desta ou daquela moeda. Tudo o que você precisa é anexar o indicador ao gráfico que deseja negociar e o indicador
A lenda está de volta: Entry Points Pro 10. O relançamento do lendário indicador que se manteve por 3 anos no Top-3 do MQL5 Market. Centenas de avaliações entusiasmadas (589 nas duas versões), milhares de traders operam com ele todos os dias, 31.000+ downloads da versão demo   MT4+MT5 . Li cada avaliação de vocês ao longo de cinco anos — e, em vez de promessas, coloquei as respostas dentro da versão 10. Do autor que está no mercado desde 1999 e valoriza a honestidade, a própria reputação e os se
Axiom Matrix
Issam Kassas
5 (6)
[User Manual]   ,   [Online Course]   ,   [PDF]  And [DEMO] Axiom Matrix é um scanner de mercado profissional multissímbolo e multitimeframe, além de um painel de decisão para MetaTrader 5. Ele escaneia o seu Market Watch, analisa múltiplos timeframes, lê múltiplos motores de evidência, compara as oportunidades mais fortes e mostra a melhor condição BUY, SELL, WAIT ou bloqueada dentro de um único painel de matriz limpo. Eu criei o Axiom Matrix porque queria uma ferramenta que pudesse fazer o tra
Este produto foi atualizado para o mercado de 2026 e otimizado para as versões mais recentes do MT5. AVISO DE ATUALIZAÇÃO DE PREÇO: Smart Price Action Concepts está atualmente disponível por $200 . O preço aumentará para $299 após as próximas 30 compras . OFERTA ESPECIAL: Após comprar, envie-me uma mensagem privada para receber Bônus grátis + Presente . Antes de tudo, vale destacar que esta ferramenta de trading é um indicador sem repaint, sem redesenho e sem atraso, o que a torna ideal para tr
Gem SIGNAL
Shengzu Zhong
5 (1)
GEM Signal Pro GEM Signal Pro é um indicador seguidor de tendência para MetaTrader 5, desenvolvido para traders que desejam sinais mais claros, setups mais estruturados e uma gestão de risco mais prática diretamente no gráfico. Em vez de mostrar apenas uma seta simples, o GEM Signal Pro ajuda a apresentar a ideia completa da operação de forma mais clara e fácil de entender. Quando as condições são confirmadas, o indicador pode mostrar o preço de entrada, o stop loss e os alvos de take profit no
FiboSniper Pro
Van Minh Nguyen
5 (2)
FiboSniper Pro – Multi-Filter Fibonacci System with Auto SL/TP and Control Panel FiboSniper Pro é um indicador técnico que combina Fibonacci Envelopes dinâmicos com vários filtros de confirmação para gerar sinais seletivos de Buy e Sell. Os níveis de Fibonacci são calculados com base em Moving Average e ATR e, em seguida, filtrados por ADX, EMA, RSI, ATR, Volume, Time e estrutura das velas. O indicador exibe diretamente no gráfico os níveis automáticos de Stop Loss e Take Profit baseados em ATR,
Power Candles MT5
Daniel Stein
4.73 (11)
Power Candles V3 - Indicador de força com auto-otimização O Power Candles V3 transforma a força da moeda e do instrumento num plano de negociação prático em todos os gráficos aos quais está associado. Em vez de se limitar a colorir as velas, executa uma otimização automática em tempo real em segundo plano e apresenta-lhe os melhores valores de Stop Loss, Take Profit e limiar de sinal para o símbolo em questão. Basta um clique para o adotar na negociação em tempo real — as linhas de entrada, Stop
Divergence Bomber
Ihor Otkydach
4.89 (94)
Cada comprador deste indicador recebe adicionalmente, e de forma gratuita: A ferramenta exclusiva "Bomber Utility", que acompanha automaticamente cada operação, define os níveis de Stop Loss e Take Profit e fecha operações de acordo com as regras da estratégia; Arquivos de configuração (set files) para ajustar o indicador em diferentes ativos; Set files para configurar o Bomber Utility nos modos: "Risco Mínimo", "Risco Balanceado" e "Estratégia de Espera"; Um vídeo tutorial passo a passo que a
Acesso oficial ao ecossistema BlueDigitsFx Receba atualizações de infraestrutura, recursos de fluxo de trabalho, lançamentos de produtos e acesso ao ecossistema através do ecossistema oficial da BlueDigitsFx. Ecossistema Telegram Website BlueDigitsFx Precision Order Flow MT5 — Suite completa de análise de fluxo de ordens para MetaTrader 5 Framework profissional de estrutura de mercado baseado em sessões que combina Áreas de Valor, Point of Control, contexto de leilão e suporte estruturado à to
CRT Candle Range Theory HTF MT5.   Ultimate CRT Indicator: Advanced ICT Concepts and Malaysian SnR Trading System Master the Market Maker's Footprints with the Most Advanced Candle Range Theory Indicator Unlock the true power of  Smart Money Concepts (SMC)  and trade precisely like the institutions with the  Ultimate CRT Indicator . Built exclusively for serious traders, this indicator automates the highly effective  Candle Range Theory (CRT) , a core pillar of  ICT Concepts (Inner Circle Trader
Smc Pro ToolKit
Talal N Z Aljarusha
5 (12)
SMC PRO TOOLKIT — SMART MONEY ANALYSIS & STRUCTURED TRADE PLANNING SMC Pro ToolKit is a professional Smart Money Concepts analysis workspace for MetaTrader 5. It combines market structure, multi-timeframe analysis, institutional price zones, setup evaluation, confirmation tools, volume context, alerts, and risk planning inside one organized chart environment. One workspace. Multiple layers of confirmation. One structured trading plan. OPEN COMPLETE USER GUIDE MULTI-CONDITION SETUP ENGINE At
Crystal Quantum Pro
Muhammad Jawad Shabir
5 (3)
CRYSTAL QUANTUM PRO Institutional Signal & Trade Intelligence for MetaTrader 5 Final Price: 199 USD ----> Price goes up 10 USD after every 10 sales. Limited launch slots available, act fast. Most indicators give you an arrow and leave you alone. A naked arrow is a gamble. Winning consistently requires CONFLUENCE , a clear STOP and TARGET , and honest PROOF that the system works. Crystal Quantum Pro delivers all three in one clean, no-repaint package. Crystal Quantum Pro is a complete decision sy
Scalper Vault   é um sistema profissional de escalpelamento que fornece tudo o que você precisa para um escalpelamento bem-sucedido. Este indicador é um sistema de negociação completo que pode ser usado por comerciantes de forex e opções binárias. O período de tempo recomendado é M5. O sistema fornece sinais de seta precisos na direção da tendência. Ele também fornece sinais superiores e inferiores e níveis de mercado Gann. Os indicadores fornecem todos os tipos de alertas, incluindo notificaçõe
FX Power MT5 NG
Daniel Stein
5 (33)
FX Power: Analise a Força das Moedas para Decisões de Negociação Mais Inteligentes Visão Geral FX Power é a sua ferramenta essencial para compreender a força real das principais moedas e do ouro em quaisquer condições de mercado. Identificando moedas fortes para comprar e fracas para vender, FX Power simplifica as decisões de negociação e revela oportunidades de alta probabilidade. Quer você prefira seguir tendências ou antecipar reversões usando valores extremos de Delta, esta ferramenta adap
Mais do autor
Read-only analytics for accounts running several EAs. Groups your closed trades by magic number and measures how much of their combined risk actually cancels out. Free measurement edition. The monitoring and alerting edition is Portfolio Command Desk:  https://www.mql5.com/en/market/product/188884 The problem You run five Expert Advisors. Each backtest looked fine on its own. But the account does not trade five systems, it trades one portfolio, and no report in MetaTrader tells you how those sys
FREE
Hard limits for prop firm and challenge accounts Prop firm rules are not suggestions. Breach the daily loss limit by one dollar and the account is gone, whatever the equity curve looked like an hour earlier. The problem is that the rule lives on the firm's server while your positions live in your terminal, and nothing in MetaTrader 5 connects the two. Prop Firm Circuit Breaker sits on one chart and watches the whole account. The name is literal: an exchange halts trading when a threshold is bre
FREE
Comece pela perda, não pelo lucro. Decida primeiro que profundidade de drawdown está disposto a suportar — 5-10%, 20-30% ou mais — e só depois deixe o sistema procurar retorno dentro desse limite. É por esta ordem que o Veteran Army FX trabalha. E como ninguém sabe que par vai produzir o próximo movimento a sério, vigia onze deles ao mesmo tempo no período H4, em ambas as direções, em vez de apostar a conta num único gráfico. Num relance Mercados: 13 pares de divisas, compra e venda, no período
Volume Trio Multi is a three-layer market-structure tool for MetaTrader 5: session Volume Profile (POC, VAH/VAL, Value Area), a CVD volume-pressure histogram with a strict Regular divergence engine, and anchored VWAP with standard-deviation bands — extended with a watchlist scanner that runs all three across the symbols in your Market Watch. This is the Pro edition of my free indicator, Volume Trio. The base engine is identical, so this page describes only what Pro adds. For the three layers the
Start with the loss, not the profit. First decide how deep a drawdown you are willing to sit through — and then let the system go after returns inside that limit. That is the order Veteran Army Gold works in. And because gold does not move the way currencies move, it works the market one price level at a time, buying and selling, instead of betting the account on a single idea. The same discipline behind Veteran Army FX, applied to a single market that behaves like nothing else. At a glance Mark
Envelope monitoring for multi-EA accounts. Each magic number is watched against its own backtest; you get a traffic light on the chart and an alert only when a state changes. Includes the full free measurement layer. What it is You run several Expert Advisors on one account. This utility reads their closed history, groups it by magic number, and watches every system against its own backtest: a traffic light on the chart, and an alert only when a state actually changes. Underneath sits a full mea
Start with the loss, not the profit. First decide how deep a drawdown you are willing to sit through — 5-10%, 20-30%, or more — and then let the system go after returns inside that limit. That is the order Veteran Army Nasdaq works in. And because no one knows when the index will make its next real move — or in which direction — it stands ready on both sides of one market, with many independent systems instead of one confident bet. At a glance Market: US Tech 100 index, long and short, on the H1
Filtro:
Sem comentários
Responder ao comentário