Portfolio Correlation Desk
- Utilities
- Version: 1.0

Read-only analytics for accounts running several EAs. Groups your closed trades by magic number and measures how much of their combined risk actually cancels out.
Free measurement edition. The monitoring and alerting edition is Portfolio Command Desk: https://www.mql5.com/en/market/product/188884The problem
You run five Expert Advisors. Each backtest looked fine on its own. But the account does not trade five systems, it trades one portfolio, and no report in MetaTrader tells you how those systems behave together.
So the questions that decide your position size stay unanswered. Do these systems lose money in the same periods? What is the worst drawdown the account as a whole has already survived? And was that drawdown lucky or typical?
What this does
It reads your closed trade history, groups it by magic number, and answers those three questions from your own trades, on the period you choose - daily, weekly or monthly.
Drawdown compression. Add up the maximum drawdown of every system on its own. Then measure the maximum drawdown of the whole account. The second number is always smaller. The ratio between them is what diversification actually bought you, in your own currency.
Correlation. The full pairwise matrix on daily, weekly or monthly profit and loss, drawn on the chart as a heat map. Pale means two systems ignore each other. Red means they win and lose together. Blue means they are opposites. A portfolio that looks mostly pale is genuinely diversified. One that looks red is a single strategy you are paying for several times.
Monte Carlo. History gave you one ordering of periods. The market was free to deliver the same periods in a different order, and the maximum drawdown changes when it does. The panel reshuffles your period results a few thousand times and reports the drawdown at the 50th, 90th and 95th percentile, plus where your actual history sits inside that cloud. Most accounts land in the friendly half.
What makes it different
Measured statistics, not opinion. There is no AI commentary, no API key, no URL to whitelist, no network access at all. Every figure on the panel is computed from deals already in your terminal.
Two details most tools get wrong are handled here. Entry commission is counted, not just exit commission, so cost is not understated. And trades are grouped by position, so a partial close is one round turn rather than several.
What you get out of it
A position-size decision you can defend. If the compression ratio is 3x, your combined risk is a third of the sum of the parts and you can size accordingly. If it is close to 1x, you are carrying concentrated risk that the individual backtests never showed you.
And an early warning. When a new EA joins the roster and the matrix turns red, you have learned something before the account does.
The panels
ROSTER — one row per magic number, sorted by net result: trades, win rate, profit factor, payoff, expectancy in R, longest winning and losing streaks, maximum drawdown in money and in R, and net.
PORTFOLIO — three lines. Compression: the standalone sum, the combined drawdown and the ratio. Monte Carlo: the three percentiles and where your path sits. Correlation: average absolute rho over daily, weekly or monthly returns (rho = +1 ==> strategies take the same trades, rho = -1 ==> strategies take exactly opposite trades), the share of pairs below 0.30, and the most correlated pair.
CORRELATION — the heat map, with a legend, the period used (daily, weekly or monthly) and how many periods it covers.
The panels refresh on a timer and only redraw when a new trade closes, so they stay current without loading the terminal.
Inputs
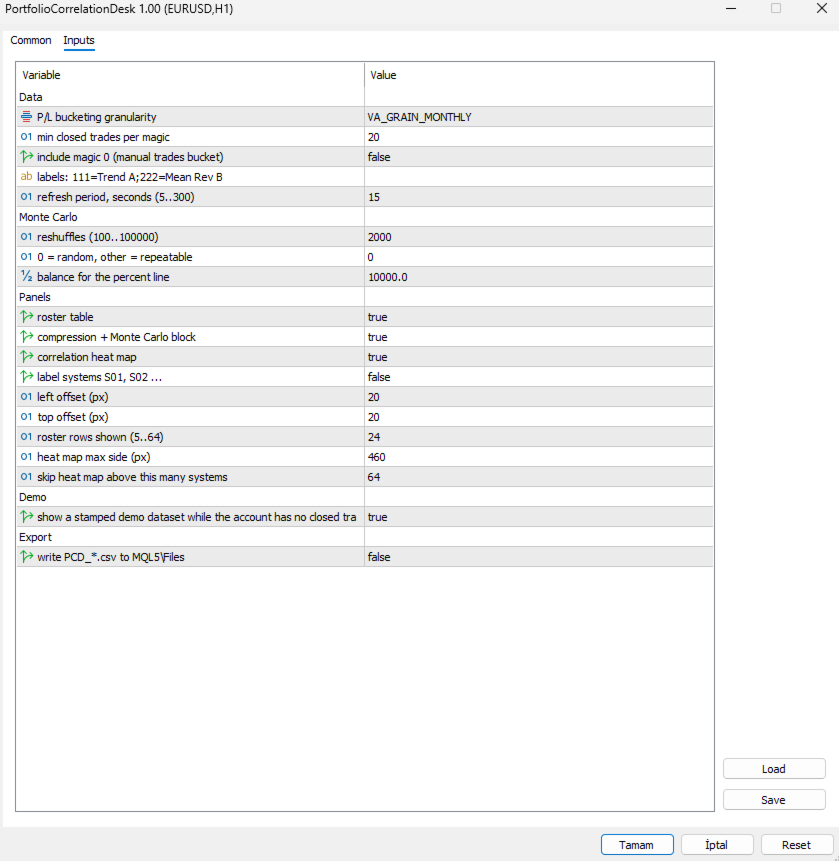
Data
- Grain — correlate on daily, weekly or monthly profit and loss. Monthly is the default and the safest; correlations on sparse daily buckets are pulled toward zero by the empty cells. Weekly suits accounts that trade often.
- Min trades — magic numbers with fewer closed trades are left out of the report and out of the combined portfolio, so the comparison stays like for like.
- Include magic 0 — off by default. On most terminals that bucket holds manual trades and any EA left on its default magic.
- Name map — label your systems: 111=Trend A;222=Mean Rev B .
- Refresh seconds — how often the panel checks for new closed trades.
Monte Carlo
- Runs — number of reshuffles. 2000 is plenty.
- Seed — 0 draws a random seed. Any other value makes the percentiles repeatable, which matters when the figure goes into a report.
- Reference balance — used only to express the 95th percentile drawdown as a percentage.
Panels
- Show roster / summary / heat map — turn each block on or off.
- Mask magics — label systems S01, S02 and so on instead of printing real magic numbers. Useful for screenshots.
- Panel X / Y — offset from the top left corner.
- Table max rows — how many roster rows to show.
- Heat map max px / max systems — grid size, and the point above which the heat map is skipped because the grid would need more rectangles than the chart can redraw comfortably.
Demo
- Demo when empty — while the account has no closed trades, the panels show a deterministic demo dataset, stamped [DEMO DATA] in every title, so you can see the layout before you have history. The first real closed trade replaces it permanently.
Export
- Export CSV — write the roster and the correlation matrix to MQL5\Files. Disabled automatically while the demo dataset is on display.
What it does not do
It never places, modifies or closes an order. It does not produce signals or predict anything. It does not connect to any network or external service.
Drawdowns are measured on closed trades, so they do not include the floating excursion of open positions, which is deeper. Read them as realised drawdown.
It does not watch or alert. It reports what is in your history when you look at it. Monitoring, thresholds and notifications live in Portfolio Command Desk: https://www.mql5.com/en/market/product/188884
MetaTrader 5. Attach to any chart; the symbol does not affect the result.