FX Analysis

  • Indicadores
  • Lee Teik Hong
    Lee Teik Hong
    THE FOREX CUES
    AN EFFECTIVE PLAN WITH A HIGH-QUALITY STRATEGY
    A lucrative trade is frequently generated by the "Repeat and Repeat" pattern. Many expert traders that I believe, would agree with this assertion.
  • Versão: 1.50
  • Atualizado: 16 outubro 2026
  • Ativações: 5

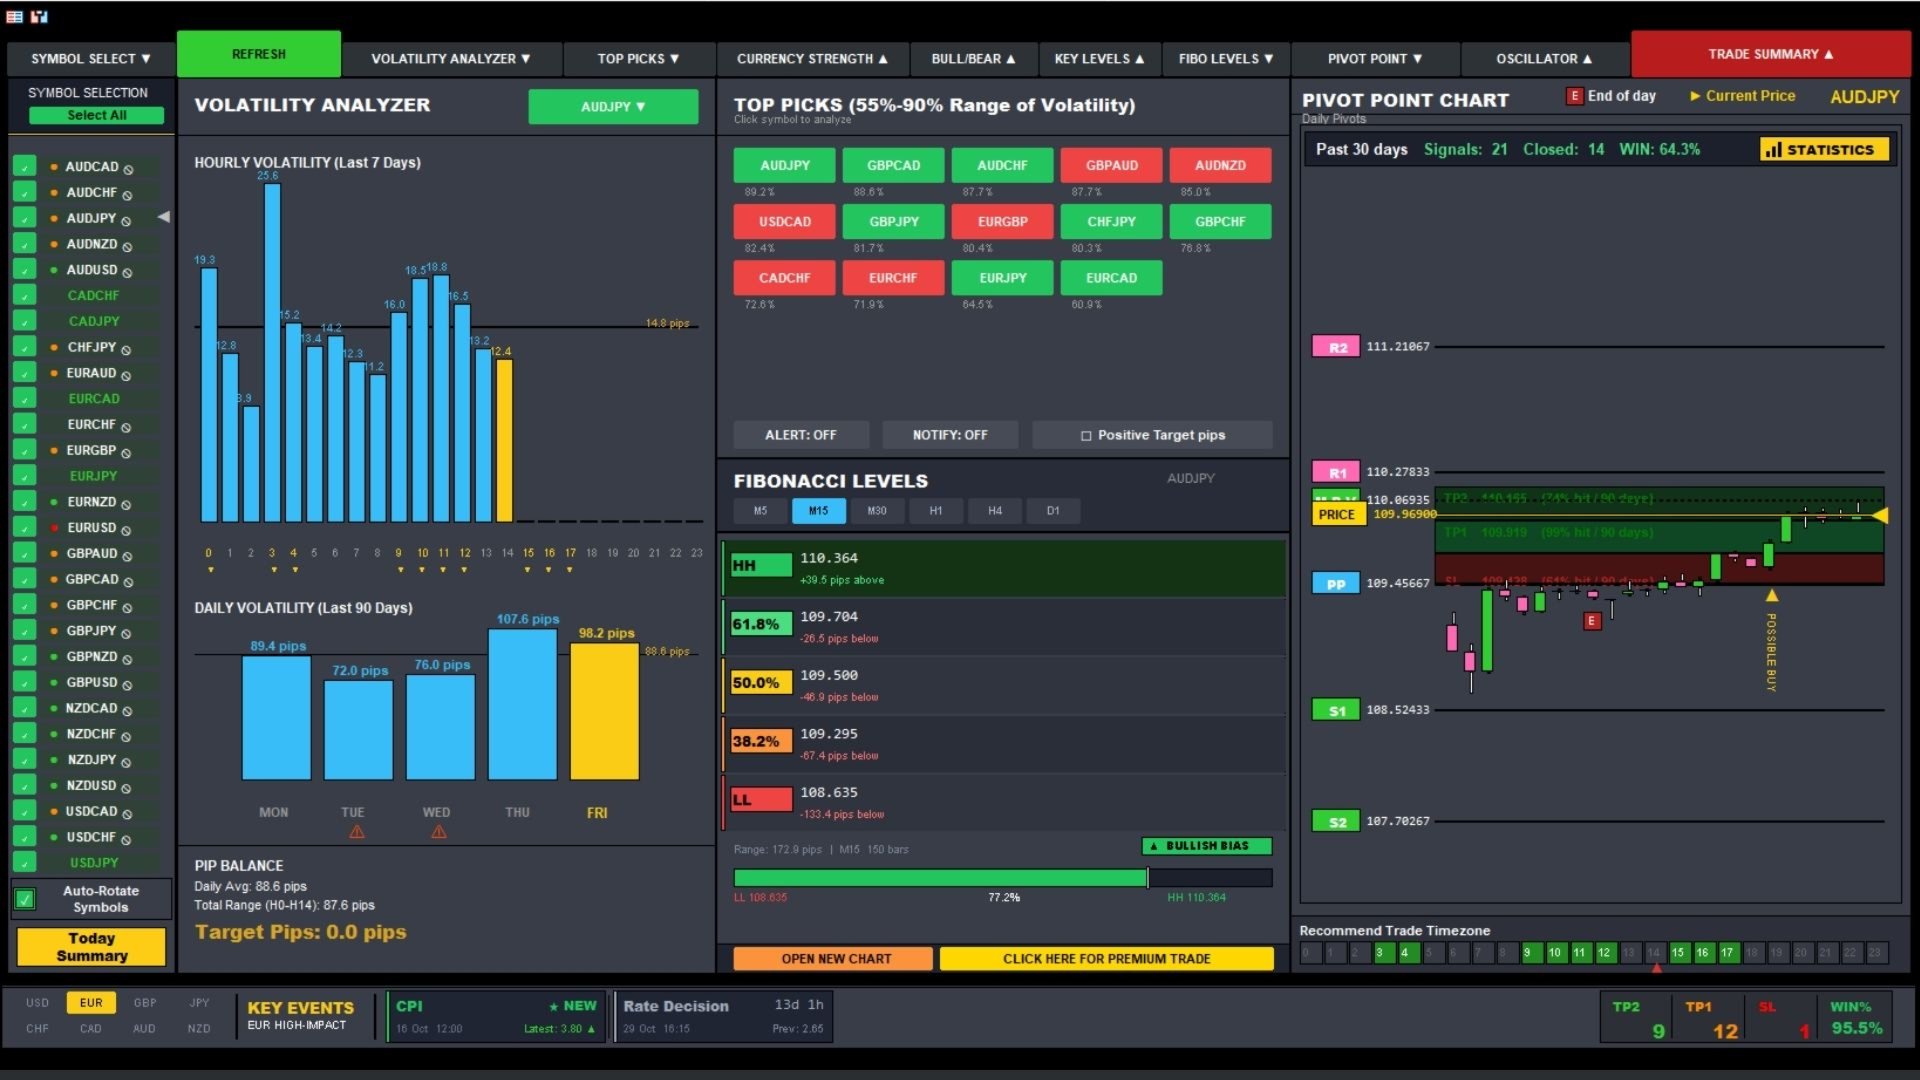
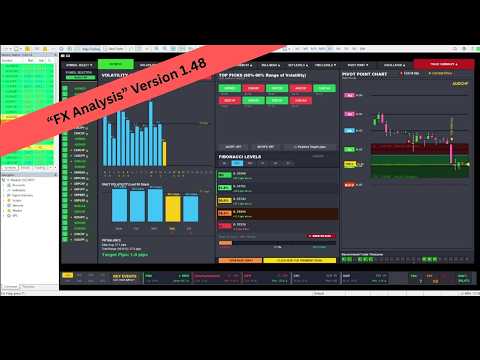
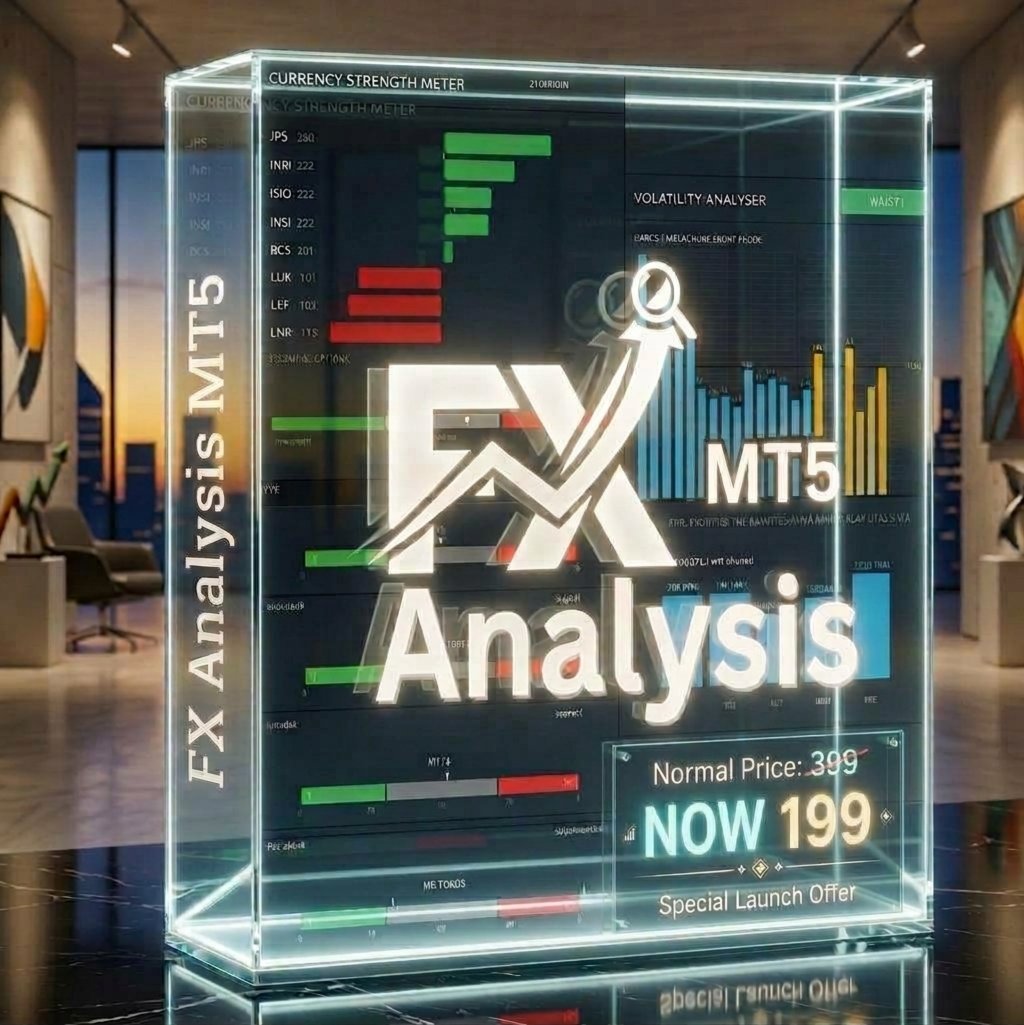
FX Analysis is an all-in-one MT5 indicator dashboard that combines eight analytical tools in a single panel, helping traders identify high-probability setups without switching between charts or indicators.

Designed for standard forex pairs on MetaTrader 5. Best results on M15 - H4 timeframes when all components are used together as part of the included workflow.

Special discount price: NEXT 20 COPIES ONLY!

Get instant access now for just $199 — once the next 20 copies are sold, the price will increase to $259 . The final planned price is $____


***Buy FX Analysis and you could get Equity Protector(EA) for free !***

Ask in private for more details!


Components

Volatility Analyzer

Displays historical average movement by hour and by day of the week. A real-time Pip Balance shows the remaining expected range for the current session. For example, if the daily average is 100 pips and price has moved 60 pips, the balance displays +40 pips — useful for setting realistic Take Profit targets.

Currency Strength Meter

Calculates relative strength across 28 major forex pairs and ranks all 8 base currencies from strongest to weakest. Green bars indicate strong currencies; red bars indicate weak ones. Use this to pair the strongest currency against the weakest for higher-confluence trade entries.

Oscillator Panel

Monitors RSI, Stochastic, Williams %R, Bollinger Bands, and Keltner Channels simultaneously. Each indicator casts a vote — Oversold, Neutral, or Overbought. A consensus of four or five indicators in agreement provides a stronger directional signal.

Top Picks Panel

Automatically scans all monitored symbols and surfaces pairs currently within 60–90% of their daily average range — the zone where price still has meaningful movement potential. Green buttons indicate a bullish bias; red buttons indicate bearish. Clicking any symbol loads its full analysis instantly.

Open New Chart

Available for any Top Picks symbol. Opens a dedicated chart window and plots a target line based on the remaining daily pip balance, giving a clear visual reference for potential price extension.

Pivot Points

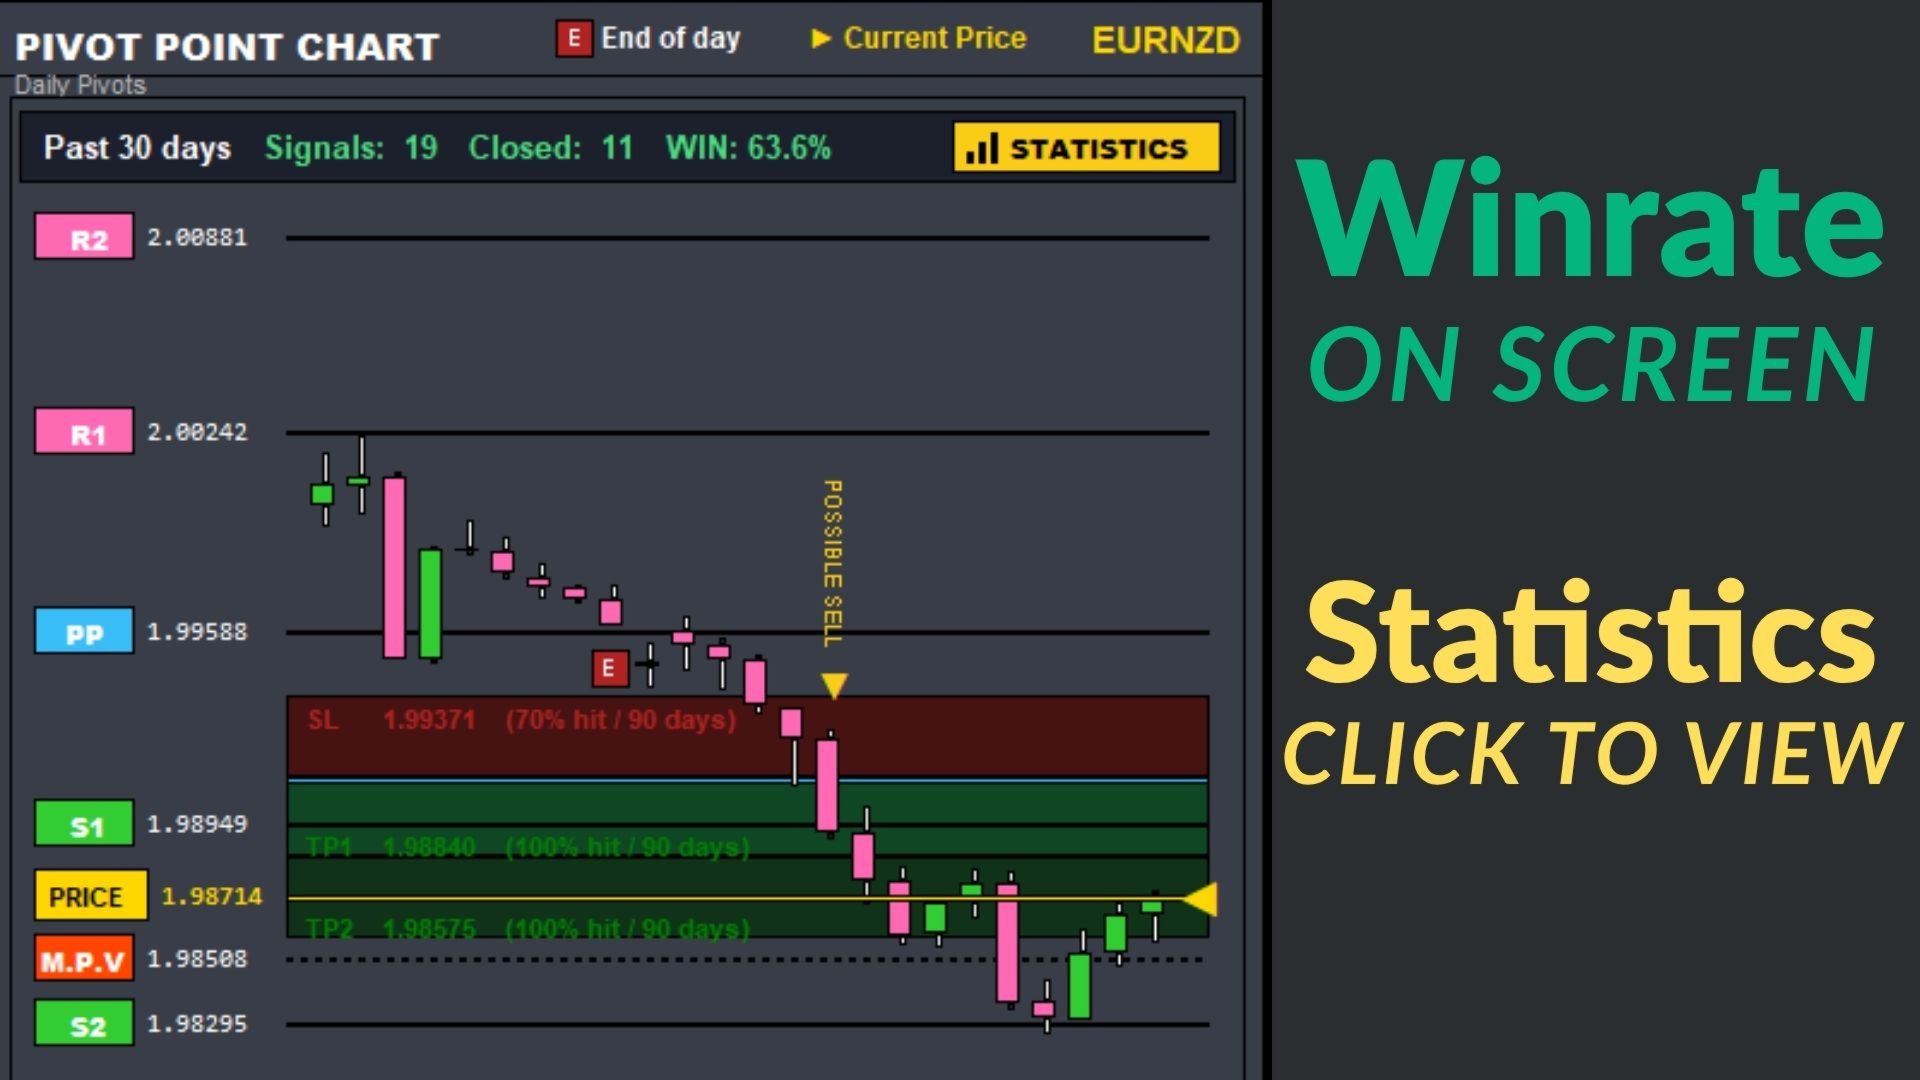
Plots five classic pivot levels on a mini-chart. When price reaches 50% of its daily average range, a dotted MPV (Max-Point Volatility) line appears as an alert reference for potential reversals or continuations.

Bullish and Bearish Strength

Displays a real-time directional strength reading for the currently selected symbol, giving a quick snapshot of momentum bias at a glance.

Key Levels and Trade Summary

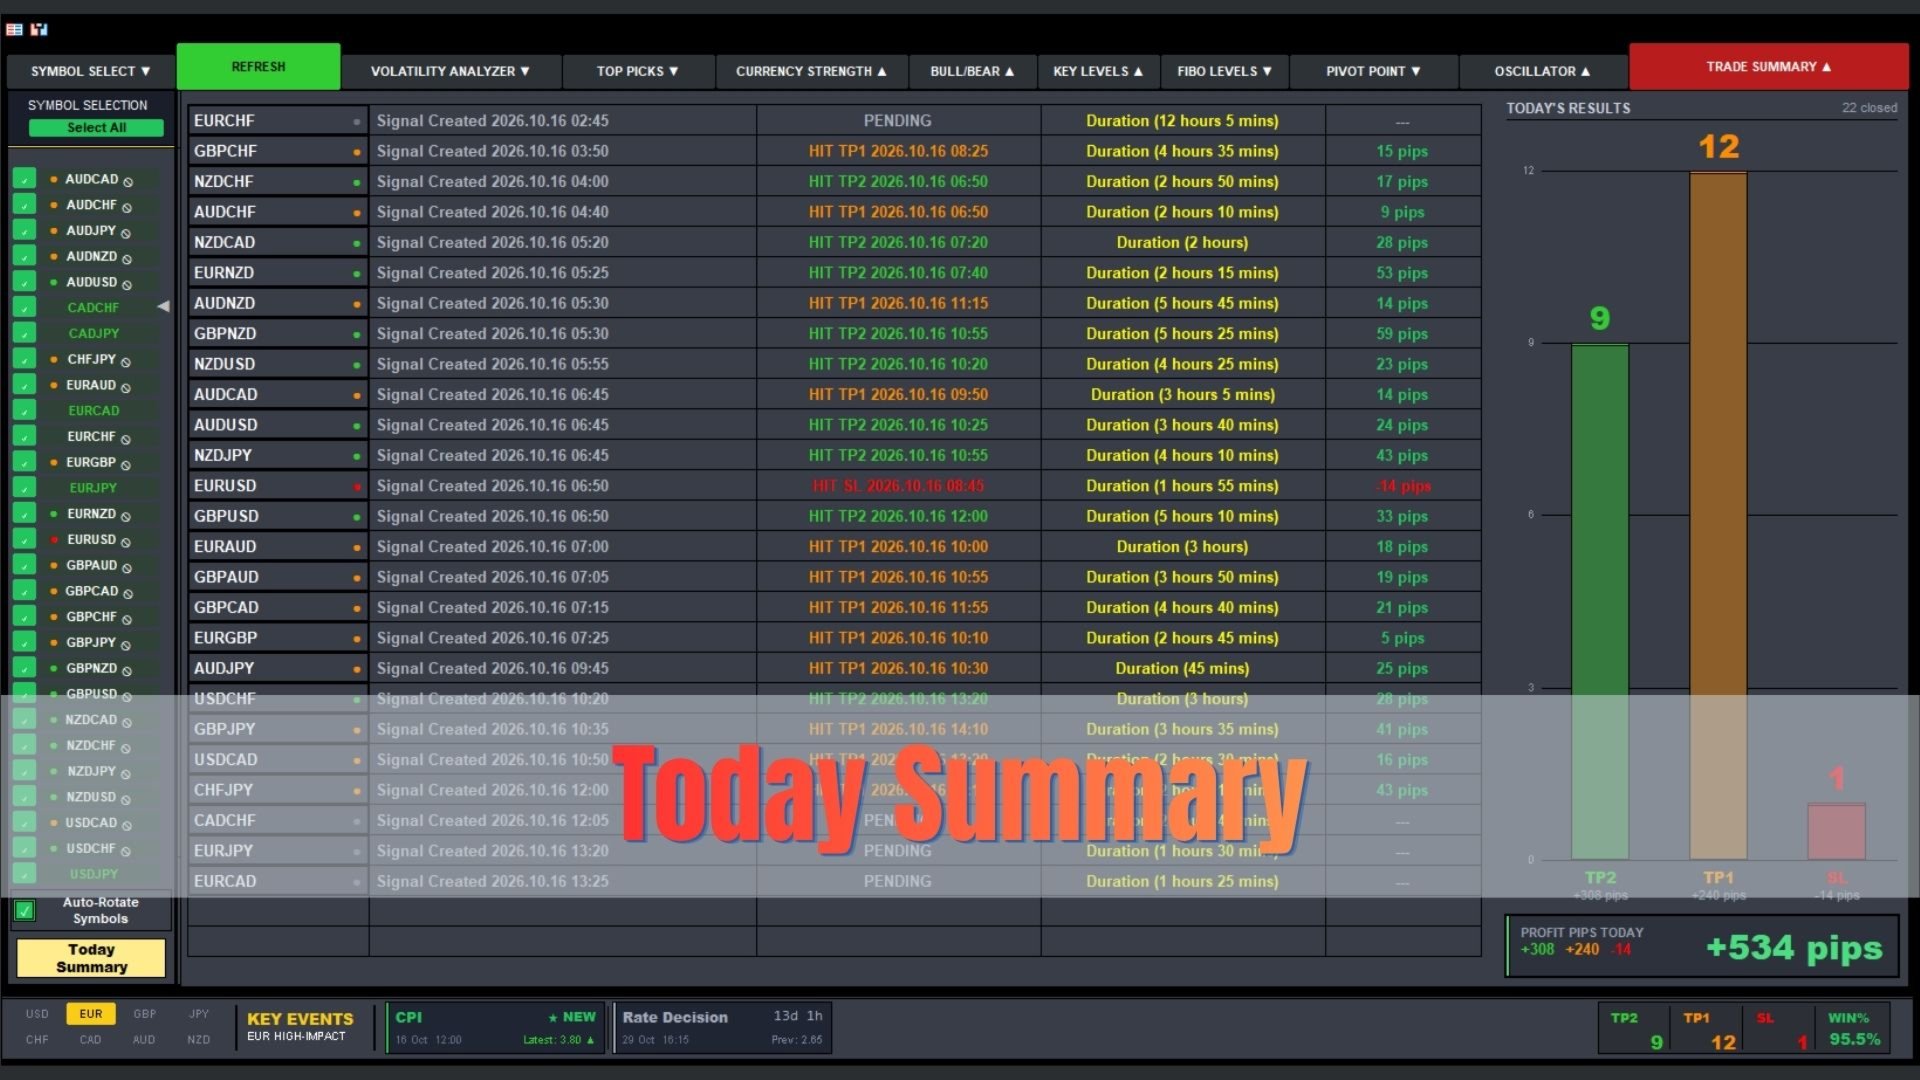
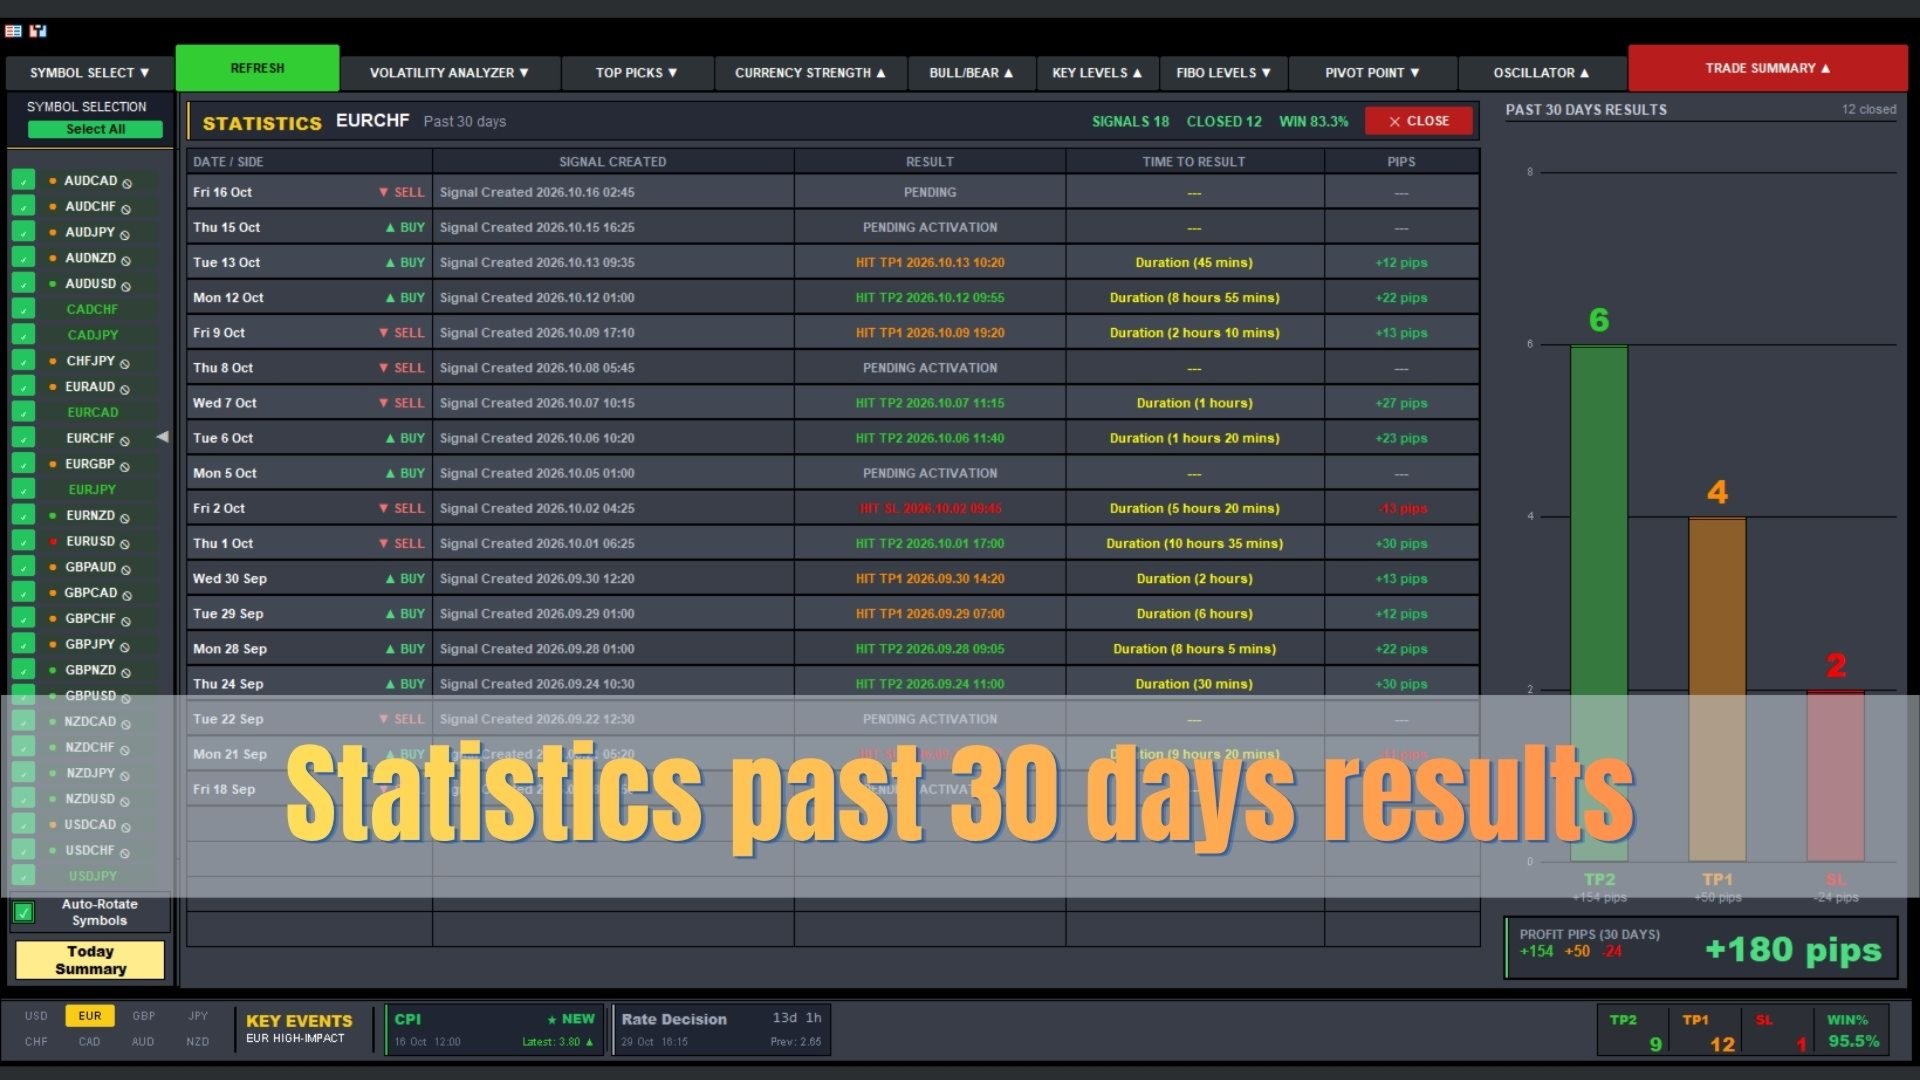
Automatically draws Entry, Stop Loss, and Take Profit levels directly on the chart based on current analysis. All lines are auto-generated and update dynamically as market conditions change.


Suggested workflow

1 Open the Top Picks panel and identify symbols in the 60–90% volatility range.

2 Select a symbol and review the Volatility Analyzer — confirm the pip balance is positive and the current hour is historically active.

3 Check the Currency Strength Meter — a wide gap between the two constituent currencies improves trade quality.

4 Review the Oscillator Panel — act when four or more indicators agree on a bullish or bearish condition.

5 Click Open New Chart to view the target level and place your trade.


This indicator is designed for use on MetaTrader 5 with standard forex pairs.

Past price data does not guarantee future movement. Always apply independent risk management before entering any trade.
Produtos recomendados
O indicador cria cotações atuais, que podem ser comparadas com as históricas e, com base nisso, fazer uma previsão do movimento dos preços. O indicador possui um campo de texto para navegação rápida até a data desejada. Opções: Símbolo - seleção do símbolo que o indicador exibirá; SymbolPeriod - seleção do período do qual o indicador coletará dados; IndicatorColor - cor do indicador; HorisontalShift - deslocamento das cotações desenhadas pelo indicador pelo número especificado de barras; I
N/B: All our product purchase comes with our free ‘’DAILY   SCALPER EA’’ Whatsapp Developer for yours after successful purchase   THE ARCHITECTURE OF A PERFECT TRADING SYSTEM Let me break down how all the components in this Ultimate Semafor system work together like a Swiss watch mechanism. This is a multi-layered confirmation system where each piece validates the others.   SYSTEM PHILOSOPHY: "TRIPLE CONFIRMATION" This system follows a simple but powerful principle: No single indicator can
EUR/USD Trade Plan Assistant Manual EUR/USD entry and risk-planning indicator for MetaTrader 5. It displays confirmed trade plans with entry, stop, target, position volume, time limit and combined account risk in a clear chart interface. Product description EUR/USD Trade Plan Assistant is designed for traders who want structured EUR/USD trade plans without automatic order execution. The indicator continuously evaluates EUR/USD and can display up to three independent trade plans based on differen
Visão Geral Candle Timer Countdown Pro exibe uma contagem regressiva suave e precisa até o fechamento da vela atual, com um arco circular de progresso em tempo real. Usa interpolação do tempo do servidor para evitar travamentos. Perfeito para scalping ou swing trading. Recursos Contagem regressiva precisa Arco circular (Ring ou Filled Pie) 6 posições disponíveis 3 esquemas de cores Destaque final configurável Detecção de conexão Alertas de nova vela Baixo uso de CPU Instalação Baixe no MQL5 Mark
Manual Volume Profile MS shows where volume was actually traded. It draws today's session profile live and lets you place up to 10 independent volume profile ranges anywhere on the chart with two mouse clicks. Every profile shows the POC, VAH, VAL and the Value Area. KEY FEATURES Daily profile – today's volume profile, drawn to the right of the current bar or over the day's bars, updated live. Manual ranges PV 1 – PV 10 – click a PV button, click the start and the end of the range, and the profi
ICT Timings & Macros + Liquidity Map draws the full ICT session toolkit on your chart in one indicator, so you're not stacking five separate tools to see your timing framework. Everything is anchored to the 18:00 EST daily reset and fully configurable — colors, styles, widths, fonts, label positions, and history depth — down to the individual line. Session Dividers (12h / 6h / 3h) 18:00 EST-anchored vertical dividers at the 12-hour, 6-hour, and 3-hour level, each independently enabled. Every div
place a vwap line starting from the line placed on the chart parameters: tick_mode: enable to use ticks instead of bars. this uses a lot more cpu processing power prefix: prefix to add for line created by indicator line_color: set the color of the line created line_style: set the line style of the line created applied_price: set the price of bar to use of the bar std_dev_ratio: set the multiplier for the std dev channel
VR Grid Mt5
Vladimir Pastushak
3 (9)
O indicador VR Grid foi projetado para criar uma grade gráfica com configurações definidas pelo usuário. Ao contrário da grade padrão , a VR Grid é usada para construir níveis circulares . Dependendo da escolha do usuário, o passo entre os níveis de rodada pode ser arbitrário. Além disso, ao contrário de outros indicadores e utilitários, o VR Grid mantém a posição da rede mesmo quando o período de tempo muda ou o terminal é reiniciado. Configurações, arquivos de configuração, versões demo, instr
FREE
Was: $249  Now: $99   Market Profile defines a number of day types that can help the trader to determine market behaviour. A key feature is the Value Area, representing the range of price action where 70% of trading took place. Understanding the Value Area can give traders valuable insight into market direction and establish the higher odds trade. It is an excellent addition to any system you may be using. Inspired by Jim Dalton’s book “Mind Over Markets”, this indicator is designed to suit the
Liquidity Structure &  Flow  Mt4 Here indicator visualizes institutional market depth, volume concentration, and whale order flow directly on your MT5  cumulative volume engine . Core Components & Meanings Visual Element Meaning Orange Horizontal Line ( POC ) Point of Control : The exact price level where the highest volume was traded. Acts as a price magnet and institutional support/resistance. Background Heatmap Glow (Teal / Red) Liquidity Nodes : Bright areas indicate heavy liquidity/acceptan
Pattern Recognition EA
Claudiu-georgian Zavera
Pattern Recognition EA - From Learn to Earn. The market repeats itself. This EA finds every past repeat of the current candle sequence - and lets history vote the direction. ONE SHAPE. EVERY REPEAT IN HISTORY VOTES. The last N candles on your signal timeframe form a shape. The EA scans the history you choose - a fixed number of bars or everything your broker provides - for the SAME shape, and checks what happened next, every single time. Only when enough repeats exist AND a clear majority of t
This Volume Delta Profile is an advanced MetaTrader 5 indicator that visualizes   volume delta (order flow imbalance)   using a volume profile-style histogram. It shows the difference between buying and selling pressure at specific price levels, helping traders identify supply and demand zones. This indicator provides a unique perspective on market dynamics by visualizing the imbalance between buying and selling pressure, offering insights beyond traditional volume analysis. Core Concept Positiv
PatternScope — Multi-Pattern Recognition for MT5 PatternScope is a multi-pattern recognition indicator for MetaTrader 5. It scans price action for classic chart patterns, confirms breakouts, and draws clear   Entry, Stop Loss and Take Profit   levels. A compact dashboard shows the latest pattern, bias and Risk:Reward. Patterns:   Double Top/Bottom, Triple Top/Bottom, Head and Shoulders (and inverted), Bullish & Bearish Flag, Pennant, Rising & Falling Wedge, Triangle, Rectangle, Cup and Handle —
Market Profile Heat indicator  — is a classic Market Profile implementation that can show the price density over time, outlining the most important price levels, value area, and control value of a given trading session. This indicator can be attached to timeframes between M1 and D1 and will show the Market Profile for daily, weekly, monthly, or even intraday sessions. Lower timeframes offer higher precision. Higher timeframes are recommended for better visibility. It is also possible to use a fr
Fair Value Gap PRO is the institutional-grade upgrade to the free Lite version. Built for Smart Money Concepts and ICT traders who need precision, depth, and full chart control across every timeframe simultaneously. Fair Value Gaps are the footprints of institutional order flow — zones where price moved so aggressively that an imbalance was left behind. Price is consistently drawn back to these areas, making them elite entry, exit, and target zones for disciplined traders. Timeframe Coverage: Fu
Nome: Volume Profile with Low Volume Nodes Descrição curta: Volume Profile com níveis POC, Value Area, HVN e LVN. Tamanho de linha automático para qualquer símbolo. Buffers para EAs. Descrição completa: O Volume Profile com LVN mostra onde o volume de negociação se acumulou em cada preço, identificando automaticamente os Nodes de Baixo Volume (LVN) e Nodes de Alto Volume (HVN). O que você obtém: - Histograma de perfil de volume para cada dia, semana, mês, sessão personalizada ou número fixo
FREE
Introducing "X Marks the Spot" – Your Ultimate MetaTrader 5 Indicator for Perfect Trades! Are you tired of the guesswork in trading? Ready to take your MetaTrader 5 experience to a whole new level? Look no further – "X Marks the Spot" is here to revolutionize your trading strategy! What is "X Marks the Spot"? "X Marks the Spot" is not just another indicator – it's your personal trading compass that works seamlessly on all timeframes . Whether you're a beginner or an experienced trader,
ProbabilityAI
Marius Ovidiu Sunzuiana
ProbabilityAI is built for traders who want clarity in the middle of market noise. Instead of guessing whether a move still has fuel behind it, this indicator gives you a clean, data‑driven read on how likely price is to keep going. It watches how trends behave, how volatility shifts, and how momentum builds or fades — then turns all of that into a simple probability you can actually use. At its core, ProbabilityAI blends machine‑learning logic with real‑time market behavior. It adapts as condit
BoxChart MT5
Evgeny Shevtsov
5 (7)
The market is unfair if only because 10% of participants manage 90% of funds. An ordinary trader has slim changes to stand against these "vultures". This problem can be solved. You just need to be among these 10%, learn to predict their intentions and move with them. Volume is the only preemptive factor that faultlessly works on any timeframe and symbol. First, the volume appears and is accumulated, and only then the price moves. The price moves from one volume to another. Areas of volume accumu
Perfil de volume de intervalo fixo automático com alertas para MT5 Este indicador mostra onde o preço passou mais tempo, destacando níveis importantes que podem ser usados na negociação. e pode mostrar a densidade de preços ao longo do tempo, delineando os níveis de preços mais importantes, a área de valor e o valor de controle de uma determinada sessão de negociação. Este indicador pode ser anexado a timeframes entre M1 e D1 e mostrará o perfil de mercado para sessões diárias, semanais, mens
Portuguese Este indicador funciona como um assistente avançado de análise de gráficos para traders que adoram operar com Padrões Gráficos. Ele foi projetado para reduzir a carga de análise visual e aumentar a precisão na obtenção de lucros. Principais características deste indicador do ponto de vista do uso prático: 1. Detecção Automática de Padrões (Automated Pattern Detection) Economiza tempo e reduz viés: Você não precisa desenhar linhas de tendência manualmente. O indicador buscará oscilaçõe
A Master Edition é uma ferramenta analítica de nível profissional projetada para visualizar a estrutura do mercado através da lente do volume e do fluxo de dinheiro. Ao contrário dos indicadores de volume padrão, esta ferramenta exibe um Perfil de Volume Diário diretamente no seu gráfico, permitindo ver exatamente onde a descoberta de preços ocorreu e onde o "dinheiro inteligente" está posicionado. Esta Master Edition é projetada para clareza e velocidade, apresentando um sistema único de Auto-T
Delta DOM X
Carlos Pascual Perez Maturano
DeltaDOM — Volume Profile + Depth of Market + Delta Volume Overview DeltaDOM is a professional all-in-one Order Flow analysis indicator for MetaTrader 5. It combines three powerful tools in a single indicator: a real-time Volume Profile , a live Depth of Market (DOM) panel , and a Delta Volume tracker — giving you institutional-grade market visibility directly on your chart. ️ License Notice: This version does not include license verification or account binding. It runs freely on any MT5 accoun
CandleVolume
Fillipe Dos Santos
CandleVolume is an indicator that colors bars according to increasing or decreasing volume. You can use it to identify strategic regions of the chart and complete an analysis. White means low volume, yellow means medium volume and red means climax volume. It is a recommended indicator if you like to interpret market contexts and understand how market cycles work.
The Supernova Momentums indicator simplifies the visual perception of the price chart and reduces the time for analysis: if there is no signal, the deal is not opened, and if an opposite signal appears, it is recommended to close the current position. This arrow indicator is designed to determine the trend. Supernova Momentums implements a trend trading strategy, filters out market noise, and includes all the necessary features in one tool. Its work is based on automatically determining the cu
MSB Pro SMC Gold
Kemal Mustafa Ozkan
MSB Pro SMC Gold desenha no seu gráfico as ferramentas essenciais de Smart Money Concepts e as atualiza a cada nova vela. Foi desenvolvido e testado em XAUUSD (ouro) e funciona em qualquer ativo e timeframe. Todos os cálculos usam apenas velas fechadas. Depois de desenhados, um sinal, um BOS/CHoCH, um Order Block ou um FVG não são apagados nem redesenhados em velas posteriores. Os pontos de swing são confirmados após o fechamento das velas da janela direita, como em qualquer ferramenta baseada
VOLUME PROFILE SAF-XII Análise de Perfil de Mercado Profissional para MT5 (O indicador dos sonhos para traders de Grade/Grid) O QUE É O PERFIL DE VOLUME (VOLUME PROFILE)? O Perfil de Volume é uma ferramenta institucional profissional que exibe a atividade de negociação em níveis de preços específicos, ao contrário dos indicadores de volume tradicionais que mostram o volume ao longo do tempo. Ele revela ONDE a negociação ocorreu dentro da janela de sua escolha, ajudando a identificar: ÁREAS DE V
Elite Harmony Signals Pro Panoramica Elite Harmony Signals è un indicatore sofisticato di analisi tecnica che visualizza rettangoli dinamici che forniscono zone di trading chiare e segnali di conferma per decisioni migliorate. Caratteristiche Principali Zone Rettangolo Dinamiche Estensione in Tempo Reale : I rettangoli si estendono automaticamente all'azione corrente del prezzo Chiusura Intelligente : I rettangoli si chiudono solo quando appaiono segnali opposti Conferma Visiva : Zone di trading
Smart Fair Value Gap Pro
Joao Luiz Savioli Filho
Unlock the power of Smart Money Concepts (SMC) with the cleanest FVG indicator on the market. Smart FVG Pro is not just another gap detector. It is designed for professional traders who need to filter out noise and focus on high-probability reversal zones. Unlike standard indicators that clutter your chart with every minor gap, Smart FVG Pro uses advanced filtering logic (Trend + Volatility) and a unique "Smart Mitigation" system to automatically remove invalidated zones, keeping your chart clea
Este indicador permite-lhe desfrutar os dois produtos mais populares para analisar volumes de ofertas e das negociações no mercado a um preço favorável: Actual Depth of Market Chart Actual Tick Footprint Volume Chart Este produto combina o poder de ambos os indicadores e é fornecido como um único arquivo. Venda Anti-crise. Hoje com menor preço. Anda logo! A funcionalidade do COMBO Actual Depth of Market e Tick Volume Chart é totalmente idêntica aos indicadores originais. Você vai aproveitar o po
Os compradores deste produto também adquirem
RelicusRoad Pro MT5
Relicus LLC
4.96 (25)
Pare de chutar suas operações. Saiba quando entrar, onde sair e para que lado o mercado está pendendo, tudo em um único gráfico. O RelicusRoad Pro reúne quase vinte ferramentas em um só indicador, e você liga apenas as que combinam com o seu jeito de operar. Entradas claras. Saídas claras. Um plano em cada gráfico. Parece familiar? Você compra, e o preço vira contra você um minuto depois. Você fecha cedo demais e depois vê o movimento continuar sem você. Cinco indicadores no gráfico, cinco respo
Azimuth Pro
Ottaviano De Cicco
5 (7)
Azimuth Pro V2: Estrutura Fractal Sintética e Entradas Confirmadas para MT5 Visão geral Azimuth Pro é um indicador de estrutura swing multinível da Merkava Labs . Quatro camadas de swing aninhadas, VWAP ancorado em swings, detecção de padrões ABC, filtragem estrutural de três timeframes e entradas confirmadas em barra fechada — um gráfico, um fluxo de trabalho dos micro-swings aos macro-ciclos. Este não é um produto de sinais cegos. É um fluxo de trabalho baseado em estrutura para traders que v
Boba Analysis Suite
Trade Ready Solutions LLC
5 (2)
Boba Analysis Suite O Boba Analysis Suite é um indicador de análise para o MetaTrader 5. Reúne a estrutura do mercado, as zonas de preço relevantes e o contexto geral do mercado numa única visualização do gráfico. Desenvolvido a partir da experiência prática como trader e formador de traders, apoia um processo de análise estruturado: avaliar a direção do mercado, identificar níveis importantes e analisar vários períodos gráficos em conjunto. Análise em contexto O significado de cada sinal depend
Fx Levels Premium Indicator Support and Resistance are important concepts in trading. Fx Levels Premium was created to easily draw important levels of support and resistance for the active trader. The indicator will give you all important levels (support/resistance) to watch for a wide range of assets. Trading without these levels on your chart is like driving a car for a long journey without a roadmap. You would be confused and blind. Support and resistance levels should be used as guideline
Neuro Poseidon MT5
Daria Rezueva
4.68 (53)
Neuro Poseidon is a new indicator by Daria Rezueva. It combines precise trading signals with adaptive TP/SL levels - creating best possible trades as a result! Message me and get  Neuro Poseidon Assistant  as a gift to automize your trading process! What makes it stand out? 1. Proven profitability on all assets and timeframes 2. Only confirmed BUY and SELL signals present on the chart 3. Adaptive TP & SL levels generated by the software for each trade 4. Easy to understand - suitable for al
ARICoins
Temirlan Kdyrkhan
ARICoin is a powerful trading companion designed to generate high-probability entry signals with dynamic TP/SL/DP levels based on volatility. Built-in performance tracking shows win/loss stats, PP1/PP2 hits, and success rates all updated live. Key Features: Buy/Sell signals with adaptive volatility bands Real-time TP/SL/DP levels based on ATR Built-in MA Filter with optional ATR/StdDev volatility Performance stats panel (Success, Profit/Loss, PP1/PP2) Alerts via popup, sound, push, or email Cust
The Oracle Pro
Ottaviano De Cicco
5 (1)
The Oracle Pro: Motor de Viés Multi-Timeframe Sintético para MT5 The Oracle Pro é um motor de viés multi-timeframe premium para MetaTrader 5, criado para traders exigentes e profissionais. Responde com disciplina a uma pergunta: qual é o viés direcional em cada timeframe agora, qual a sua força e quanto os timeframes concordam? Tudo é calculado apenas em barras fechadas - sem repintura. The Oracle Pro é um sistema de consenso multifator. Combina indicadores proprietários e algoritmos otimizados
ScalpPoint
Temirlan Kdyrkhan
ScalpPoint is a powerful trading companion designed to generate high-probability entry signals with dynamic TP/SL/DP levels based on volatility. Built-in performance tracking shows win/loss stats, PP1/PP2 hits, and success rates — all updated live. Key Features: Buy/Sell signals with adaptive volatility bands Real-time TP/SL/DP levels based on ATR Built-in MA Filter with optional ATR/StdDev volatility Performance stats panel (Success, Profit/Loss, PP1/PP2) Alerts via popup, sound, push, or emai
AriFocus
Temirlan Kdyrkhan
AriFocus - Non-Repainting Buy/Sell Signals AriFocus - one clear signal. AriFocus marks buy and sell signals directly on the chart and suggests a stop-loss level for each one. Every signal is confirmed on bar close and never repaints. - Buy/sell arrows, confirmed on bar close - Suggested stop-loss level for every signal - Trend band and candle coloring to show direction at a glance - 10 ready-made presets, or your own settings (14 calculation methods) - Pop-up, push and email alerts with entr
ARIPoint
Temirlan Kdyrkhan
1 (4)
ARIPoint is a powerful trading companion designed to generate high-probability entry signals with dynamic TP/SL/DP levels based on volatility. Built-in performance tracking shows win/loss stats, PP1/PP2 hits, and success rates all updated live. Key Features: Buy/Sell signals with adaptive volatility bands Real-time TP/SL/DP levels based on ATR Built-in MA Filter with optional ATR/StdDev volatility Performance stats panel (Success, Profit/Loss, PP1/PP2) Alerts via popup, sound, push, or email Cu
Zain Gold Scalping
Ahmed Gamal Abdel Nasser Mohamed
A complete price-action analysis tool built around dual independent entry logic, each confirmed against a volatility band, combined with a configurable set of nine optional confirmation filters that let you shape exactly how conservative or aggressive the tool's signals behave. Core Strategy Two independent entry setups, each triggering only when price moves outside a dynamic volatility band — giving two distinct ways to spot potential reversal points, which can be used together or separately.
SQN Max indicator for MT5 by ITC
Renaud Herve Francois Candel
Sqn Max Indicator Sqn Max is an exclusive indicator to trade the market with high effectiveness. The indicator is based on price action, volatility and trend. This indicator is as simple as possible but not too simple. The indicator can generate alerts to ease the trading process. You don't have to stay all day in front of your screen. The indicator can be used with any class of assets and with any time frame. It is possible to achieve better results trading our list of selected assets. We achi
Naked Forex Tweezer Pro Indicator Tweezer Pro Indicator is a pattern recognition indicator for Forex, Stocks, Indices, Futures, Commodities and Cryptos. The standard Tweezer is a two bar pattern. Our enhanced version is a multi-bar pattern. We filter the patterns for you so that you only get the     best and most effective patterns   and ignore the noise. The Tweezer pattern is a simple and effective pattern to trade. The strategy that comes with the Tweezer is based on price action. The Twe

Naked Forex Kangaroo Tail Pro Indicator Kangaroo Tail Pro Indicator is a pattern recognition indicator for Forex, Stocks, Indices, Futures, Commodities and Cryptos. The Kangaroo Tail is a multi-bar pattern. The Kangaroo Tail pattern is very effective and is very simple to trade. The strategy that comes with the Kangaroo Tail is based on price action. The indicator does what it was designed for: displaying Kangaroo Tail patterns.     Don't expect to follow the up and down arrows and make mone
Gem SIGNAL
Shengzu Zhong
5 (1)
GEM Signal Pro GEM Signal Pro é um indicador seguidor de tendência para MetaTrader 5, desenvolvido para traders que desejam sinais mais claros, setups mais estruturados e uma gestão de risco mais prática diretamente no gráfico. Em vez de mostrar apenas uma seta simples, o GEM Signal Pro ajuda a apresentar a ideia completa da operação de forma mais clara e fácil de entender. Quando as condições são confirmadas, o indicador pode mostrar o preço de entrada, o stop loss e os alvos de take profit no
Olá, traders! A maioria dos traders de retalho depende de scripts web lentos. Para operar com verdadeira rentabilidade, é necessário um framework institucionalizado. O indicador Astro AI não é uma sobreposição gráfica padrão. Trata-se de uma rede neural compilada contendo dois agentes que são executados diretamente no seu terminal. Eis a tecnologia específica por trás do sistema: 1. Agente 1: Analista (Rede Neural Gráfica - GNN) Os mercados não são barras de preço isoladas; são redes de dad
Have you ever wondered why most systems are not effective in live trading? My answer is that it's all the fault of the so-called "Smart Money" or the institutional ones,, they constantly create spikes first up then down and vice versa to screw all the retail investors by tearing away their capital, confusing them and making the markets move randomly without any rules. But in all this there is a famous strategy, which in 2009 won the world championship, exploiting and rowing against the instituti
OmniSync Projection
Antonio-alin Teculescu
5 (1)
Chronos Fractal Engine is an innovative price projection indicator for MetaTrader 5, designed to transform your technical analysis by intelligently identifying and projecting historical price patterns. Built upon an advanced correlation algorithm and the fractal principles of the market, this powerful tool visualizes potential future price movements, giving you a unique edge in your trading decisions. What is Chronos Fractal Engine? At its core, the Chronos Fractal Engine employs a sophisticat
Title:FX-AIEA Supply and Demand Zone Indicator (MT5) — Technical Overview Version: 2.51 | Platform: MetaTrader 5 Introduction Supply and demand zones are considered a core manifestation of institutional order flow, providing a more direct reflection of buying and selling pressure than traditional support/resistance levels. This indicator attempts to automate the identification of high-probability supply and demand zones using an adaptive ZigZag algorithm, reducing the subjectivity and time asso
Orderflow Big Trade Revele a pressão oculta dentro das velas com mapas de calor de Delta estimado Você está perdendo a atividade crítica que acontece dentro das velas padrão? O Orderflow Big Trade utiliza algoritmos avançados de ponderação por amplitude de preço e fechamento para estimar a pressão de compra e venda em níveis de preço agrupados. Em vez de depender apenas do volume bruto, ele transforma a dinâmica do price action em um mapa visual claro de Delta — ajudando você a identificar in
ZAB Supply Demand MTF automatically detects institutional supply and demand zones across up to 9 timeframes and draws them directly on your chart. Based on Sam Seiden's methodology, this indicator identifies the exact zones where banks and institutions placed their orders. Why This Indicator? Unlike basic support/resistance tools, ZAB Supply Demand MTF classifies every zone by its formation pattern and merges overlapping zones from different timeframes into high-probability confluence areas. Key
Ace Trend
Mikhail Sergeev
5 (3)
Apresentamos-lhe um indicador revolucionário que muda as regras do jogo no mundo da negociação de tendências. O indicador foi projetado para repensar o desempenho e elevar sua experiência de negociação a uma altura sem precedentes. Nosso indicador possui uma combinação única de recursos avançados que o diferenciam da concorrência. A tecnologia de ponta "Real Pricing Factors" oferece estabilidade incomparável, mesmo nas condições de mercado mais desafiadoras e voláteis. Diga adeus a padrões instá
OrderFlow Absorption – Indicador Profissional de Delta e Sinais de Absorção para MT5 Desbloqueie o poder da verdadeira análise de fluxo de ordens com o OrderFlow Absorption – o indicador definitivo de histograma de delta e sinais de absorção para MetaTrader 5. Desenvolvido para traders que desejam enxergar o que realmente acontece por trás de cada movimento de preço, esta ferramenta revela pressões ocultas de compra/venda e eventos de absorção que movimentam o mercado. Recursos Visualização do H
Chimera Volume
Marko Milenkovic
Chimera Volume para MetaTrader 5 Análise avançada de volume e visualização da atividade de mercado O Chimera Volume é um indicador personalizado para MetaTrader 5, concebido para analisar a atividade do volume normalizado e apresentar as mudanças na participação de mercado através de um quadro visual dinâmico. O indicador processa dados de volume de ticks utilizando algoritmos de normalização adaptativa e gera uma representação estruturada da intensidade do volume, das fases de acumulação e das
—— 进入本指标前,请谨记:『 不易,变易 』。拔开数理统计的枝叶,变化是不变的定理才是本指标的由来和内涵思想。本指标只应指明变化到不变之间的契机。 本指标——阴阳线指标(YiiYnn)由一条粗蓝色实线和一条细烟绿色虚线构成,粗实线叫阳线(Ynn),作为主线,细虚线叫阴线(Yii),作为辅线。本指标不同DeMarks去搜索哪个周期的最高最低,也不同Stoch那样告诉你超买超卖超过后缩小再等超买超卖直至资金的尽头。本指标是分析价格减速动态均值线的(偏)相关性及自相关性,并采用标准差的方法进行滤波以求趋势示意更明朗。所以,本指标有以下特性: 指标依据波浪理论,有二阶线性插值模拟组合多条均线(开收高低)构建波浪动力并分析它们各自相关性,所以将对趋势有很好的 预测性 ——与MACD、ATR等相比。它并非只让我们看到趋势的尾巴,请参考最后一张示例图; 指标采用简单的方差进行差相过滤,在兼顾计算性能的同时让盘整阶段的指示更明朗; 阳线与阴线之间是偏相关差相,具有阴消阳长相互激励、抵消的特点,因此命名; 本指标中判定的趋势与常人所称『趋势』不同,本指标中的趋势包括: 上涨、下跌和横盘 。不要忽略横盘
ORB Seeker MT5
Marcela Goncalves De Oliveira
Preço especial para limitar a disponibilidade e manter a escassez do produto! Apenas $599! Após a compra, entre em contato comigo para receber o EA ORB Seeker bônus e os arquivos de configuração otimizados personalizados. Faça sessões de tratamento eficazes com confiança! O ORB Seeker MT5 é um indicador profissional de Ruptura da Faixa de Abertura (ORB) desenvolvido para traders que buscam precisão, simplicidade, flexibilidade e uma estrutura de gráfico clara. Ele traça automaticamente a faixa
Zain Gold ScalpingV5
Ahmed Gamal Abdel Nasser Mohamed
Zain Gold Scalping V5 is a technical analysis indicator for MetaTrader 5 designed for Forex and Gold markets. It provides chart-based market information, trend analysis, signal conditions, and an on-screen dashboard to help traders analyze price movement across multiple timeframes. Main Features The indicator supports multiple timeframes, including M1, M5, M15, M30, H1 and higher timeframes. It can be used with Gold (XAUUSD), Forex currency pairs, indices and other supported instruments. The in
TrendMaestro5
Stefano Frisetti
note: this indicator is for METATRADER4, if you want the version for METATRADER5 this is the link:  https://www.mql5.com/it/market/product/108106 TRENDMAESTRO ver 2.5 TRENDMAESTRO recognizes a new TREND from the start, he never makes mistakes. The certainty of identifying a new TREND is priceless. DESCRIPTION TRENDMAESTRO identifies a new TREND in the bud, this indicator examines the volatility, volumes and momentum to identify the moment in which there is an explosion of one or more of these da
The indicator is designed to close positions on the market in time. For example: to take profits ahead of schedule if the price has not reached TakeProfit, and the market is turning around. The indicator analyzes the momentum, not the trend. He does not give any information about the trend. The indicator is well suited for finding divergence. The Ershov 38 Parrots indicator dynamically adjusts to the market and detects price movement impulses of medium and high amplitude. It almost does not rea
First time on MetaTrader, introducing IQ Star Lines, an original Vedic Astrology Based Intraday Trading Indicator. We don't offer free or bonus indicators in exchange of reviews from you. You won't need any free products with this indicator to make it work. ;) Enjoy! Welcome to the new and updated  IQ Star Lines , the ultimate fusion of ancient planetary cycles and modern quantitative trading, published for the first time on Metatrader. This is an indicator built by the developer, who has spent
Mais do autor
Wicks Trade Panel
Lee Teik Hong
4 (1)
Wicks Trade Panel  It's a Trade Panel include Order Management & Risk Management for serious trader. Especially for those traders who pay attention to important events like the CPI, NFP, and ADP. A one-of-a-kind faster technique to fix the Entry Price by simply pointing the mouse pointer at it. This is what I enjoy about it. Automatically closing 50% order size lots when setting TRUE on Breakeven Status. It's especially useful when trading on significant economic events like the CPI, NFP, and A
FREE
Entry Cluster Indicator for MT5 Entry Cluster is a professional-grade trading system engineered to deliver precise, high-probability entries without repainting or hindsight bias. Designed for serious traders, it integrates momentum analysis with institutional price levels to identify only the most reliable setups. Signal Clarity : Dots mark potential buy/sell zones, allowing traders to prepare. Gems confirm execution points, triggered only when momentum aligns with key levels. Robust Framework
FREE
Heiken Ashi Button
Lee Teik Hong
4.75 (4)
Heiken Ashi Button Heiken-Ashi , often spelled Heikin-Ashi, is a Japanese word that means "Average Bar." The Heiken-Ashi approach can be used in conjunction with candlestick charts to spot market trends and forecast future prices. It's useful for making candlestick charts easier to read and analysing patterns. Traders can use Heiken-Ashi charts to determine when to stay in trades while the trend continues and close trades when the trend reverses. The majority of earnings are made when markets a
FREE
Features The Expert Advisor (EA) is a semi-automated trading system that blends user-initiated entries with algorithmic trend management. Trade entries are triggered manually, while scaling, trailing stops, and risk control are handled automatically by the EA. Functional Specifications 1. Trading Modes Manual Execution Mode Trades initiated via on-chart control panel User selects Buy or Sell direction EA applies predefined Stop Loss and Take Profit values Trend management logic activates after
FREE
Super Trend Button
Lee Teik Hong
5 (1)
Super Trend Button Super Trend is a trading strategy according to which one should trade Forex or Stocks when its price trend goes up, and trend goes down, expecting price movements to continue. “The trend is your friend” agree? Features -   Special Button   : Quick hide/show   Super Trend   chart. ( Make your Chart more clean and clear easily) -   Color   : You have the option of customising your favourite colour of   Up Trend or Down Trend . -  Super Trend Periods   : You have the option to c
Smart ADR
Lee Teik Hong
Smart ADR as an indicator displays the average daily range of 3 timeframes such as Daily, Weekly, and Monthly.  Using the combination of 3 timeframes of ADR as a reference to shows fixed range and dynamic range targets as lines on your charts.  Inputs Smart ADR Parameters Indicator Name - Display the indicator name Daily Periods - Display the Daily Periods of ADR Weekly Periods -  Display the Weekly Periods of ADR Monthly Periods -  Display the Monthly Periods of ADR Daily Line Show ON - Set T
Auto Fibonacci Button The Fibonacci retracement is a popular and reliable technical analysis tool for traders to determine support and resistance areas.  It employs the "Golden Ratio," a mathematical pattern seen throughout nature and even the universe, to forecast particular levels of support level and resistance level.  This tool is generated in technical analysis by dividing the vertical distance between two extreme points on the chart (typically a peak and a low) by the important Fibonacci
Wicks Trade Panel Premium  It's a Trade Panel include Order Management & Risk Management for serious trader. Especially for those traders who pay attention to important events like the CPI, NFP, and ADP. A one-of-a-kind faster technique to fix the Entry Price by simply pointing the mouse pointer at it. This is what I enjoy about it. Automatically closing 50% order size lots when setting TRUE on Breakeven Status. It's especially useful when trading on significant economic events like the CPI, NF
Breakout Preparation Choppy movement up and down on the opening range everyday.  Trading breakouts on London session and New York session is recommended. Setting a bounce for a certain time zone and trade when the bounce reveals a break through.   Input Parameter Indicator Name Days to Show Start Time to Analysis End Time to Analysis Bounce Show till Time Chart Setting Color Scheme Selection Happy Trading and thanks for support.
Wicks UpDown Target Choppy movement up and down on the opening range every day.  Trading breakouts on London session and New York session is recommended. Wicks UpDown Target is specialized in all forex pairs. Guideline Entry Strategy Idea: Step 1 - Breakout Forming (Warning! Trade on London Session and New York Session) Step 2 - Breakout Starting (Take Action on your trading plan) Step 3 - Partial Close your order & set breakeven (no-risk) Step 4 - Target complete Step 5 - Don't trade in Sto
Idea Pro Trend Premium This EA is a Semi-auto Trading Panel with a variety of strategic settings, such as those listed below. It is excellent for scalping or long-term trading by traders. This EA is simple and convenient to trade and attach to the chart with the default settings on AUDUSD, EURUSD, GBPUSD and NZDUSD. How to use You can trade based on the trend that is displayed on the left-hand side of Info Panel. If the trend are" 2 Up Trend" and "2 Down Trend", please do not trade. Simply pro
Key Level  Key Level is a MetaTrader 4 Indicator that uses a proprietary algorithm based on Price Retracement/Breakout Method to show the Entry-Line on your trading. Instead, it analyzes data of market and identify entry points and opportunities. (Price Retracement / Price Breakout) It's also a trading tool that be used to practice and enhance your manual trading skills. Key Level is an amazing tool for Scalping Trader. It also a trading tool that be used to practice and enhance your manual trad
Entry Cluster Indicator Summary What It Does: Entry Cluster is a MetaTrader 4 indicator that combines momentum analysis with structural price levels, using Bollinger Bands to filter signals and reduce false entries. Unique Features: Non-repainting signals that only appear on closed candles Auto-detects optimal price levels for different assets Multi-channel alerts (sound, popup, mobile push notifications) Fully customizable visuals and parameters Signal System (4-Tier): Small Dots = "Get Ready"
Key Features 1. Trading Modes Manual Mode (Recommended): Use the on-chart panel to execute Buy/Sell orders with full control Auto Mode: RSI-based strategy backtesting use 2. Martingale Risk Management Automatic lot size multiplication after stop loss hits Reverse trade execution (Buy→Sell, Sell→Buy) Configurable multiplier and maximum lot size Automatic reset to initial lot size after take profit 3. Professional UI Dashboard Real-time lot size display Live position status and profit/loss tracki
Recommended Setup Parameter Recommendation Symbol All Symbols Timeframe M15, M30 Minimum Balance $250 Recommended $500+ Broker Type ECN / RAW Spread Risk per Trade 0.5-2% Prop Firm Compatible Yes (strictly drawdown control) What makes Entry Cluster indicator unique: Combines momentum analysis with structural levels (entry cluster levels) Non-repainting signals that only appear on closed candles Intelligent auto-detection of optimal price levels for different assets Comprehensive alert system f
BEAST TRADEMATE   1. Overview Beast TradeMate is a comprehensive multi-feature MetaTrader 5 (MT5) chart indicator that combines TDI-based trade signal detection, multi moving average trend filtering, sweetspot level mapping, TP/SL auto-projection, and a full alert system into a single, unified tool. It is designed to provide traders with high-probability entry signals while keeping the chart clean and informative. 2. Signal Types Beast TradeMate produces four distinct types of trade signals, ea
G-FiboTrend — Indicator Description G-FiboTrend is a trend-channel indicator for MetaTrader 5 that plots dynamic Fibonacci-based price zones over a rolling lookback period. How It Works The indicator scans a user-defined number of bars ( FiboPeriod ) to identify the highest high (HH) and lowest low (LL) within that window. From this range, it derives three key levels: Upper Band — Fibonacci level (default 61.8%) Mid Band — 50.0% midpoint Lower Band — Fibonacci level (default 38.2%) These levels
QUANTUM VOLATILITY ENGINE -------------------------------------------------------------------------------- Analysis Report Panel: V olatility S ignals, T rade S tats and L evel A dvisor An on-chart analysis panel for MetaTrader 5. It combines a weekday-average volatility signal, multi-timeframe EMA trend, a volume profile , SMC concept, LRC channel and supply/demand zones, with optional trade management. Overview This Expert Advisor draws an analysis report on the chart and can optionally man
Filtro:
Sem comentários
Responder ao comentário