Advanced Optimization Report
- Utilitários
-
Aleksei Kuznetsov
 Advanced Optimization Report
Otimiza estratégias de negociação no Meta Trader 5 (MT5)? Use uma visão mais avançada e mais visual dos resultados de otimização com os benefícios das páginas HTML interativas.
Brevemente sobre as vantagens:
- Filtros para qualquer critério e limiar (min / max). - Versão: 1.8
- Atualizado: 12 junho 2026
- Ativações: 5
Are you optimizing your trading strategies? Use the advanced and more visual representation of optimization results with the benefits of interactive HTML pages. Examples and detailed instructions.
Here are some of the benefits:
- Easy-to-understand graphs.
- Filters by any criterion and threshold (min/max). In MT5, there are only 5 of them.
- 43 optimization criteria instead of 8. All the criteria recorded in .opt files are available.
- If you have access to the EA code, you can add balance and equity graphs for each pass and 38 custom optimization criteria (Sharpe ratios, Sortino ratios, mathematical expectation in pips, standard deviation, Z-score, Money Compounding, LR Standard error, LR Correlation, R2, Profit Stability, Deviations from Line, and other criteria. You can also add custom criteria that you have programmed yourself).
This report should be seen by anyone who is optimizing their trading strategies.
In MT5, there are only 5 filters for the thresholds selected by the developers.
In the "Advanced Optimization Report" you can apply filters to all parameters and criteria. You can apply >= and/or <= (min, max) filters to any threshold. When you enter a value and press Enter or when you lose focus from the input field, the results table will be rebuilt, the graphs will be redrawn, and the statistics will be recalculated. Only the remaining rows will be used in the new calculation.
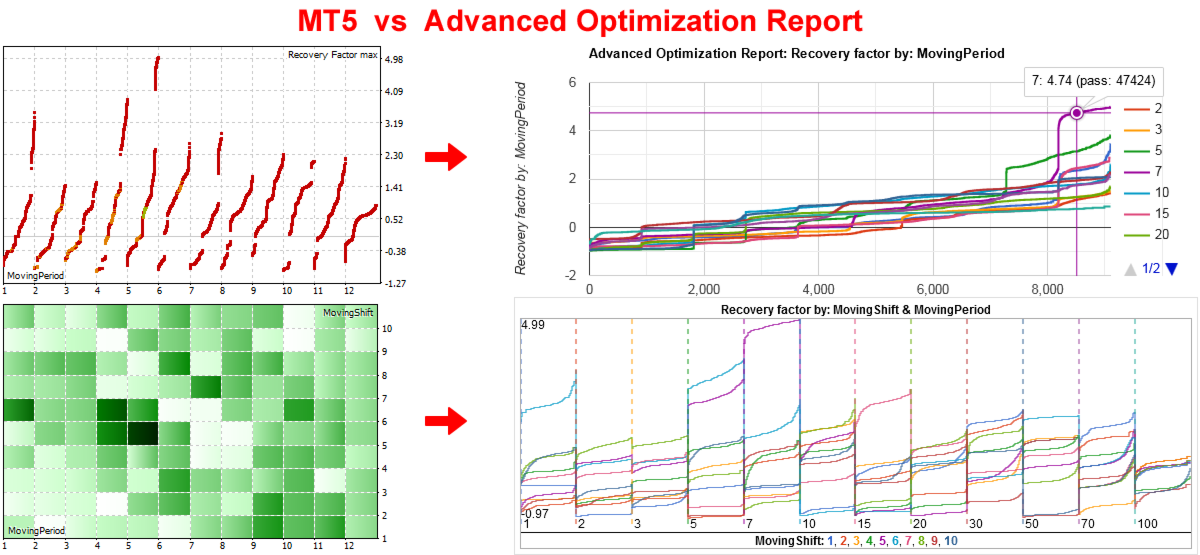
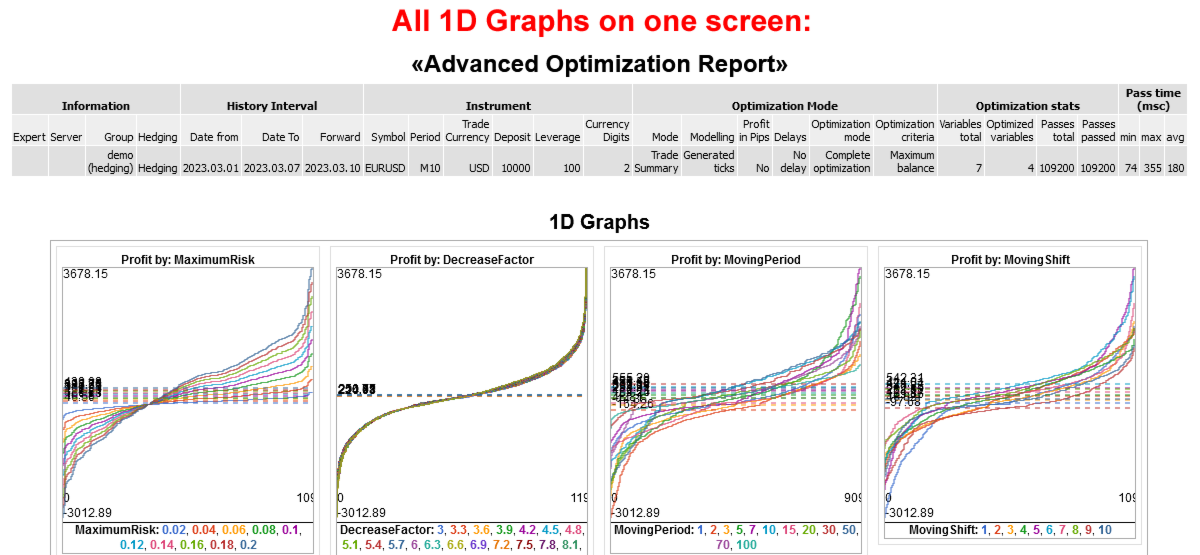
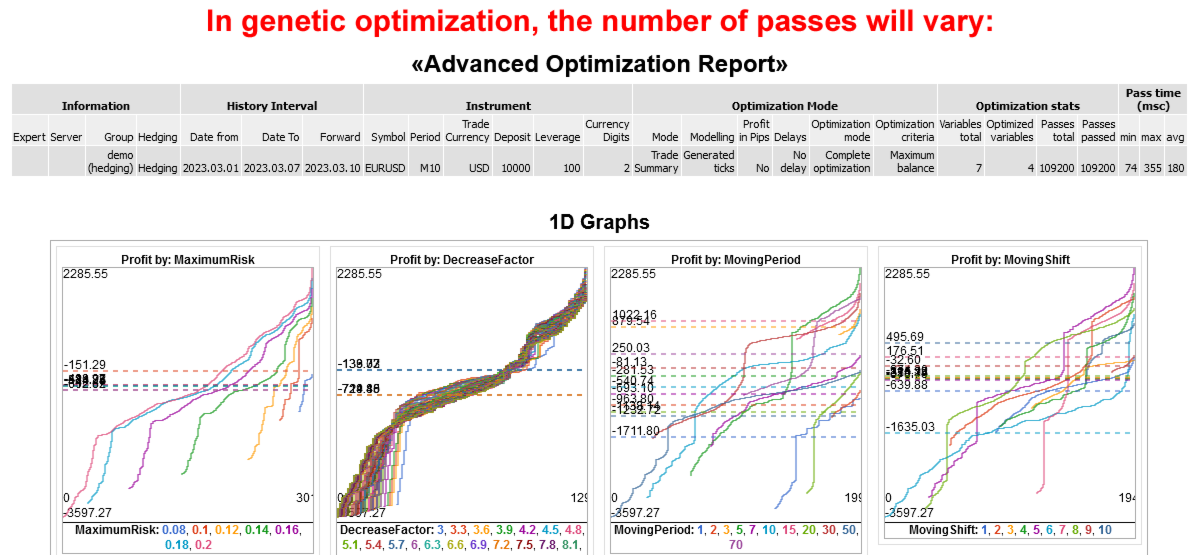
1D charts
The charts for the optimized parameters are made more easy to understand.
MT5 - shows the values in the form of points spaced along the x-axis, i.e. separately. It is difficult to compare the values of parameters that are located from each other at a distance of 100-1000 pixels.
Advanced Optimization Report - shows all the lines on one chart in one scale, but in different colors, so they can be distinguished from each other and compared. An example on the logo and on the first screenshot.
Advantages:
- For each line, its average value is shown as a dotted horizontal line.
- To view specific parameter values in detail, you can filter them. For example, you can select SL above 100 or below 1000, or between 100 and 500, and the charts will be redrawn to display only the selected values.
This is especially useful if you have more than 10 different values. MT5 does not provide this feature. - Similarly, you can apply filters to any optimization criterion. For example, you can set the profit to be greater than 1000, the number of trades to be greater than 100, and the drawdown to be less than 10%. This is very convenient.
- In MT5, you can only view the optimized parameters one at a time. Here, you can view all of them at once, which is also convenient for analysis.
- Each chart can be enlarged for detailed examination.
2D charts
Insteead of a mosaic with colored rectangles, mini-charts are drawn. The first parameter in a pair is represented by one of the colored lines (for example, there are 4 lines in total), and the second parameters are separated by vertical dotted lines on the X-axis (for example, there are 6 columns). In total, there are 4 lines in 6 columns = 24 mini-charts. In MT5, this is drawn as 24 colored rectangles.
Statistics of the optimized parameters:
Under the 1D and 2D charts, there are buttons labeled "Show Min/Max/Avg/Med." If you click on these buttons, you will see tables with statistics for the currently selected optimized parameter or evaluation criterion.
You will see the maximum, average, median, minimum value, and the number of passes with it. The rows are sorted by Average.
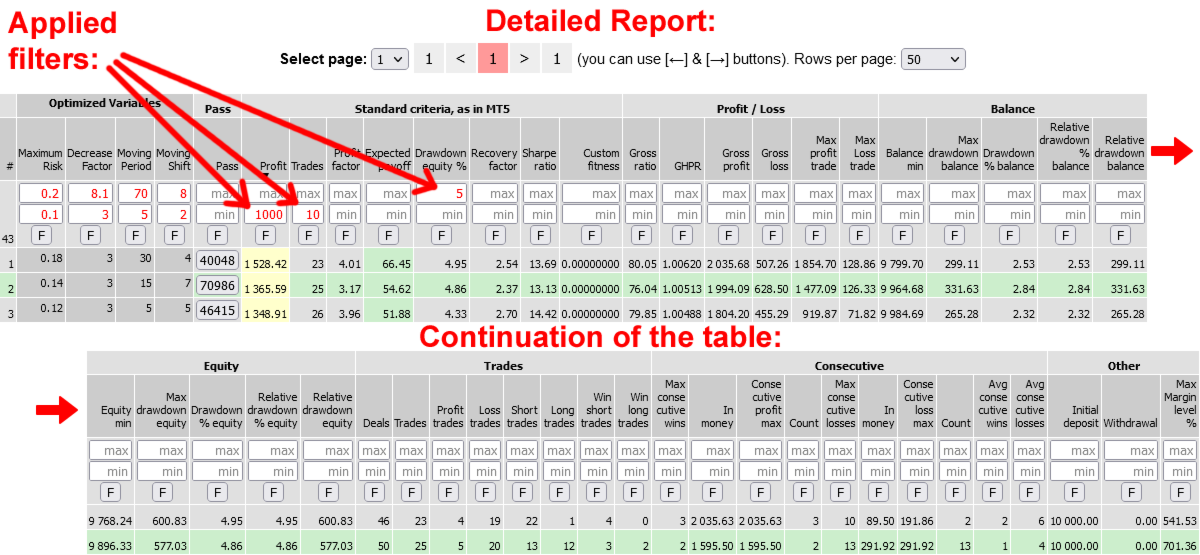
Detailed report
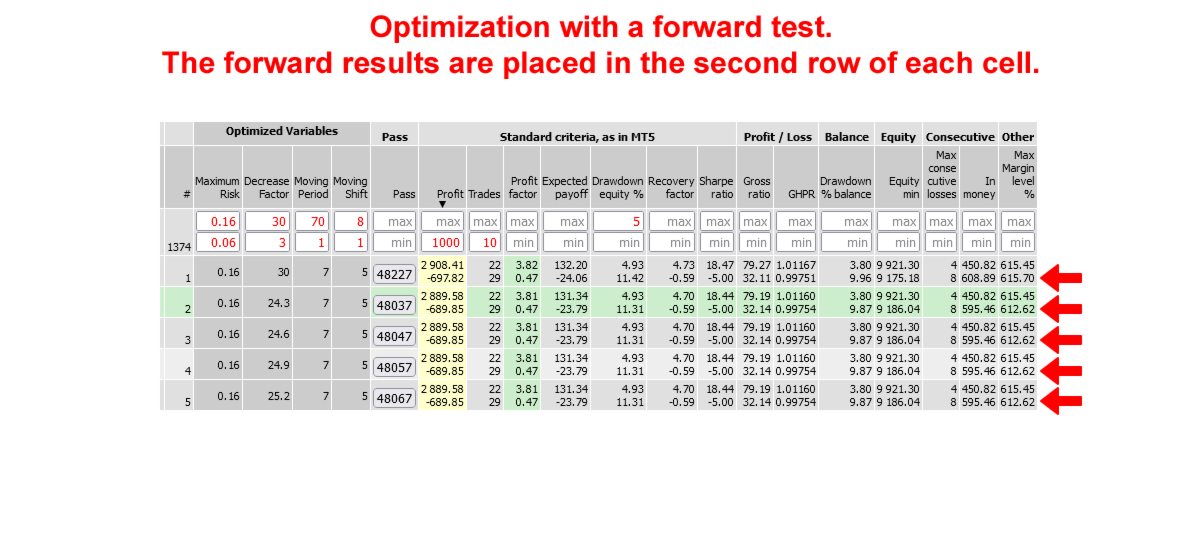
It receives optimization data from the .opt file, which contains a lot of information that you don't see in the MT5 optimization report.
It displays 8 standard strategy optimization criteria, similar to MT5.
Additionally, it shows 33 other strategy evaluation criteria, which you can only see in the MT5 report after a single test. The "Advanced Optimization Report" will show you everything before running a single test.
It also includes 2 parameters that can be calculated from the others: GHPR = (BalanceClose / BalanceOpen)^ (1/Deals) and Gross ratio = Gross profit / (Gross profit + Gross loss) * 100%.
Additional control buttons are located below the detailed report table:
- If you click on the "Edit Columns" button, you can hide the columns that you are not interested in for evaluation. This will make the table take up less space and only show the information you need.
- If you click on the "Hide Rows" button, the [-] buttons will appear in the Pass column for each row. Clicking on these buttons will hide the corresponding rows.
Other features:
- If a forward test has been added to the optimization, its values will be displayed in the second row of each cell. This is more convenient than in MT5, where there are two separate reports. The forward test values are not included in calculations, graphs, sorting, or filtering. However, you can create a separate report by selecting only one file with a forward test.
- When you click on any cell in the table, the row and column are highlighted in color. This copies the settings for the selected pass to the clipboard. You can then go to the tester's settings tab and press Ctrl-V to apply the settings.
- Additionally, the Pass column includes a button that downloads the pass_XX.set file for running a single test.
Below are the program's features if you have access to the Expert Advisor code and can add additional functions to it.
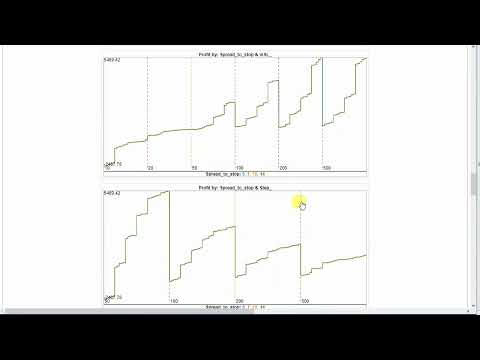
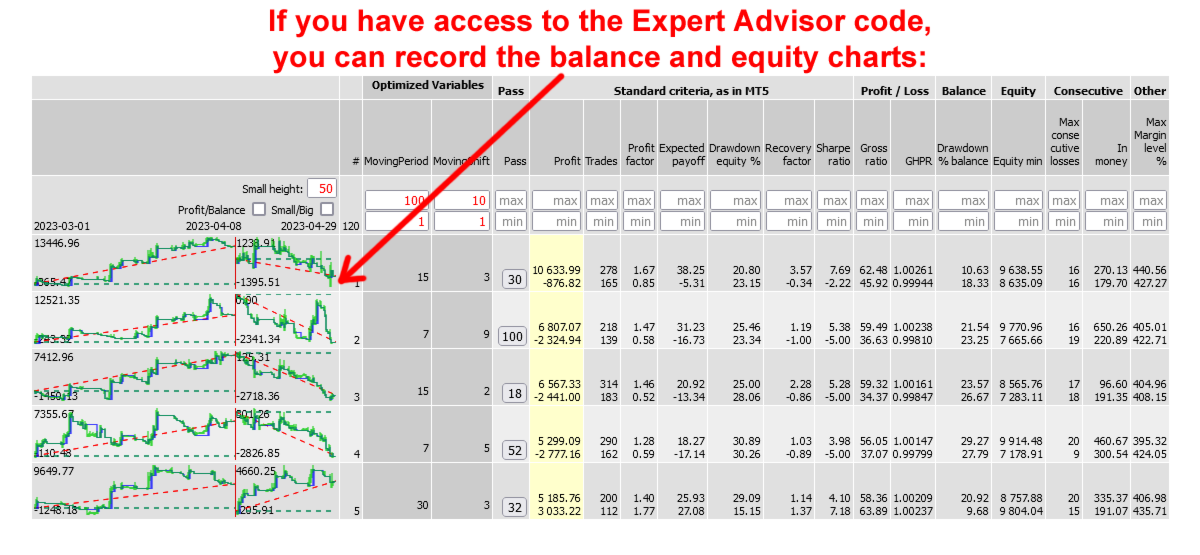
Mini-charts of balance and equity:
If you have access to the Expert Advisor code, you can add functions that will save the balance and equity lines, as well as calculate 38 additional optimization criteria collected from various articles. The mini-charts will be displayed in each line of the report, so you don't need to run single tests for each option you're interested in - you'll see them immediately. Once you've selected the most interesting options, you can test them in the MT5 tester using single testing.
Peculiarities:
- The balance and equity charts show trades on a time scale, rather than with equal intervals between trades (as in the MT5 tester). It is possible that there are 2 months between trades, but they are displayed side by side as if there are 5 minutes between them.
- The mini charts are displayed at a height of 50 pixels, and clicking on them increases the height to 255.
- The width of the chart can be selected before starting the test. It is recommended to use a width of 200-300 pixels, as this is sufficient for visual perception, as shown in the examples. However, the width can be adjusted up to 2000 pixels.
- If the optimization was performed using a forward, it will be displayed to the right of the backtest chart. The width of the forward will be proportional to the testing period, ensuring that the time scale is consistent for both charts.
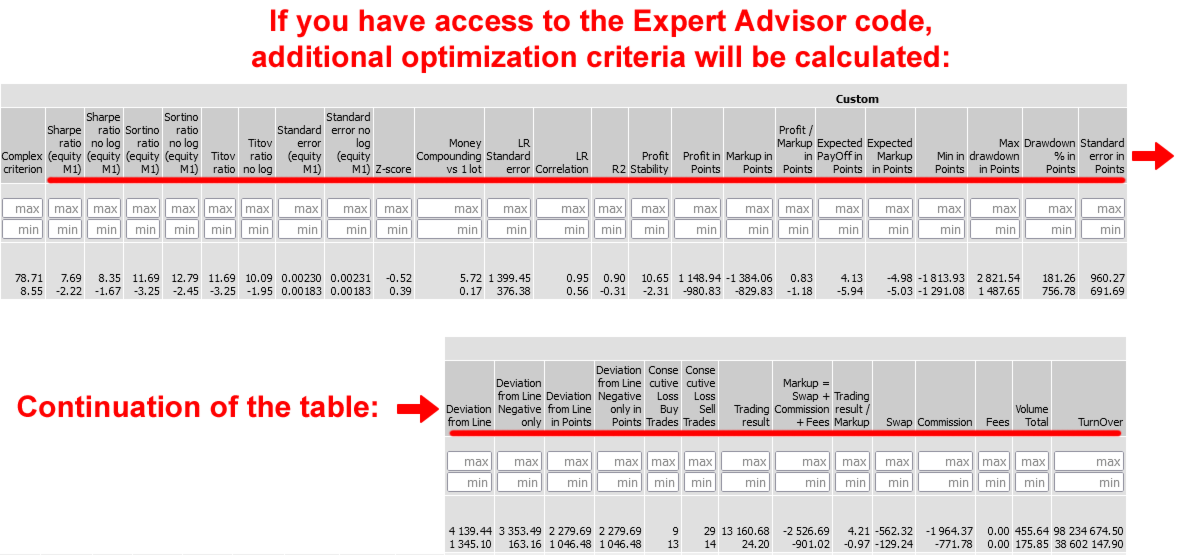
Additional optimization criteria
The added code allows you to add additional optimization criteria to the report:
- Complex optimization criterion (it is not available in the .opt file, but only through functions that can be connected to the code)
- Coefficients: Sharp, Sortino, Titov, and standard deviation
- Z-score, Money Compounding vs 1 lot, LR Standard error, LR Correlation, R2, Profit Stability
- Deviation from Line, Deviation from Line Negative only, Deviation from Line in Points, Deviation from Line Negative only in Points - the maximum deviations of the price from the straight line between the first and last trade.
- Criteria in points: Profit, Markup, Profit / Markup, Expected PayOff, Expected Markup, Min, Max drawdown, Drawdown % in Points, Standard error.
- They are calculated as if you were always trading with one lot.
- For example, when trading with martingale, it may turn out that the profit in points is negative, and the gain is achieved only due to the increase in the lot and the risk of trading.
- The number of repeated losses is displayed separately for Buy and Sell.
- Total: Trading result. Additionally, Swap, Commission, and Fees are included, and their sum is equal to Markup. This division can be useful for analyzing expenses.
- Trading result / Markup - to assess how much more you earn than you spend.
- Total: Volume and Turnover. These can be useful for evaluating rebates.
The additional code that records balance and equity charts and calculates additional optimization criteria can be downloaded here - https://www.mql5.com/en/code/68706

Очень благодарен автору за эту утилиту. В первый же день смог "вычесать" из сотен вариантов действительно впечатляющие пресеты. Рекомендую всем кто в вечном поиске и не надеется на пресеты от "авторов".