RelicusRoad Pro

4.65

거래를 더 이상 감으로 하지 마세요.

언제 진입할지, 어디서 청산할지, 시장이 어느 쪽으로 기울어 있는지를 한 차트에서 확인하세요.

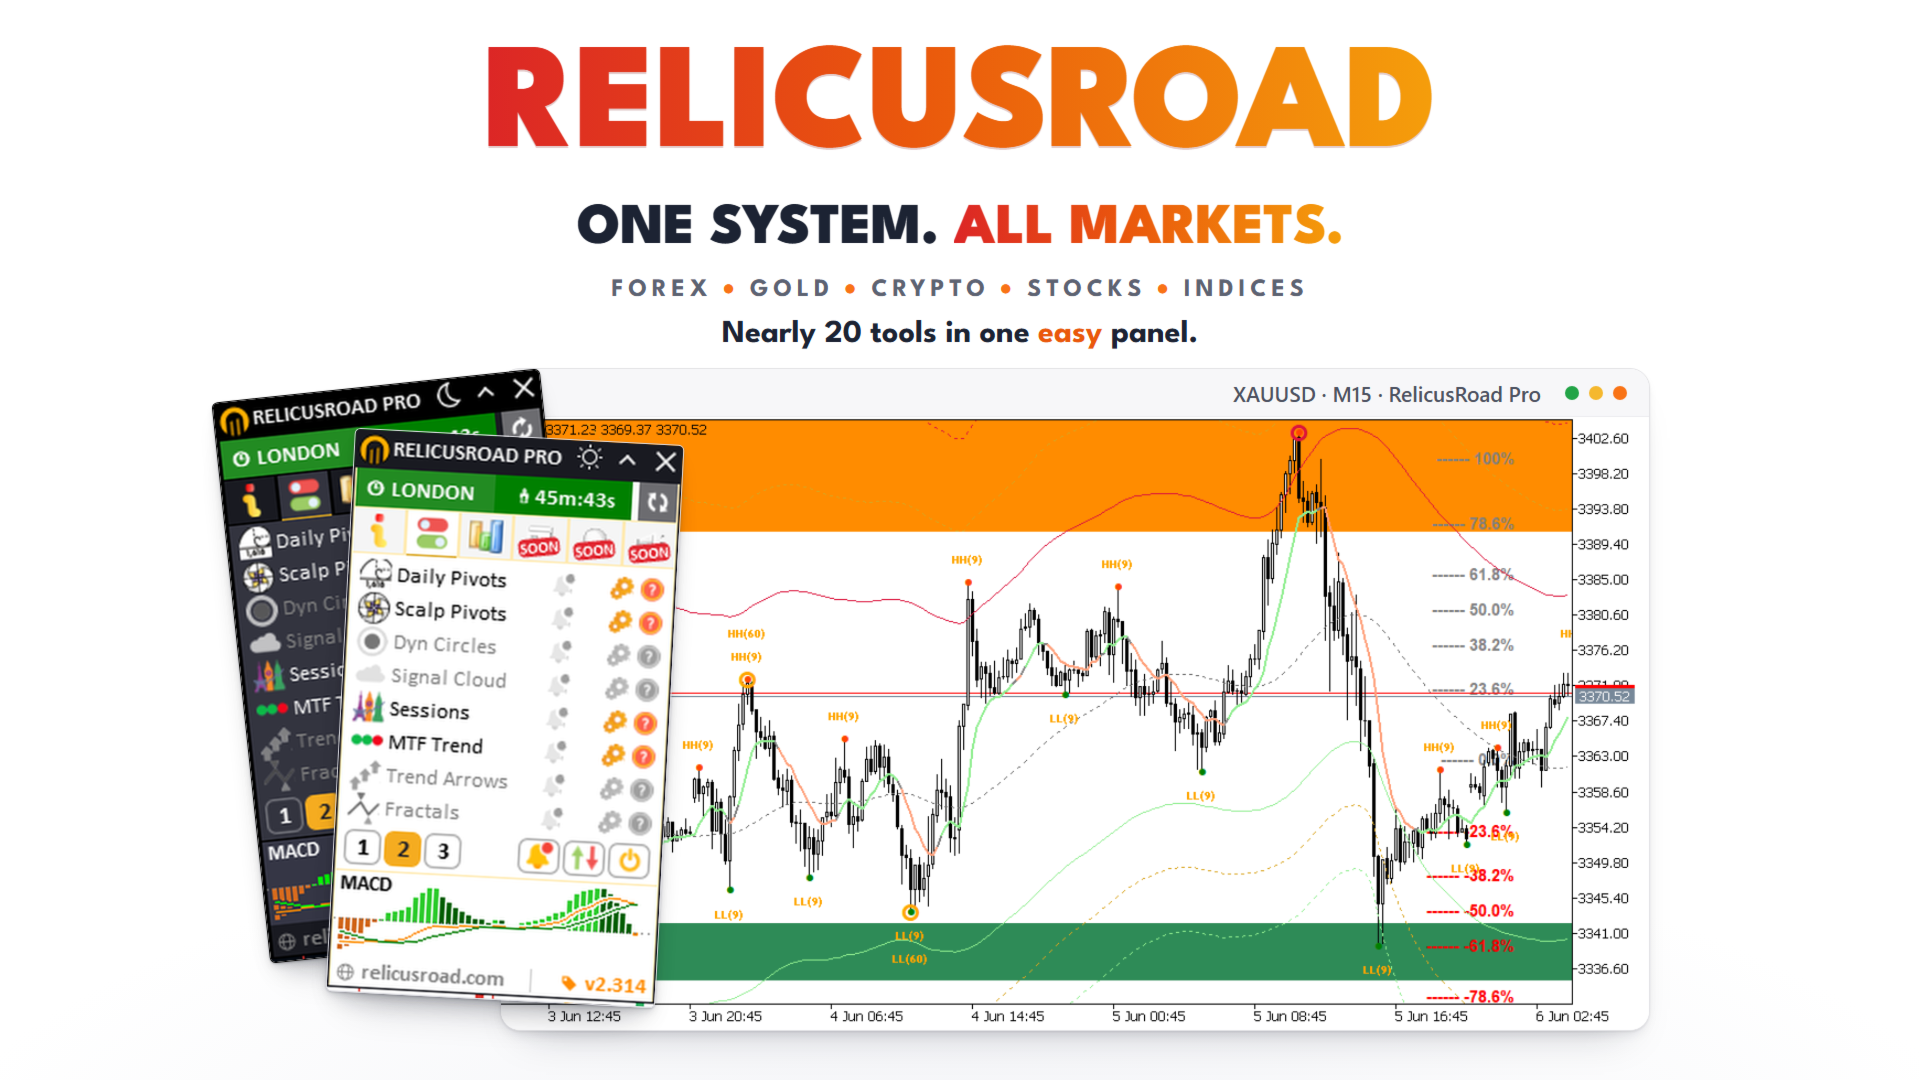
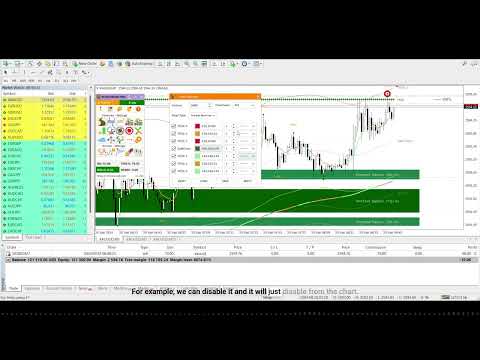
RelicusRoad Pro는 20개 가까운 도구를 인디케이터 하나에 담았고, 내 매매 방식에 맞는 도구만 켜서 쓰면 됩니다.

명확한 진입. 명확한 청산. 차트마다 확실한 계획.

이런 경험, 익숙하지 않으신가요?

  • 매수하면 1분 뒤 가격이 반대로 돌아섭니다.
  • 너무 일찍 청산하고, 그다음 움직임이 나 없이 이어지는 것을 지켜봅니다.
  • 지표를 5개 띄우면 답도 5가지가 나옵니다.
  • 손절(스톱로스)은 그냥 감입니다.

우리가 이걸 만든 이유

우리는 18년 동안 외환 거래를 해 왔습니다. RelicusRoad는 처음에 우리끼리 쓰려고, 전문 트레이더 모임을 위해 비공개로 만들었습니다.

이유는 개인적이었습니다. 같은 선을 손으로 계속 그리는 일에 지쳤고, 스스로 정한 규칙을 어기고, 차트에서 정말 중요한 한 가지를 놓치곤 했습니다.

우리에게 통한 것은 일관성입니다. 매일 같은 방식으로 시장을 읽어서 몸이 기억할 때까지 반복하는 것이죠. RelicusRoad Pro는 그 관점을 여러분의 차트에 올려 드립니다.

그 뒤 더 많은 트레이더에게 문을 열었습니다. 작은 모임만으로는 볼 수 있는 범위가 제한적이기 때문입니다.

트레이더마다 새로운 질문과 아이디어를 가져오고, 좋은 것들은 다음 업데이트에 들어갑니다. 지금 들어 있는 도구 중 많은 수가 트레이더들의 요청에서 시작되었습니다.

커뮤니티는 비공개이고 작게 유지하며, 동시 활성 트레이더는 2,000명 선으로 제한합니다. 5년 넘게 RelicusRoad와 함께 거래해 온 분도 계십니다.

인디케이터 하나에 모두 담았습니다

언제 진입할지 알 수 있습니다

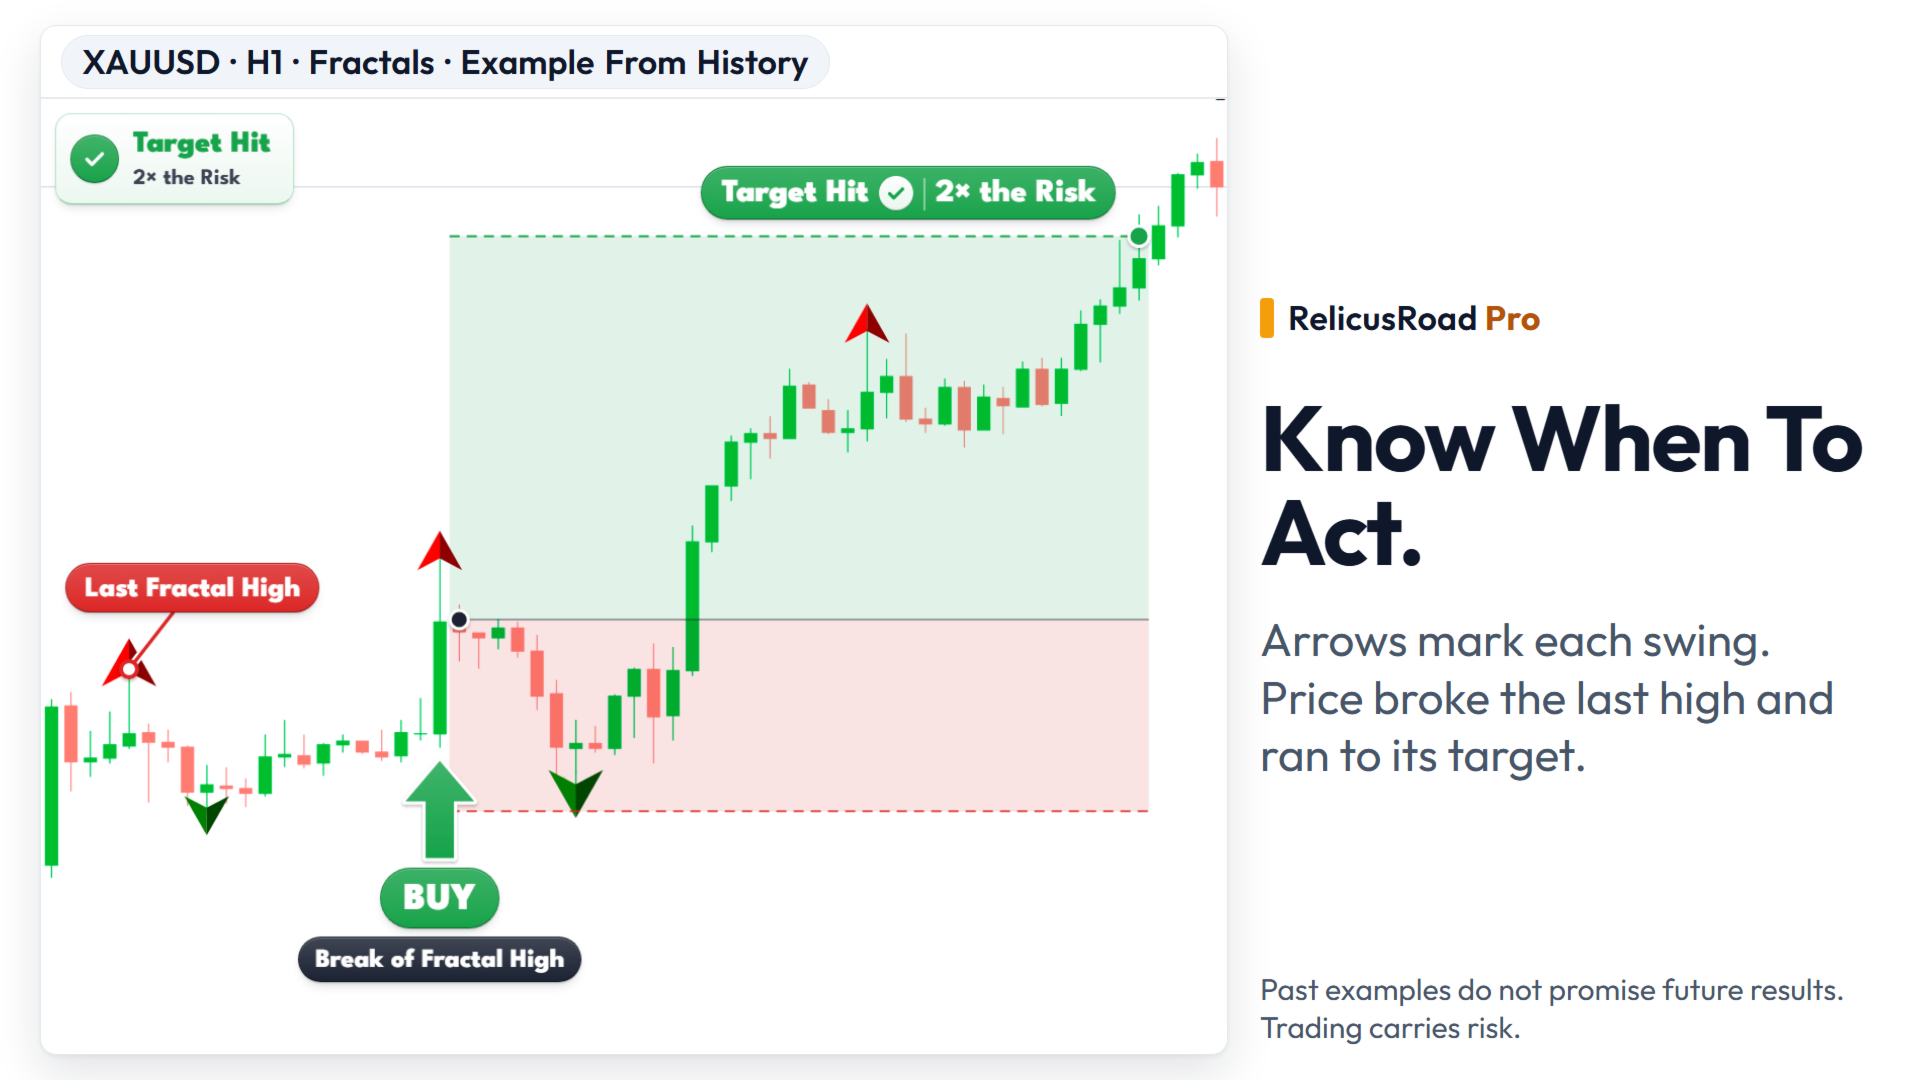
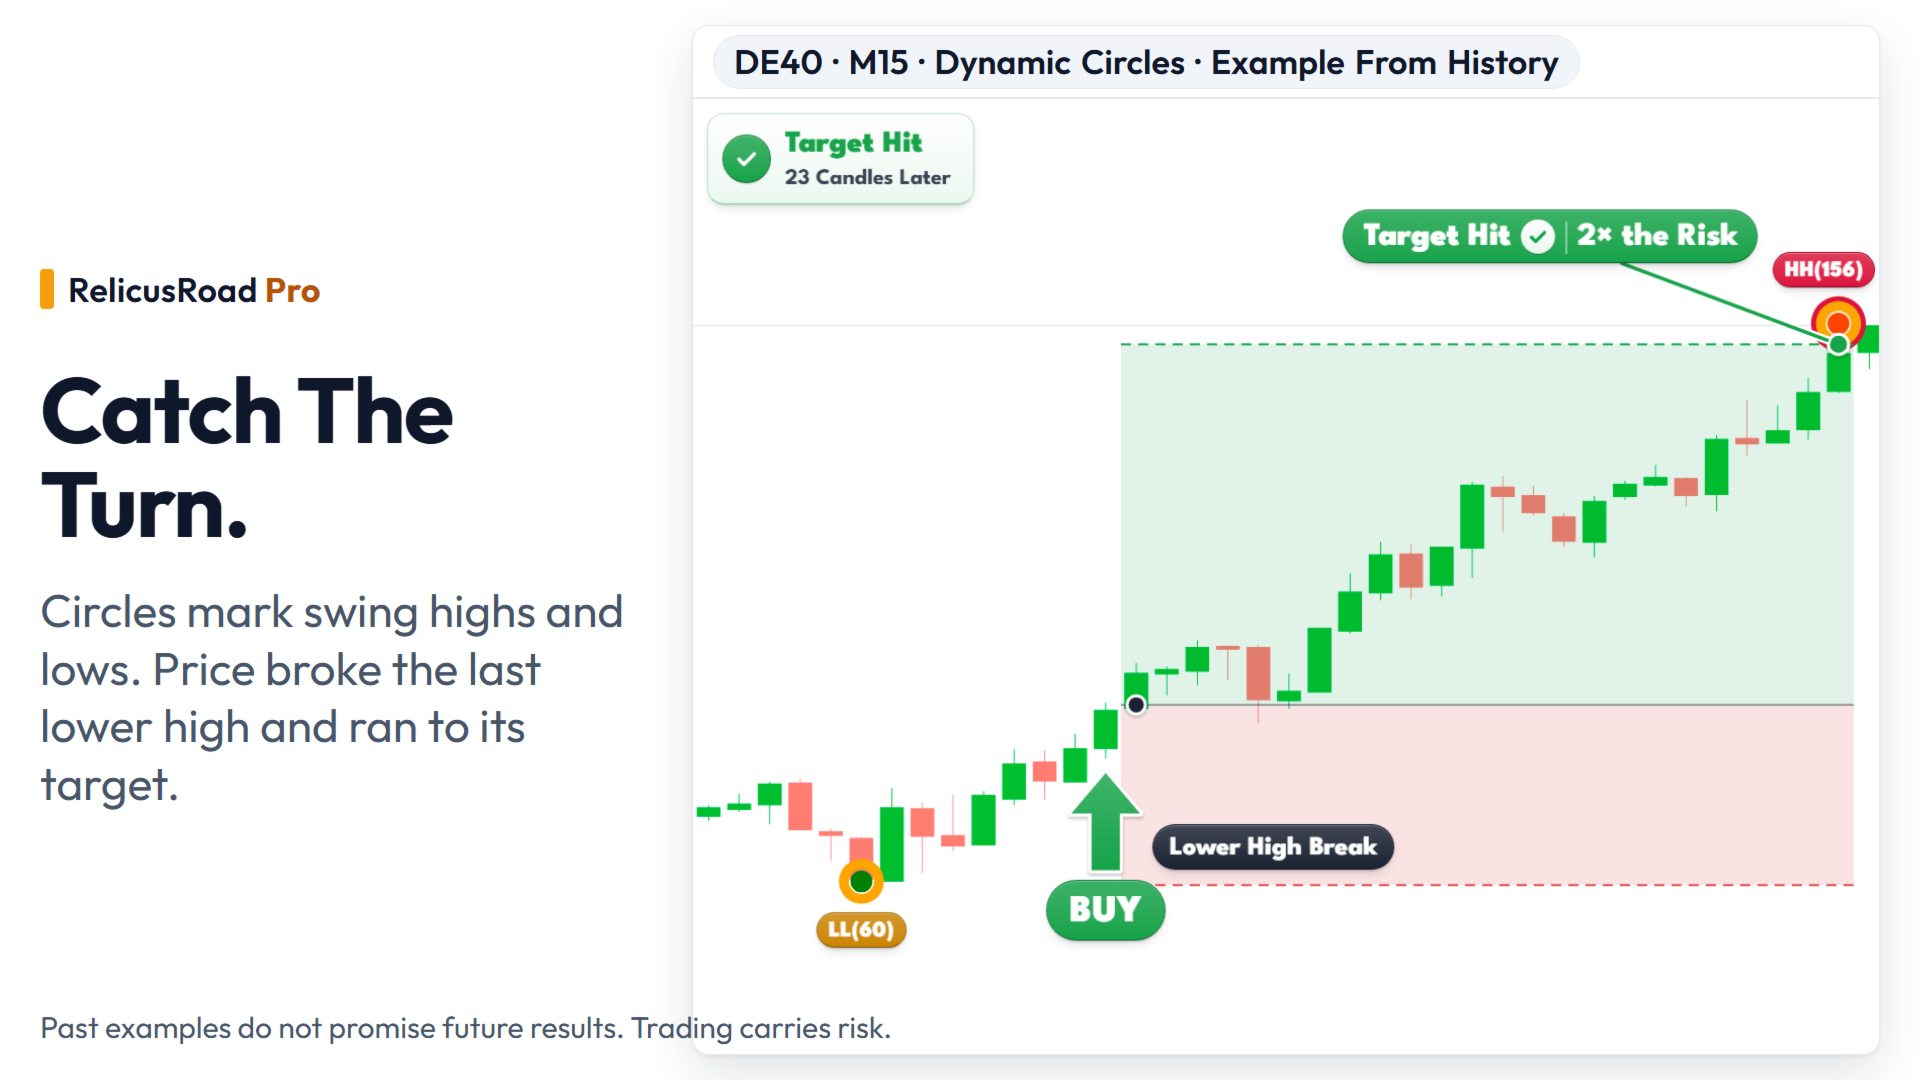
  • 매수와 매도 화살표가 진입 시점을 알려 주니, 감에 의존해서 들어가지 않아도 됩니다.
  • M5에서는 금 트레이더를 위한 전용 세트도 제공됩니다.

어디서 나갈지 알 수 있습니다

  • SuperTrend 신호가 손절(스톱로스)과 목표가를 대신 그려 줍니다.
  • 패널이 그 손절을 기준으로 랏 사이즈를 계산해 줍니다.
  • 진입 전에 청산 계획이 이미 세워져 있습니다.

중요한 가격대를 알 수 있습니다

  • The Road 라인, 추세선, 일일 고점과 저점, 스캘핑 피벗 등을 매일 같은 방식으로 대신 그려 줍니다.
  • 이제 손으로 그릴 필요가 없고, 다른 사람들이 보는 선을 놓치는 일도 없습니다.

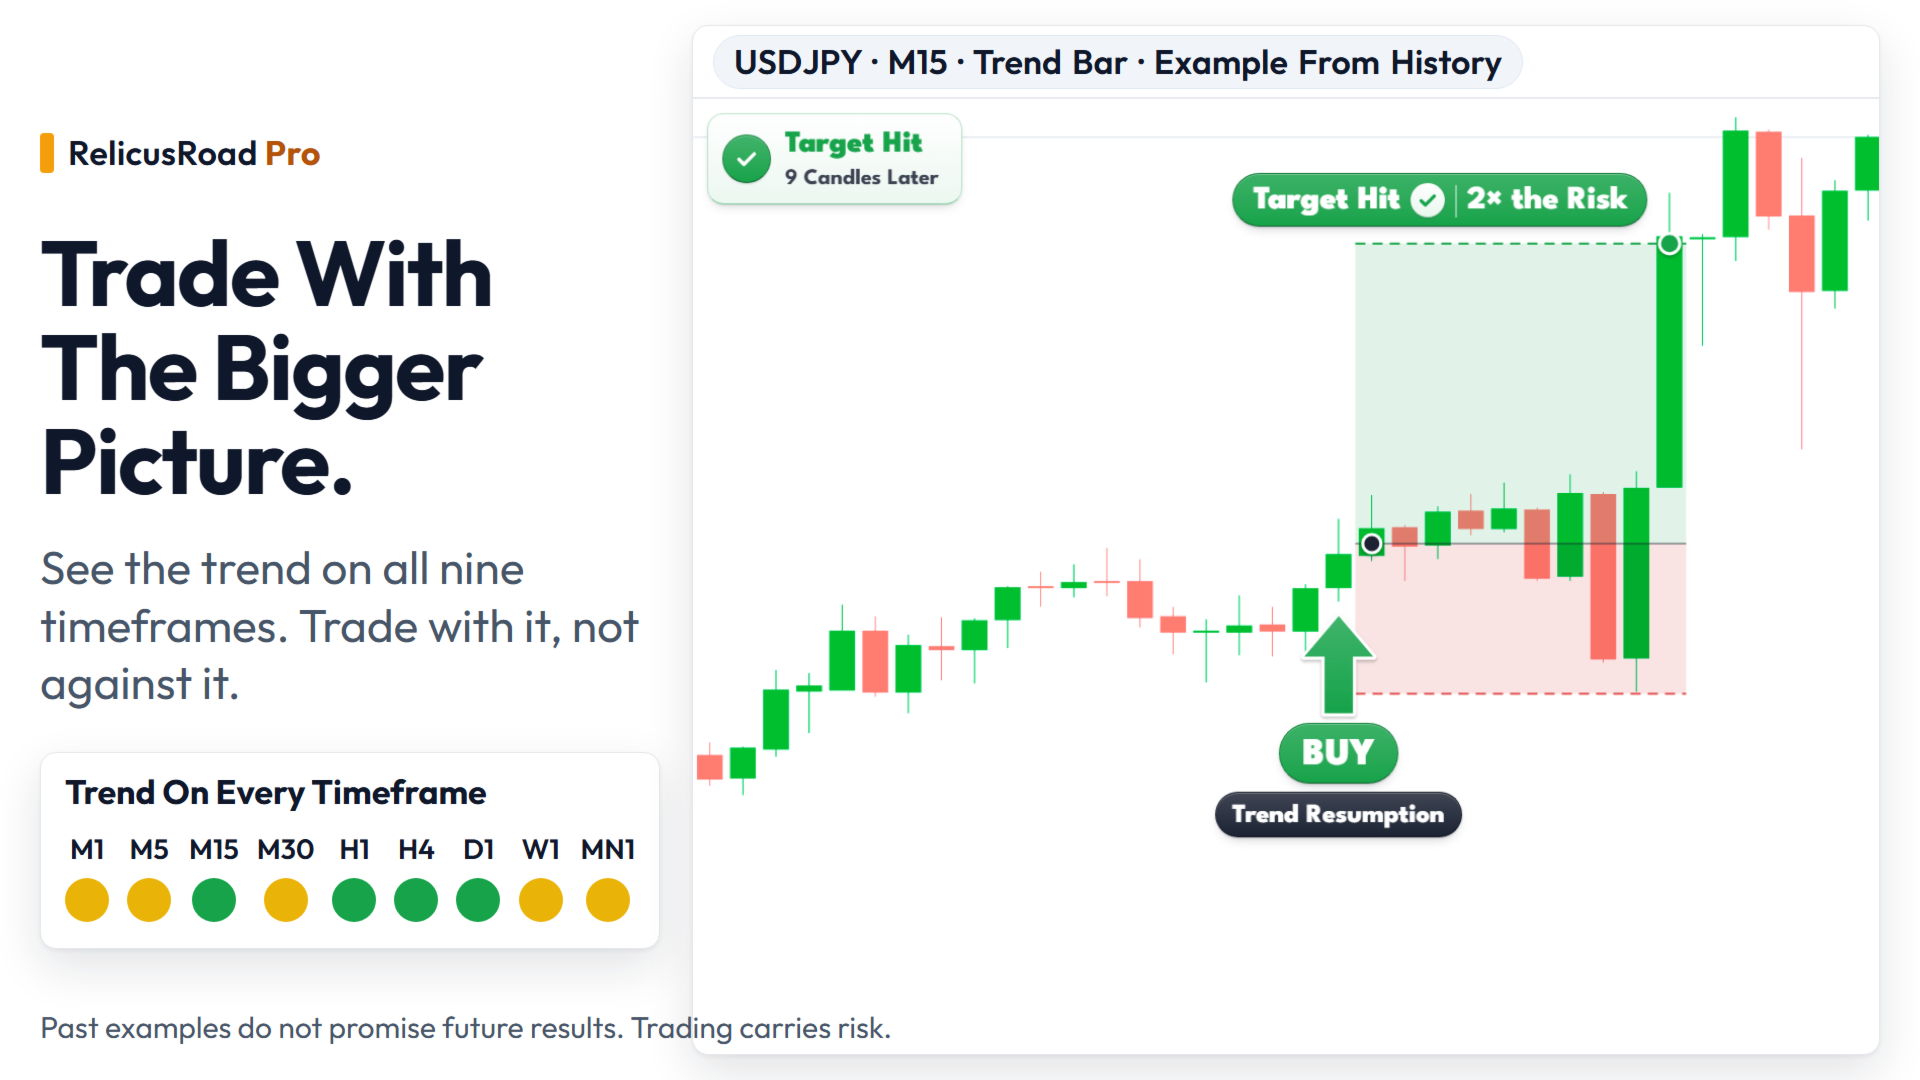
더 큰 흐름과 함께 매매하세요

  • 하나의 막대가 9개 타임프레임 전체의 추세를 한 번에 보여 줍니다.
  • 차트를 여러 개 넘기지 않아도 더 큰 움직임과 맞서 싸우지 않게 됩니다.

화면만 계속 들여다보지 마세요

  • 사용하는 도구의 알림을 켜면 무슨 일이 생길 때 팝업, 이메일 또는 휴대폰 메시지로 받을 수 있습니다.
  • 내 스타일에 맞는 것만 켜고, 심볼마다 설정이 기억됩니다.

다른 인디케이터가 아니라 RelicusRoad Pro인 이유는?

대부분의 인디케이터는 한 가지 일만 하고 나머지는 여러분에게 맡깁니다.

RelicusRoad Pro는 하나의 시스템으로 작동하기 때문에, 차트가 다섯 가지 답 대신 하나의 답을 줍니다.

  • 사용하기도 쉽습니다. 모든 도구는 패널에서 한 번 탭하면 켜지며, 각각 고유한 설정과 내장 가이드를 갖추고 있습니다.
  • 진입뿐 아니라 청산도 보여 줍니다.
  • 화살표만 주는 것이 아니라 문서로 정리된 7가지 전략을 함께 제공합니다.
  • 타이밍에 관해서는 솔직합니다. 스윙 화살표는 추세 전환을 확인하려고 몇 개의 캔들을 기다린 뒤 그 자리에 머무릅니다. 최신의 빠른 프랙탈만 아직 바뀔 수 있습니다.

7가지 전략 포함

각 전략에는 켤 도구, 진입, 손절(스톱로스), 그리고 쉬어야 할 때가 정리되어 있습니다:

  • 핵심 구간의 반등을 두 개의 타임프레임에서 확인합니다.
  • 빠른 스캘핑, 추세선 기준으로 진행합니다.
  • 핵심 레벨의 화살표, 세션별로 필터링합니다.
  • 마이크로 스캘핑, 여러 통화쌍에서 엄격한 한도를 두고 운용합니다.
  • 추세 매매, M5 기준입니다.
  • MACD 교차, M5의 핵심 레벨에서 확인합니다.
  • 반전 매매, 추세선으로 확인하며 모든 타임프레임에서 사용할 수 있습니다.

4단계로 매매하는 방법

  • 1단계 — 7가지 전략 중 하나를 고르고, 그 전략이 명시한 도구를 켜세요.
  • 2단계 — 추세 막대로 방향을 확인하세요.
  • 3단계 — 그 전략이 사용하는 선이나 레벨에서 화살표가 나올 때까지 기다리세요.
  • 4단계 — 그려진 선에서 손절(스톱로스)과 목표가를 정하고, 알림이 지켜보게 하세요.
MetaTrader 4와 MetaTrader 5용입니다. 모든 심볼, M1부터 모든 타임프레임에서 사용할 수 있습니다. 이것은 인디케이터이며 주문을 넣지 않습니다. 거래에는 위험이 따릅니다. 진입하기 전에 포지션 크기와 손절(스톱로스)을 먼저 정하세요.

소개 및 지원

RelicusRoad Pro는 계속 개발되고 있습니다.

질문과 지원은 제품 댓글과 mql5.com 메시징 시스템을 통해 처리합니다.
리뷰 162
Erwin Fonke
672
Erwin Fonke 2025.09.05 06:45 

i am using this indicator in combination with a EA trading assistent. It,s absolute amazing. Almost passed my FTMO challange now. Great work man! Keep it up!

Juan Feliciano
1730
Juan Feliciano 2025.05.07 21:26 

great indicator. super clean and accurate entries. just want to know how to join discord pls

Manuel Gonzalez
170
Manuel Gonzalez 2025.02.16 14:46 

Good morning everyone. Please to the administrator and owner of the indicator. A few years ago I bought this wonderful indicator and wanted to make it work. There was a gentleman within discord who helped me a lot but due to my inexperience I did not understand the instructions well. Now I have acquired more experience and please would like to recover the accesses to: User Manual + Strategies + Training Videos + Private Group with VIP Access + Mobile Version Available (Separately) Please help me recover these accesses. Thank you very much...

추천 제품
VR Cub
Vladimir Pastushak
VR Cub 은 고품질 진입점을 얻는 지표입니다. 이 지표는 수학적 계산을 용이하게 하고 포지션 진입점 검색을 단순화하기 위해 개발되었습니다. 지표가 작성된 거래 전략은 수년 동안 그 효율성을 입증해 왔습니다. 거래 전략의 단순성은 초보 거래자라도 성공적으로 거래할 수 있다는 큰 장점입니다. VR Cub은 포지션 개시 지점과 이익 실현 및 손절매 목표 수준을 계산하여 효율성과 사용 편의성을 크게 높입니다. 간단한 거래 규칙을 이해하려면 아래 전략을 사용한 거래 스크린샷을 살펴보세요. 설정, 세트 파일, 데모 버전, 지침, 문제 해결 등은 다음에서 얻을 수 있습니다. [블로그] 다음에서 리뷰를 읽거나 작성할 수 있습니다. [링크] 버전 [MetaTrader 5] 진입점 계산 규칙 포지션 개설 진입점을 계산하려면 VR Cub 도구를 마지막 최고점에서 마지막 최저점까지 늘려야 합니다. 첫 번째 지점이 두 번째 지점보다 빠른 경우, 거래자는 막대가 중간선 위에서 마감될 때까지 기다립니다

이 인디케이터는 엘리어트 파동 이론과 두 가지 방식으로 작동합니다: 자동 작동: 이 모드에서는 인디케이터가 엘리어트 파동 이론에 따라 차트 상의 모든 5개의 모티브 웨이브를 자동으로 감지하고 예측 및 잠재적인 반전 지역을 제공합니다. 또한 중요한 개발 사항을 트레이더에게 알릴 수 있는 경보 및 푸시 메시지를 생성할 수 있는 능력을 갖추고 있습니다. 이 자동 기능은 엘리어트 파동 패턴의 식별과 분석 프로세스를 간소화합니다. 수동 작동: 이 옵션은 엘리어트 파동 이론을 수동으로 다루고 싶은 트레이더를 위해 설계되었습니다. 이를 통해 사용자는 아홉 가지 다른 등급을 사용하여 웨이브를 그릴 수 있습니다. 각 등급은 나타난 후에 차트에 그려진 라인을 조정하여 개별적으로 정의할 수 있습니다. 이 기능은 웨이브를 수동으로 그리는 프로세스를 간소화하며 더 효율적으로 만들어 줍니다. 중요한 점으로 모든 그림 데이터가 미래 참조를 위해 플랫폼 데이터 폴더에 저장된다는 것을 기억해야 합니다. 파라미터:


Free automatic fibonacci
Tonny Obare
4.68 (50)
Free automatic Fibonacci is an indicator that automatically plots a Fibonacci retracement based on the number of bars you select on the BarsToScan setting in the indicator. The Fibonacci is automatically updated in real time as new highest and lowest values appears amongst the selected bars. You can select which level values to be displayed in the indicator settings. You can also select the color of the levels thus enabling the trader to be able to attach the indicator several times with differe
FREE
EARLY REMINDER: The Starting price is 65 price will rise soon up to 365$ and then 750$ after first 10 copies of sales. Grab this offer now! Introduction Hello, traders! Welcome to the demonstration of the Forex Beast Indicator , a comprehensive tool designed to assist aspiring traders in navigating the complexities of the forex market. This indicator incorporates seven essential components to provide a well-rounded trading experience: Moving Averages Colored Zones Support and Resistance Levels
Crazy Dancing moving RES/SUP Levels Automatic redrawing of moving Supports and resistances levels  to indicate price breaking supports (signal SELL)  or breaking resistance levels (signal BUY) Very simple appearing indicator but very clever and smart too !!!! Main Inputs: # of bars for the support and resistances levels + the initial shift from start + moving average for filter signaling Smaller values for bars /shift inputs when using Higher Time frames (D1-H4) and the reverse higher values for
BB Trend and Perfect Reversal Zone BB Trend and Perfect Reversal Zone 은 트렌드 추종과 시장 구조 분석을 결합한 하이브리드 트레이딩 인디케이터로, 트레이더가 현재 거래일 내에서 추세 방향, 변동성 변화, 그리고 고확률 반전 구간을 식별할 수 있도록 설계되었습니다. 이 인디케이터는 적응형 변동성 채널과 매일 자동 생성되는 공급 및 수요 구역을 결합하여 시장 구조를 명확하고 직관적으로 분석할 수 있게 합니다. 시장 상황에 동적으로 적응함으로써 추세장, 횡보장, 그리고 변동성 압축(스퀴즈) 구간을 효과적으로 구분합니다. 주요 기능 적응형 변동성 채널 Hull Moving Average(HMA) 또는 EMA를 트렌드 기준선으로 선택 가능 추세, 횡보, 압축 구간 자동 인식 당일 거래일 기준 공급 및 수요 구역 표시 구역 폭 사용자 설정 가능 (포인트 단위) 시장 변동성에 따른 채널 자동 확장 및 수축 실시간 시장 구조 분석 깔끔하고 직
FiboRec
Alfred Kamal
This indicator depends on Fibonacci lines but there is a secret lines i used them, by using FiboRec indicator you will be able to know a lot of important information in the market such as: Features You can avoid entry during market turbulence. You can enter orders in general trend only. You will know if the trend is strong or weak. Signal Types and Frame used You can use this indicator just on H1 frame. Enter buy order in case Candle break out the square area and closed over it, at least 20 pi
Quantum Falcon Signal Free is a smart visual trading indicator for MetaTrader 4 designed for Forex and Gold traders. The indicator combines: • Trend analysis • RSI momentum confirmation • MACD momentum filtering • ATR volatility filtering • Higher timeframe confirmation • Smart exit signal detection Main Features: • Smart Buy and Sell signals • Exit Buy / Exit Sell alerts • Real-time dashboard on chart • Professional candle arrows • Multi-timeframe trend confirmation • ATR market volatility filt
FREE
This indicator is a great utilities tools for Fibonacci Trader that draw their chart manually. This indicator do not draw any Fibonacci Retracement or Fibonacci Expansion. It is a utilities tool for modifying the Fibonacci level for Fibonacci object manually drawn on the chart. Just draw using the Fibonacci Retracement or other Fibonacci tool in MT4 as per normal. The select the Fibonacci you have just drawn. Make sure you have only 1 object selected. Then open up this Fibonacci Level Management
Fibonacci SR Indicator
Martin Eshleman
5 (1)
Fibonacci SR Indicator This indicator creates support and resistance lines. This indicator is based on Fibonacci Retracement and Extension levels. It will consider many combinations of the Fibonacci levels and draw support/resistance lines based on these. This indicator uses tops and bottoms drawn by the ZigZag indicator in its calculations. The ZigZag can also be drawn on the chart, if necessary. The indicator considers many combinations of past reversal points and Fibonacci ratio levels, and w
FREE
MajorAlert
Sergei Vassunov
MajorAlert - is a professional trading indicator for MetaTrader 4 that combines two distinct market analysis approaches into one powerful tool. By integrating a counter‑trend entry logic (upper block) with a trend‑following filter (lower block), the indicator generates high‑probability signals on the chart with clearly separated arrow colors. Key Features Fully self‑contained   – no external indicators required; all calculations are built‑in. Versatile inputs   – adjust all parameters to suit a
Auto Fibo Pro m
DMITRII GRIDASOV
"Auto FIBO Pro" Crypto_Forex 지표 - 거래에 유용한 보조 도구입니다! - 지표는 자동으로 Fibo 수준과 로컬 추세선(빨간색)을 계산하여 차트에 배치합니다. - Fibonacci 수준은 가격이 반전될 수 있는 주요 영역을 나타냅니다. - 가장 중요한 수준은 23.6%, 38.2%, 50%, 61.8%입니다. - 역전 스캘핑이나 존 그리드 거래에 사용할 수 있습니다. - Auto FIBO Pro 지표를 사용하여 현재 시스템을 개선할 수 있는 기회도 많습니다. - Info Spread Swap Display가 있습니다. 현재 Spread와 Swap이 부착된 외환 쌍을 표시합니다. - 디스플레이에는 계정 잔액, 자본 및 마진도 표시됩니다. - 차트의 어느 모서리에서나 Info Spread Swap Display를 찾을 수 있습니다. 여기를 클릭하여 고품질 트레이딩 로봇과 지표를 확인하세요! 이것은 이 MQL5 웹사이트에서만 제공되는 오리지널 제품입니다.
Deep Analyst Expert Advisor    (mt5  https://www.mql5.com/en/market/product/163998 ) Deep Analyst   is a professional analytical tool powered by a specialized algorithm designed for deep analysis of market cycles and price amplitude fluctuations. By analyzing market conditions over a specific timeframe, the Expert Advisor determines price strength and amplitude using a unique indicator system based exclusively on real-time data. When the global trend and its vector shift, the algorithm automati
Flat finder MT4
Yuriy Lyachshenko
이 인디케이터는 플랫을 감지하고 발견된 영역을 컬러 직사각형으로 칠합니다. 이 인디케이터의 주요 아이디어는 가격이 차트의 특정 영역을 채울 때 플랫을 감지하는 것입니다. 입력 매개변수: Color rectangle - 음영 처리할 사각형의 색상입니다. Bars in rectangle - 직사각형에 허용되는 최소 막대 수입니다. Density in % - 플랫의 밀도로, 사각형 영역의 백분율로 설정합니다. __________________________________________________________________ __________________________________________________________________
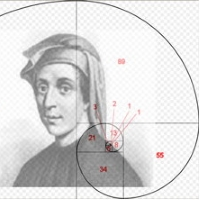
Simply drop the indicator to the chart and Fibonacci levels will be shown automatically! The indicator is developed for automatic drawing of Fibonacci levels on the chart. It provides the abilities to: Select the standard Fibo levels to be shown Add custom levels Draw the indicator on the timeframes other than the current one. For example, the indicator is calculated on the weekly period (W1) and is displayed on the monthly period (MN1) Select the timeframes the indicator will be available on Ca
QuantumEdge Trader
Hossam Ali Ahmed Ali
QuantumEdge Trader v1.0 AI-Powered Precision Signals for Serious Traders QuantumEdge Trader is a smart and reliable indicator that delivers accurate BUY and SELL signals using advanced market analysis and trend detection. Designed for M1 to M60 timeframes, it's ideal for scalping and intraday strategies. --- Key Features: No Repaint – Signals never change after appearing Smart trend filters to reduce noise Adjustable sensitivity and alerts Perfect for XAUUSD, EURUSD, and m
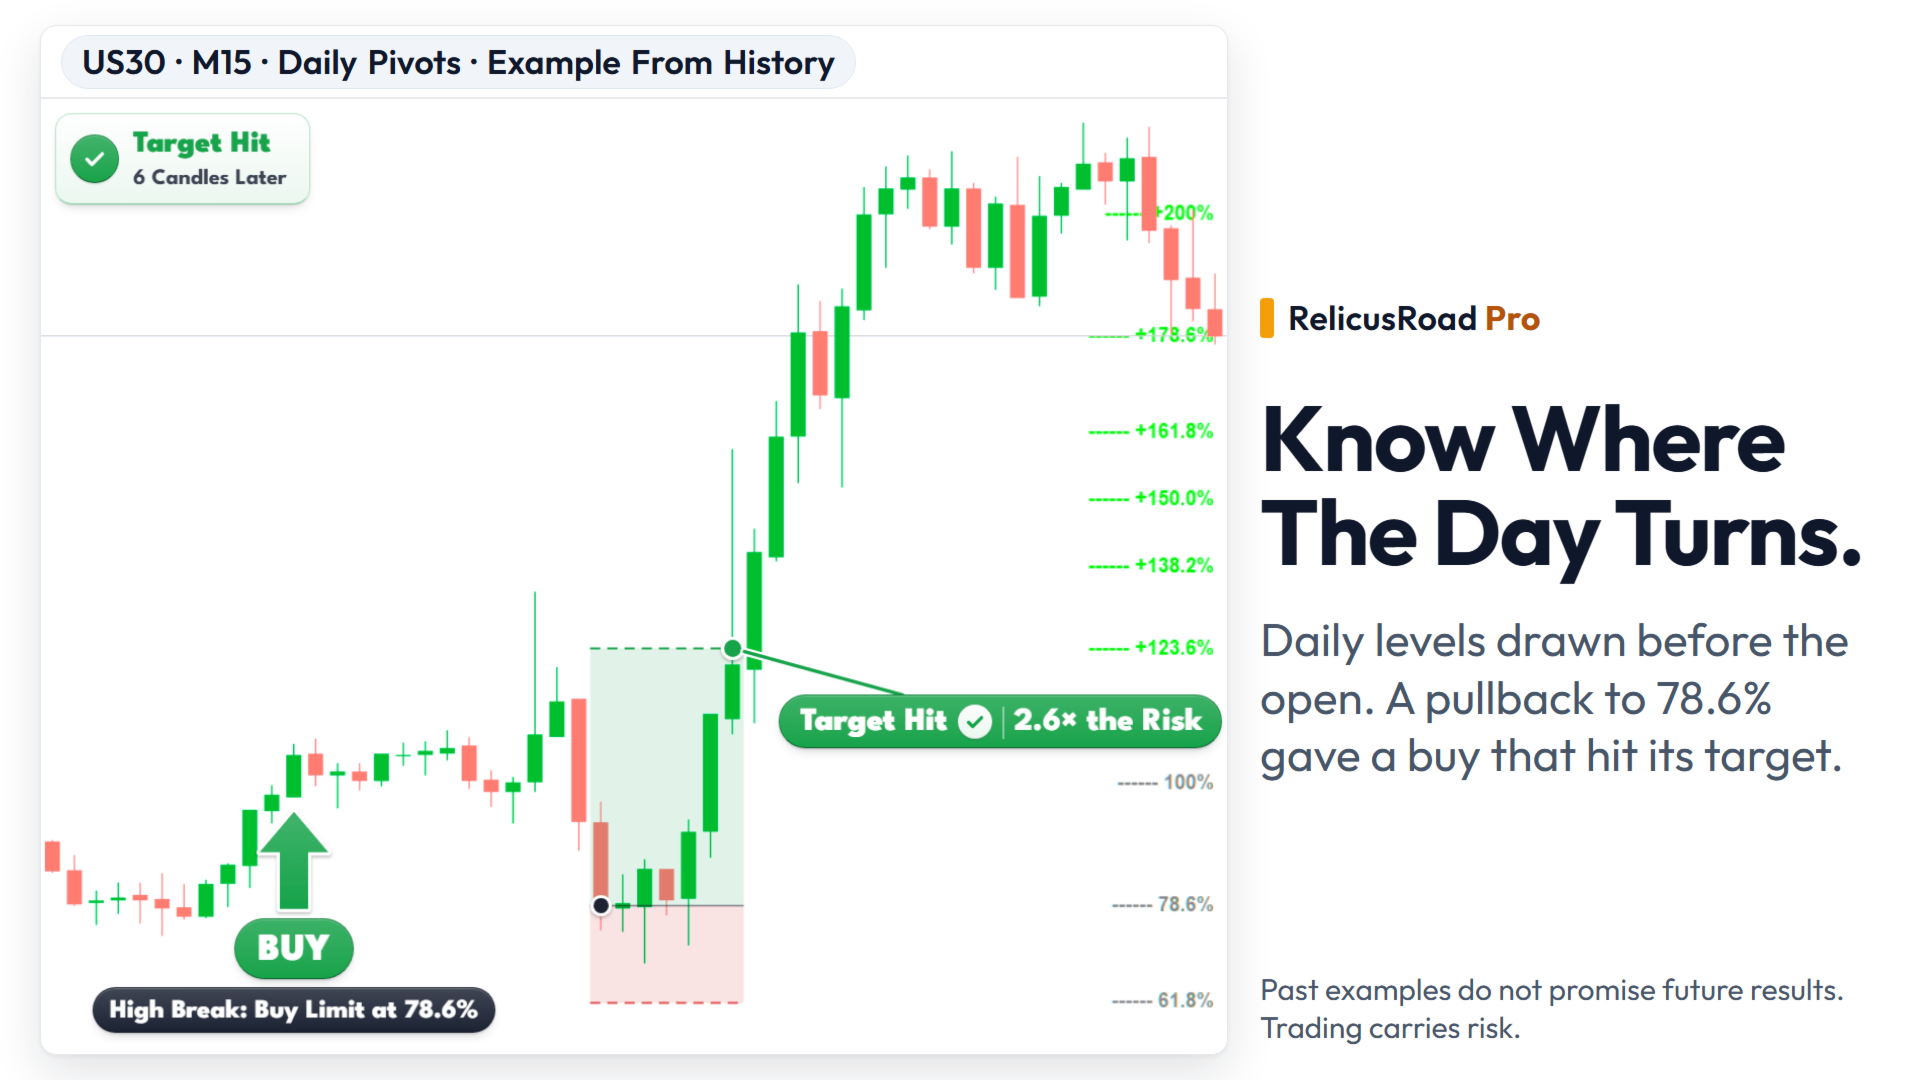
RelicusRoad Daily Pivots는 MetaTrader 4와 MetaTrader 5용 일간 피벗 포인트 지표로, 전일 범위를 Fibonacci 레벨로 나누고 마이너스 100퍼센트부터 플러스 200퍼센트까지 위아래로 연장합니다. 고전적인 floor pivot 대신, 직전에 완료된 범위를 저가가 0%, 고가가 100%인 척도로 다룹니다. 열아홉 개의 레벨이 차트 오른쪽 가장자리에 촘촘한 색상 마커로 표시되므로, 오늘 움직임의 크기를 전일 범위의 일부 또는 배수로 읽을 수 있습니다. 작동 방식 지표는 직전에 완료된 기준 기간의 고가와 저가를 가져와 그 범위의 각 비율마다 레벨을 배치합니다: level = low + ratio x (high - low). 주말 봉은 건너뛰므로 월요일의 기준은 마지막 거래일입니다. 기준 기간은 차트 시간대에서 정해집니다. 내부 구간, 회색: 0%, 23.6%, 38.2%, 50.0%, 61.8%, 78.6%, 100%. 상단 구간, 초록: +123
FREE
우리의 Basic Support and Resistance 표시기는 기술 분석을 향상시키는 데 필요한 솔루션입니다.이 표시기는 차트/ MT5 버전 특징 피보나치 수준의 통합 : 지원 및 저항 수준과 함께 피보나치 수준을 표시하는 옵션과 함께, 우리의 지표는 시장 행동과 가능한 역전 영역에 대한 더 깊은 통찰력을 제공합니다. 성능 최적화 : 각 막대의 개구부에서만 확장 라인을 업데이트하는 옵션을 사용하여, 우리의 지표는 지원 및 저항 수준의 정확도를 희생하지 않고 최적의 성능을 보장합니다. 입력 주요 설정 Timeframe:  이 입력을 통해 차트에 더 높은 기간의 지지선과 저항선을 표시하도록 선택할 수 있습니다. Support/Resistance Strength [Number of Bars]:  이 입력을 사용하면 지지대와 저항의 강도를 결정할 수 있습니다.숫자가 높을수록지지/저항이 더 강해집니다. Price mode: 이 매개 변수를 사용하면 지원 및 저항 수준을 계산하는
Nirvana prop controler MT4
Aiireza Arjmandi Nezhad
전문 트레이더와 평가형 계정(Prop)을 위한 위험 관리 및 한도 모니터링 지표 이 도구는 위험 관리와 한도에 관한 정보를 차트에 표시만 하여, 더 집중해서 의사결정을 내리도록 돕습니다. 인디케이터는 포지션을 열거나/닫거나/변경하지 않으며, 익스퍼트 어드바이저(EA)와도 충돌하지 않습니다. 기능 일일 및 총 드로우다운 모니터링 잔고(Balance) 또는 에쿼티(Equity)를 기준으로 일일/총 드로우다운을 계산·표시합니다(설정 가능). 설정된 한도까지 남은 비율을 표시합니다. 차트 내 깔끔하고 전문적인 패널 요약 표: Balance, Equity, 현재 P/L, 일일/총 DD, 경고 임계값. 의사결정에 집중할 수 있도록 간결하고 가독성 높은 UI. 위험 기반 포지션 사이징 퍼센트/고정 금액 리스크와 선택한 손절폭(SL)에 따라 대략적인 거래량을 산출. 위험대비보상비(R:R)와 진입, SL, TP 레벨을 차트에 표시. 경고와 알림 일일/총 DD 임계값에 근접 시 경고(임계값 퍼센트
The Arrow Scalper
Fawwaz Abdulmantaser Salim Albaker
1 (2)
Dear Friend..  I share with you this simple Expert Adviser .. it is full automatic  this Expert Adviser following the trend of the pair you install on or any stocks or indices , it is works like that: - when the trend on H4 chart show a start of up trend the expert will wait till the 15M & 1H charts show an up trend the EA will open a buy order directly , and do the same for down trend and open a sell order the buy or sell  order lot size and take profit and stop loss will measured manually  by
FREE
Binary Option Signal
Yaroslav Varankin
Indicator for binary options arrow is easy to use and does not require configuration works on all currency pairs, cryptocurrencies buy signal blue up arrow sell signal red down arrow tips do not trade during news and 15-30 minutes before their release, as the market is too volatile and there is a lot of noise it is worth entering trades one or two candles from the current period (recommended for 1 candle) timeframe up to m 15 recommended money management fixed lot or fixed percentage of the depo
Master Dow Jones MT4
Sergio Tiscar Ortega
Investment Philosophy Master Dow Jones EA   is a high-precision algorithmic trading system specifically engineered for the   Dow Jones Industrial Average (DJ30/US30) . Unlike generic trading systems, this algorithm exploits the structural bullish bias inherent in the top 30 U.S. blue-chip companies by operating exclusively on the   Long Side . This specialization significantly reduces exposure to erratic short-side volatility and aligns the strategy with long-term institutional capital flows. St
Gioteen Volatility Index (GVI)   - your ultimate solution to overcoming market unpredictability and maximizing trading opportunities. This revolutionary indicator helps you in lowering your losing trades due to choppy market movements. The GVI is designed to measure market volatility, providing you with valuable insights to identify the most favorable trading prospects. Its intuitive interface consists of a dynamic red line representing the volatility index, accompanied by blue line that indicat
Classic Fractals indicator for MT4, with additional Trendlines connecting the latest couples of fractals ( fractals are showing highest high, and lowest low on each period) Rules for trendlines: -if new top fractal is below the last one = new resistance line -if new bot fractal is above the last one = new support line -Trendlines can be hidden -Fractals can be hidden Fractal Period = can be both even or uneven number, as it is setting for half (one side) of the bars sequence for findin
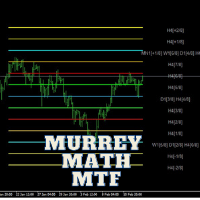
Murrey Math Multi Timeframe Indicator Support/Resistance  Murrey Math Lines are strong tools to plot the support and resistance levels. Murrey Math Multi Timeframe Indicator draws multi timeframe MM lines on a smaller tf chart. General Information: According to Gann, prices move in 1/8's, these 1/8's act as points of price support and resistance as an entity's price changes in time. Given this 1/8 characteristic of price action, Murrey assigns properties to each of the MML's in an a given oc
Diamond Trend
Segundo Calvo Munoz
Indicator which identifies Trend and also buy/sell opportunities. Use for entries aligned to the Trend.  Although Diamond Trend is very accurate identifying entry points, it is always recommended to use a support indicator in order to reconfirm the operation. Remind to look for those Assets and Timeframes which best fit to your trader behavior/need... Valid for Scalping and Long Term operations. Please, set up a Bars Chart to be able to visualize the indicator properly...  ...And remind to give
Stratos Pali
Michela Russo
4.43 (7)
Stratos Pali Indicator   is a revolutionary tool designed to enhance your trading strategy by accurately identifying market trends. This sophisticated indicator uses a unique algorithm to generate a complete histogram, which records when the trend is Long or Short. When a trend reversal occurs, an arrow appears, indicating the new direction of the trend. Important Information Revealed Leave a review and contact me via mql5 message to receive My Top 5 set files for Stratos Pali at no cost! Dow
Aurum Reversion Pro
Olaoluwa Oluwaseun Bamitale
Aurum Reversion Pro Aurum Reversion Pro is a professionally developed Expert Advisor designed for traders who want a structured, automated approach to trading Gold (XAUUSD) . Built with a strong focus on automation, flexibility and risk management, Aurum Reversion Pro combines intelligent trade management with configurable protection features to provide a streamlined trading experience. The EA is optimized for XAUUSD (Gold) and is recommended for the M15 (15-minute) timeframe . For best operatin
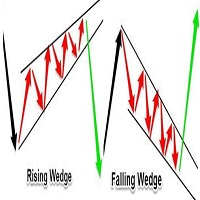
Automatic redrawing of Trend Supports and resistances levels and Possible Wedge pattern formation to indicate price breaking of Rising Wedge (signal SELL) or price breaking of falling Wedge (signal BUY) Very simple and smart indicator  ALERTS AND MOBILE NOTIFICATIONS availavle !!! you can edit the calculation bars of the bars count for formation of the trend lines and the initial shift from current price  Smaller values for bars /shift inputs when using Higher Time frames (D1-H4) and the reverse
This EA is an extension for the free trade indicator Trend Mate . https://www.mql5.com/en/market/product/50082 The main idea is to support your decision to  trade  according to the current trend. It is possible to configure alert and push notification to receive when entering to first candle for bull / bear trend. For this extension of the free indicator now it is possible to filter the current trend info with other timeframes. For example show trend for timeframe M5 considering also timeframe
이 제품의 구매자들이 또한 구매함
Miraculous Indicator Binary & Forex v3 StrategySafe Miraculous Indicator Binary & Forex v3 StrategySafe 는 명확한 신호, 강력한 확인 도구, 그리고 Binary 및 Forex 시장에서 사용할 수 있는 체계적인 거래 방식을 원하는 트레이더를 위한 전문 지표입니다. v3 버전에는 MIR Dashboard, Miraculous Confirmation Dashboard, GANN Law, Square of 9 레벨, GANN 각도, 그리고 더욱 강화된 Forex 모드가 포함되어 있습니다. 주요 기능 Binary 모드와 Forex 모드를 하나의 지표에서 지원. MIR Dashboard로 빠른 시장 흐름 확인. Miraculous Confirmation Dashboard로 진입 신호 확인. Forex 분석을 위한 GANN Law drawing lines. Square of 9 라인, 레벨, 방향 표시. 1x1 G
GoldRush Trend Arrow Signal
Kirk Lee Holloway
5 (2)
GoldRush 트렌드 화살표 신호 GoldRush 트렌드 화살표 신호 지표는 XAU/USD 시장에서 고속 단기 스캘핑 트레이더를 위해 설계된 정밀한 실시간 트렌드 분석을 제공합니다. 1분 시간대에 특화되어 설계된 이 도구는 명확한 진입점을 표시하는 방향성 화살표를 제공하여 스캘퍼들이 변동성이 높은 시장 환경에서도 자신 있게 거래할 수 있도록 합니다. 이 지표는 PRIMARY 및 SECONDARY 경고 화살표로 구성됩니다. PRIMARY 신호는 추세 방향의 변화를 나타내는 흰색과 검은색 방향성 화살표이며, SECONDARY 신호는 PRIMARY 화살표가 지시하는 방향을 확인하고 잠재적인 거래 진입점을 표시하는 파란색과 빨간색 화살표입니다. 참고: 추세 방향이 변경된 후 PRIMARY 경고 화살표가 단 하나만 표시될 경우, 다수의 SECONDARY 파란색/빨간색 화살표가 표시될 수 있음을 유의해야 합니다. SECONDARY 신호는 신호 기준을 충족하는 어떤 캔들 이후에도 표시
Super Signal – Skyblade Edition 전문가용 노리페인트 / 노래그 트렌드 신호 시스템, 뛰어난 승률 제공 | MT4 / MT5용 1분, 5분, 15분과 같은 낮은 타임프레임에서 가장 좋은 성능을 보입니다. 핵심 기능: Super Signal – Skyblade Edition은 추세 매매를 위해 설계된 스마트 신호 시스템입니다. 이 시스템은 다중 필터 로직을 활용하여, 명확한 방향성과 실질적인 모멘텀이 수반된 고품질 추세만을 감지합니다. 이 시스템은 고점 또는 저점을 예측하지 않으며 , 다음 세 가지 조건이 모두 충족될 때만 신호를 발생시킵니다: 명확한 추세 방향 강화되는 모멘텀 건전한 변동성 구조 또한, 시장 세션 기반의 유동성 분석을 통해 신호의 신뢰성과 타이밍을 더욱 향상시킵니다. 신호 특성: 모든 화살표 신호는 100% 리페인트 없음 / 지연 없음 신호가 한 번 발생하면 고정되며, 깜빡이거나 사라지지 않음 차트 상의 시각적 화살표, 정보 패널, 팝업 알
TrendMaestro
Stefano Frisetti
4 (4)
Attention: beware of SCAMS, TRENDMAESTRO is only ditributed throught MQL5.com market place. note: this indicator is for METATRADER4, if you want the version for METATRADER5 this is the link:  https://www.mql5.com/it/market/product/108106 TRENDMAESTRO ver 2.5 TRENDMAESTRO recognizes a new TREND from the start, he never makes mistakes. The certainty of identifying a new TREND is priceless. DESCRIPTION TRENDMAESTRO identifies a new TREND in the bud, this indicator examines the volatility, volumes a
There is always a need to measure if the market is "quiet" or it is volatile. One of the possible way is to use standard deviations, but the issue is simple : We do not have some levels that could help us find out if the market is in a state of lower or higher volatility. This indicator is attempting to do that : •           values above level 0 are indicating state of higher volatility (=GREEN buffer) •           values below level 0 are indicating state of lower volatility (=RED buffer)
IQ FX Gann Levels
INTRAQUOTES
5 (3)
IQ FX Gann Levels a precision trading indicator based on W.D. Gann’s square root methods . It plots real-time, non-repainting support and resistance levels to help traders confidently spot intraday and scalping opportunities with high accuracy. William Delbert Gann (W.D. Gann) was an exceptional market analyst, whose trading technique was based on a complex blend of mathematics, geometry, astrology, and ancient mathematics which proved to be extremely accurate. We don't offer free or bonus indic
ORB Seeker
Marcela Goncalves De Oliveira
4 (1)
한정 수량 판매 및 제품 희소성 유지를 위한 특별 가격입니다! 단돈 599달러! 구매 후 저에게 연락 주시면 보너스 ORB Seeker EA와 개인 최적화 설정 파일을 보내드립니다. 깔끔한 세션 브레이크아웃을 자신감 있게 활용하세요! ORB Seeker는 정확성, 단순성, 유연성 및 명확한 차트 구조를 원하는 트레이더를 위해 개발된 전문적인 시가 범위 돌파(ORB) 지표입니다. 이 프로그램은 모든 금융 상품에 대해 장전 거래 또는 사용자 지정 세션 범위를 자동으로 표시하고, 진입, 손절매, 목표 수익 및 선택적으로 50% 부분 목표 수익 수준을 포함한 명확한 돌파 신호를 제공합니다. 모든 계산은 실시간으로 차트에 직접 표시됩니다. 런던 개장, 뉴욕 세션, 아시아 세션 또는 사용자 지정 시장 시간대를 선택하여 거래하세요. ORB Seeker는 사용자가 선택한 세션 시간에 맞춰 작동하므로 시장 범위, 돌파 수준 및 거래 레벨을 정확하게 확인할 수 있습니다. 모든 구매 시 ORB Se
Gold Channel XAUUSD
Paulo Rocha
5 (4)
Gold Channel is a volatility-based indicator, developed with a specific timing algorithm for the XAUUSD pair, which consists of finding possible corrections in the market. This indicator shows two outer lines, an inner line (retracement line) and an arrow sign, where the theory of the channel is to help identify overbought and oversold conditions in the market. The market price will generally fall between the boundaries of the channel. If prices touch or move outside the channel it is a tradi
OrderFlow Absorption – MT4용 전문 델타 & 흡수 신호 인디케이터 OrderFlow Absorption으로 진정한 오더플로우 분석의 힘을 경험하세요. MetaTrader 4를 위한 궁극의 델타 히스토그램 및 흡수 신호 인디케이터입니다. 가격 움직임의 이면에서 실제로 무슨 일이 일어나는지 알고 싶은 트레이더를 위해 설계된 이 도구는, 시장을 움직이는 숨겨진 매수/매도 압력과 흡수 이벤트를 드러냅니다. 주요 기능 델타 히스토그램 시각화:   매수와 매도 압력을 색상별 히스토그램으로 즉시 확인할 수 있습니다. 흡수 신호 감지:   고급 로직으로 강세 및 약세 흡수 이벤트를 식별하여 반전 신호를 미리 알려줍니다. 차트 마커:   흡수 신호가 차트에 직접 표시되어 시각적으로 쉽게 확인할 수 있습니다. 팝업 알림:   새로운 흡수 신호가 발생하면 실시간으로 알림을 받을 수 있습니다. 사용자 지정 임계값:   약한 신호는 필터링하고, 확률이 높은 기회에 집중할 수 있습니다.
Meravith
Ivan Stefanov
5 (3)
마켓 메이커를 위한 도구. Meravith는 다음과 같은 기능을 제공합니다: 모든 타임프레임을 분석하고 현재 유효한 추세를 표시합니다. 강세와 약세 거래량이 동일한 유동성 구간(거래량 균형 구간)을 강조 표시합니다. 서로 다른 타임프레임의 모든 유동성 레벨을 차트에 직접 표시합니다. 텍스트 기반 시장 분석을 생성하여 참고용으로 제공합니다. 현재 추세를 기반으로 목표가, 지지선 및 손절가를 계산합니다. 거래의 위험 대비 보상 비율(Risk/Reward)을 계산합니다. 계좌 잔고에 따라 포지션 크기를 산출하고 잠재 수익을 추정합니다. 시장에 중대한 변화가 발생할 경우 경고도 제공합니다. 지표의 주요 라인: 강세/약세 거래량 소진 라인 — 목표가로 사용됩니다. 시장 추세를 나타내는 라인. 시장이 강세인지 약세인지에 따라 색상이 변경되며 추세 지지선 역할을 합니다. 색상은 주로 시장 심리를 보여줍니다. 거래량 균형선(Eq). Eq(Volume Equilibrium) 라인은 시스템의 핵심입니
Linear Trend Predictor - 진입 지점과 방향성 지원선을 결합한 추세 지표입니다. 고가/저가 채널을 돌파하는 원칙에 따라 작동합니다. 지표 알고리즘은 시장 노이즈를 걸러내고 변동성과 시장 역학을 고려합니다. 표시기 기능  평활화 방법을 사용하여 시장 추세와 BUY 또는 SELL 주문을 시작하기 위한 진입 시점을 보여줍니다.  모든 기간의 차트를 분석하여 단기 및 장기 시장 움직임을 파악하는 데 적합합니다.  어떠한 시장과 시간대에도 적용할 수 있으며, 입력 매개변수를 통해 거래자는 자신에게 맞게 지표를 독립적으로 사용자 지정할 수 있습니다.  설정된 지표 신호는 사라지거나 다시 그려지지 않습니다. 이는 캔들 마감 시 결정됩니다.  여러 유형의 알림이 화살표와 결합되어 있습니다.  이 지표는 독립적인 거래 시스템으로 사용할 수도 있고, 다른 거래 시스템에 추가하는 용도로도 사용할 수 있습니다.  모든 수준의 경험을 가진 거래자가 사용할 수 있습니다. 주요 매
Binary Booster
Yaroslav Varankin
5 (1)
Binary Options Trading Indicator: A Reliable Tool for Your Trades This indicator is specifically designed for binary options trading and has proven its high quality, reliability, and adequate accuracy, depending on the dynamics of the chart. Key Points: Signal Interpretation: When a blue cross signal appears, it indicates a potential entry into a trade, though it is considered a weak signal on its own. However, if the blue cross is accompanied by an arrow, it is considered a more reliable buy s
MagicTrigger MT4
Mostafa Ghanbari
MagicTrigger — 멀티 타임프레임 HD/RD 다이버전스 확인 인디케이터 MagicTrigger는 상위 타임프레임(HD)에서 구조적 다이버전스를 찾고, 동일한 가격대 내 하위 타임프레임(RD)에서 일치하는 다이버전스로 확인되기를 기다리는 멀티 타임프레임 다이버전스 엔진입니다. 상위 타임프레임의 스윙 구조와 하위 타임프레임의 확인이 일치할 때만 인디케이터는 신호를 표시하며, 이와 함께 권장 진입 트리거, 손절 라인, 두 개의 목표 라인을 제공합니다. 작동 방식 인디케이터는 현재 차트 기간을 기준으로 상위 및 하위 타임프레임의 체인을 스캔합니다. 상위 타임프레임에서는 가격 스윙과 평활화된 오실레이터 라인 사이의 다이버전스 패턴("HD" 다이버전스)을 찾습니다. 이후 HD 구조로 정의된 시간 및 가격대 내에서 하위 타임프레임에서도 동일한 방향의 다이버전스("RD" 다이버전스)가 나타나는지 확인합니다. 신호는 필요한 최소 개수의 하위 타임프레임이 상위 타임프레임 구조를 확인했을 때만
Enigmera
Ivan Stefanov
5 (9)
ENIGMERA: 시장의 핵심 중요: MQL5.com의 데모는 Strategy Tester에서 실행되며 Enigmera의 기능을 완전히 반영하지 못할 수 있습니다. 설명, 스크린샷 및 비디오를 확인하여 자세한 내용을 확인하십시오. 질문이 있으면 언제든지 메시지를 보내주세요! 인디케이터의 코드는 완전히 다시 작성되었습니다. 버전 3.0은 새로운 기능을 추가하고 인디케이터가 처음 출시된 이후 누적된 버그를 수정했습니다. 소개 이 인디케이터 및 거래 시스템은 금융 시장에 대한 주목할 만한 접근 방식입니다. ENIGMERA는 프랙탈 주기를 사용하여 정확하게 지원 및 저항 수준을 계산합니다. 실제 축적 단계를 보여주고 방향과 목표를 제공합니다. 트렌드와 수정 모두에서 작동하는 시스템입니다. 작동 방식 인디케이터의 대부분의 기능은 차트 왼쪽에 있는 버튼을 통해 제어되며, 이를 통해 다양한 시장 상황에 빠르게 대응할 수 있습니다. 버튼 ON/OFF – 인디케이터 전체를 표시하거나 숨깁니다.
First time on MetaTrader, introducing IQ Star Lines - an original Vedic Astrology based indicator. "Millionaires don't use astrology, billionaires do" . - J.P. Morgan, Legendary American financier and banker. We don't offer free or bonus indicators in exchange of reviews from you. You won't need any free products with this indicator to make it work. ;) Enjoy! Welcome to  the new and updated  IQ Star Lines , the ultimate fusion of ancient planetary harmonic cycles and modern quantitative trading.
ATC AlgoZone Indicator
Ameur Boudenne
5 (2)
Algo Trading Indicaor  With this indicator , you’ll have zones and trends that hight probability the price will reverse from it. so will gives you all the help that you need  MT5 Version                    https://www.mql5.com/en/market/product/170028 MT4 Version                    https://www.mql5.com/en/market/product/88034 Why should you join us !?  1-This indicator is logical since it’s working in previous days movement , to predict the future movements. 2-Algo trading indicator will hel
CVD 다이버전스 검출 - 고급 볼륨 델타 분석   우리가 해결하는 문제 대부분의 트레이더들은 가격 움직임에만 의존하여 진정한 시장 심리를 드러내는 중요한 볼륨 플로우 정보를 놓치고 있습니다. 전통적인 지표는 가격 움직임에 뒤처져 늦은 진입과 나쁜 리스크 관리를 유발합니다. CVD 다이버전스 검출은 가격과 볼륨 델타 모멘텀 간의 관계를 분석하여 이를 해결하고, 주요 시장 움직임 전에 조기 경고 신호를 제공합니다.   CVD 다이버전스 분석의 장점   조기 시장 반전 검출   - 가격 차트에 나타나기 전에 모멘텀 변화를 발견   스마트 머니 추적   - 기관투자자들이 언제 축적하거나 분산하는지 확인   거짓 신호 감소   - 볼륨이 가격 움직임을 확인하여 더 높은 확률의 세팅 제공   멀티 타임프레임 우위   - 스캘핑부터 스윙 트레이딩까지 모든 시간대에서 작동   범용 적용   - 외환, 주식, 원자재, 암호화폐와 호환   4가지 시장 단계 - 실제
Pair Trading Station MT4
Young Ho Seo
3.67 (3)
How to use Pair Trading Station Pair Trading Station is recommended for H1 time frame and you can use it for any currency pairs. To generate buy and sell signal, follow few steps below to apply Pair Trading Station to your MetaTrader terminal. When you load Pair Trading Station on your chart, Pair Trading station will assess available historical data in your MetaTrader platforms for each currency pair. On your chart, the amount of historical data available will be displayed for each currency pai
FFx Engulfing Setup Alerter gives trade suggestions with Entry, Target 1, Target 2 and StopLoss. Below are the different options available: Entry suggestion - pips to be added over the break for the entry 3 different options to calculate the SL - by pips, by ATR multiplier or at the pattern High/Low 3 different options to calculate the 2 TPs - by pips, by ATR multiplier or at Risk/Reward Offset the dashboard - any place on the chart Remove the suggestion once the price reached the SL line Lines
FFx InsideBar Setup Alerter gives trade suggestions with Entry, Target 1, Target 2 and StopLoss. Below are the different options available: Entry suggestion - pips to be added over the break for the entry Minimum candle size - to avoid too close buy/sell entry suggestions 3 different options to calculate the SL - by pips, by ATR multiplier or at the pattern High/Low 3 different options to calculate the 2 TPs - by pips, by ATR multiplier or at Risk/Reward Offset the dashboard - any place on the c
FFx OutsideBar Setup Alerter gives trade suggestions with Entry, Target 1, Target 2 and StopLoss. Below are the different options available: Entry suggestion - pips to be added over the break for the entry. 3 different options to calculate the SL - by pips, by ATR multiplier or at the pattern High/Low. 3 different options to calculate the 2 TPs - by pips, by ATR multiplier or at Risk/Reward. Offset the dashboard - any place on the chart. Remove the suggestion once the price reached the SL line.
FFx PinBar Setup Alerter gives trade suggestions with Entry, Target 1, Target 2 and StopLoss. Below are the different options available: Entry suggestion - pips to be added over the break for the entry Minimum candle size - to avoid too small candles 3 different options to calculate the SL - by pips, by ATR multiplier or at the pattern High/Low 3 different options to calculate the 2 TPs - by pips, by ATR multiplier or at Risk/Reward Offset the dashboard - any place on the chart Remove the sugges
Lineverse Trendlines
Arkady Segal
5 (1)
Automatic, live & interactive picture of all trendlines. Assign push, email and sound alerts to the lines of your choice and be informed about price rollback, breakout, rollback after breakout, number of rollbacks, line expiration by double breakout. Correct, drag or delete the lines and interactively tune the line system. https://youtu.be/EJUo9pYiHFA . Chart examples https: //www.mql5.com/en/users/efficientforex Price Interaction Events All events are effective immediately and only after one
FFx MACD Divergences
Eric Venturi-Bloxs
The purpose of this new version of the MT4 standard indicator provided in your platform is to display in a sub-window multiple timeframes of the same indicator with its divergences. See the example shown in the picture below. But the display isn't like a simple MTF indicator. This is the real display of the indicator on its timeframe. Here's the options available in the FFx divergences indicator: Select the timeframes to be displayed (M1 to Monthly) Define the width (number of bars) for each tim
FFx RSI Divergences
Eric Venturi-Bloxs
The purpose of this new version of the MT4 standard indicator provided in your platform is to display in a sub-window multiple timeframes of the same indicator with its divergences. See the example shown in the picture below. But the display isn't like a simple MTF indicator. This is the real display of the indicator on its timeframe. Here's the options available in the FFx divergences indicator: Select the timeframes to be displayed (M1 to Monthly) Define the width (number of bars) for each tim
FFx CCI Divergences
Eric Venturi-Bloxs
The purpose of this new version of the MT4 standard indicator provided in your platform is to display in a sub-window multiple timeframes of the same indicator with its divergences. See the example shown in the picture below. But the display isn't like a simple MTF indicator. This is the real display of the indicator on its timeframe. Here's the options available in the FFx divergences indicator: Select the timeframes to be displayed (M1 to Monthly). Define the width (number of bars) for each ti
The FFx Dashboard MTF alerter will show you on a single chart all the timeframes (M1 to Monthly) with their own status for the indicator. 2 Alert Options: Single timeframe: each selected timeframe alert separately when a signal occurs Multi timeframes: all selected timeframes must agree for an alert to be triggered Both options have an input to select the timeframes to be used for the alert(s). How to Understand the Status: Green/Red square: histogram above/below 0 line Green square + Red bord
The FFx Dashboard MTF alerter will show you on a single chart all the timeframes (M1 to Monthly) with their own status for the indicator. 2 Alert Options: Single timeframe: each selected timeframe alert separately when a signal occurs Multi timeframes: all selected timeframes must agree for an alert to be triggered Both options have an input to select the timeframes to be used for the alert(s). How to understand the status: Green/Red square: RSI above/below 50 line Green square + Red border: R
제작자의 제품 더 보기
RelicusRoad Pro MT5
Relicus LLC
4.96 (25)
거래를 더 이상 감으로 하지 마세요. 언제 진입할지, 어디서 청산할지, 시장이 어느 쪽으로 기울어 있는지를 한 차트에서 확인하세요. RelicusRoad Pro는 20개 가까운 도구를 인디케이터 하나에 담았고, 내 매매 방식에 맞는 도구만 켜서 쓰면 됩니다. 명확한 진입. 명확한 청산. 차트마다 확실한 계획. 이런 경험, 익숙하지 않으신가요? 매수하면 1분 뒤 가격이 반대로 돌아섭니다. 너무 일찍 청산하고, 그다음 움직임이 나 없이 이어지는 것을 지켜봅니다. 지표를 5개 띄우면 답도 5가지가 나옵니다. 손절(스톱로스)은 그냥 감입니다. 우리가 이걸 만든 이유 우리는 18년 동안 외환 거래를 해 왔습니다. RelicusRoad는 처음에 우리끼리 쓰려고, 전문 트레이더 모임을 위해 비공개로 만들었습니다. 이유는 개인적이었습니다. 같은 선을 손으로 계속 그리는 일에 지쳤고, 스스로 정한 규칙을 어기고, 차트에서 정말 중요한 한 가지를 놓치곤 했습니다. 우리에게 통한 것은 일관성입니다. 매
RelicusRoad MACD v2 MT5
Relicus LLC
4.78 (23)
이동 평균 수렴 발산(MACD) 거래 전략은 추세와 흐름 방향의 변화를 식별하는 데 사용되는 인기 있는 기술 분석 도구입니다. MACD는 12기간의 지수 이동 평균(EMA)에서 26기간의 EMA를 빼서 계산됩니다. "신호 선"이라고 불리는 9기간의 EMA는 MACD 위에 표시되어 매수 및 매도 신호를 트리거로 작용합니다. MACD 선이 신호 선 위에 있으면 매수 트렌드로 간주되고, 신호 선 아래에 있으면 매도 트렌드로 간주됩니다. 거래자들은 종종 이 정보를 사용하여 잠재적인 매수 및 매도 기회를 파악합니다. MACD는 다양한 방식으로 사용될 수 있는 다재다능한 지표입니다. 일반적으로 사용되는 몇 가지 방법은 다음과 같습니다. 교차: MACD 선이 신호 선 위로 크로스되면 매수 교차가 발생하고, MACD 선이 신호 선 아래로 크로스되면 매도 교차가 발생합니다. 발산: MACD가 새로운 고점을 형성하면서 기초 자산이 그렇지 않은 경우 매수 발산이 발생하고, MACD가 새로운 저점을 형성
FREE
RelicusRoad MACD v2
Relicus LLC
4.67 (6)
이동 평균 수렴 발산(MACD) 거래 전략은 추세와 흐름 방향의 변화를 식별하는 데 사용되는 인기 있는 기술 분석 도구입니다. MACD는 12기간의 지수 이동 평균(EMA)에서 26기간의 EMA를 빼서 계산됩니다. "신호 선"이라고 불리는 9기간의 EMA는 MACD 위에 표시되어 매수 및 매도 신호를 트리거로 작용합니다. MACD 선이 신호 선 위에 있으면 매수 트렌드로 간주되고, 신호 선 아래에 있으면 매도 트렌드로 간주됩니다. 거래자들은 종종 이 정보를 사용하여 잠재적인 매수 및 매도 기회를 파악합니다. MACD는 다양한 방식으로 사용될 수 있는 다재다능한 지표입니다. 일반적으로 사용되는 몇 가지 방법은 다음과 같습니다. 교차: MACD 선이 신호 선 위로 크로스되면 매수 교차가 발생하고, MACD 선이 신호 선 아래로 크로스되면 매도 교차가 발생합니다. 발산: MACD가 새로운 고점을 형성하면서 기초 자산이 그렇지 않은 경우 매수 발산이 발생하고, MACD가 새로운 저점을 형성
FREE
RelicusRoad Signal Line은 MetaTrader 4와 MetaTrader 5용 추세 필터 지표로, 두 개의 이동평균선을 그리고 선택한 전략 필터에 따라 각 봉을 초록, 연어색 또는 회색으로 표시합니다. 선은 평균의 위치를 보여주고, 색은 선택한 필터가 그 봉을 어떻게 판단하는지를 보여줍니다. 기본값으로 Line 1은 Momentum으로 색이 정해지는 빠른 KAMA 9이고, Line 2는 Ichimoku로 색이 정해지는 느린 Hull 이동평균 200입니다. 작동 방식 각 선은 설정한 평균 유형과 기간으로 종가에서 계산됩니다. 그 아래에는 항상 회색 선이 함께 그려집니다. 선택한 필터가 상승으로 판단한 봉에서는 그 위에 초록색 구간이 그려지고, 하락으로 판단한 봉에서는 연어색 구간이 그려집니다. 필터가 판단을 내리지 못한 봉에서는 회색 선이 그대로 보입니다. 두 선은 각각 자신의 평균과 자신의 필터를 가집니다. Momentum: 직전 마감 봉의 5기간 momentum을
FREE
RelicusRoad SuperTrend는 MetaTrader 4와 MetaTrader 5용 SuperTrend 지표로, 상승 추세에서는 가격 아래에, 하락 추세에서는 가격 위에 ATR 기반의 추종선을 그립니다. 고전적인 SuperTrend 계산 그대로이며 아무것도 덧붙이지 않았습니다. 상승 쪽 선 하나, 하락 쪽 선 하나뿐이며 화살표, 라벨, 패널은 없습니다. 작동 방식 모든 봉에서 지표는 median price, 즉 봉의 고가와 저가의 중간값을 구하고 그 위아래로 선택한 개수만큼의 Average True Range(ATR) 단위로 밴드를 설정합니다. 종가가 이전 봉의 upper band 위에서 마감되면 추세가 위로 바뀌고, 이전 봉의 lower band 아래에서 마감되면 추세가 아래로 바뀝니다. 이 두 사건 사이에는 추세 방향이 바뀌지 않습니다. Uptrend: lower band가 기본값 초록으로 가격 아래에 그려짐. Downtrend: upper band가 기본값 golden
FREE
RelicusRoad Daily High Low는 MetaTrader 4와 MetaTrader 5용 전일 고가·저가 지표로, 장중 차트의 모든 봉에 전일 고가와 저가, 그리고 금일 시가를 표시합니다. 세 레벨은 색이 있는 점 계열로 그려지며 새 기간이 시작될 때마다 새 값으로 이동하고, 각 기간의 끝에는 High, Low, Open이라는 작은 태그가 붙습니다. H1부터 H4까지의 차트에서는 같은 마커가 지난주의 범위와 이번 주의 시가를 대신 보여주며, D1에서는 월 단위 값을 보여줍니다. 작동 방식 차트의 각 봉에 대해 지표는 그 봉이 속한 기준 기간을 찾습니다. High와 Low 마커는 그 이전 기간의 고가와 저가를 가져오고, Open 마커는 그 봉이 속한 기간의 시가를 가져옵니다. 기준 기간은 직접 선택하지 않는 한 차트 시간대를 따릅니다. H1 미만: 일간 기준: 전일 고가와 저가, 금일 시가. H1~H4: 주간 기준: 전주 고가와 저가, 금주 시가. D1: 월간 기준: 전월
FREE
RelicusRoad Multi Timeframe Trendbar는 MetaTrader 4와 MetaTrader 5용 멀티 타임프레임 추세 지표로, M1부터 MN1까지 아홉 개 시간대의 Uptrend, Neutral, Downtrend 상태를 차트 모서리에 색이 있는 점들의 행으로 보여줍니다. 각 시간대는 이름이 위에 붙은 점 하나를 차트 오른쪽 아래 모서리에 갖습니다. 색이 상태를 알려주므로 차트를 바꾸지 않고도 어떤 시간대들이 일치하는지 볼 수 있습니다. 작동 방식 각 시간대에 대해 지표는 그 시간대의 현재 봉에서 두 개의 표준 도구를 비교합니다. step 0.02, maximum 0.2의 Parabolic SAR와 period 14의 ADX의 +DI, -DI 선입니다. 방향이 표시되려면 둘이 일치해야 합니다: Uptrend: Parabolic SAR가 종가 아래에 있고 +DI가 -DI 위에 있음, 기본값 lime. Downtrend: Parabolic SAR가 종가 위에 있고
FREE
RelicusRoad Daily High Low는 MetaTrader 4와 MetaTrader 5용 전일 고가·저가 지표로, 장중 차트의 모든 봉에 전일 고가와 저가, 그리고 금일 시가를 표시합니다. 세 레벨은 색이 있는 점 계열로 그려지며 새 기간이 시작될 때마다 새 값으로 이동하고, 각 기간의 끝에는 High, Low, Open이라는 작은 태그가 붙습니다. H1부터 H4까지의 차트에서는 같은 마커가 지난주의 범위와 이번 주의 시가를 대신 보여주며, D1에서는 월 단위 값을 보여줍니다. 작동 방식 차트의 각 봉에 대해 지표는 그 봉이 속한 기준 기간을 찾습니다. High와 Low 마커는 그 이전 기간의 고가와 저가를 가져오고, Open 마커는 그 봉이 속한 기간의 시가를 가져옵니다. 기준 기간은 직접 선택하지 않는 한 차트 시간대를 따릅니다. H1 미만: 일간 기준: 전일 고가와 저가, 금일 시가. H1~H4: 주간 기준: 전주 고가와 저가, 금주 시가. D1: 월간 기준: 전월
FREE
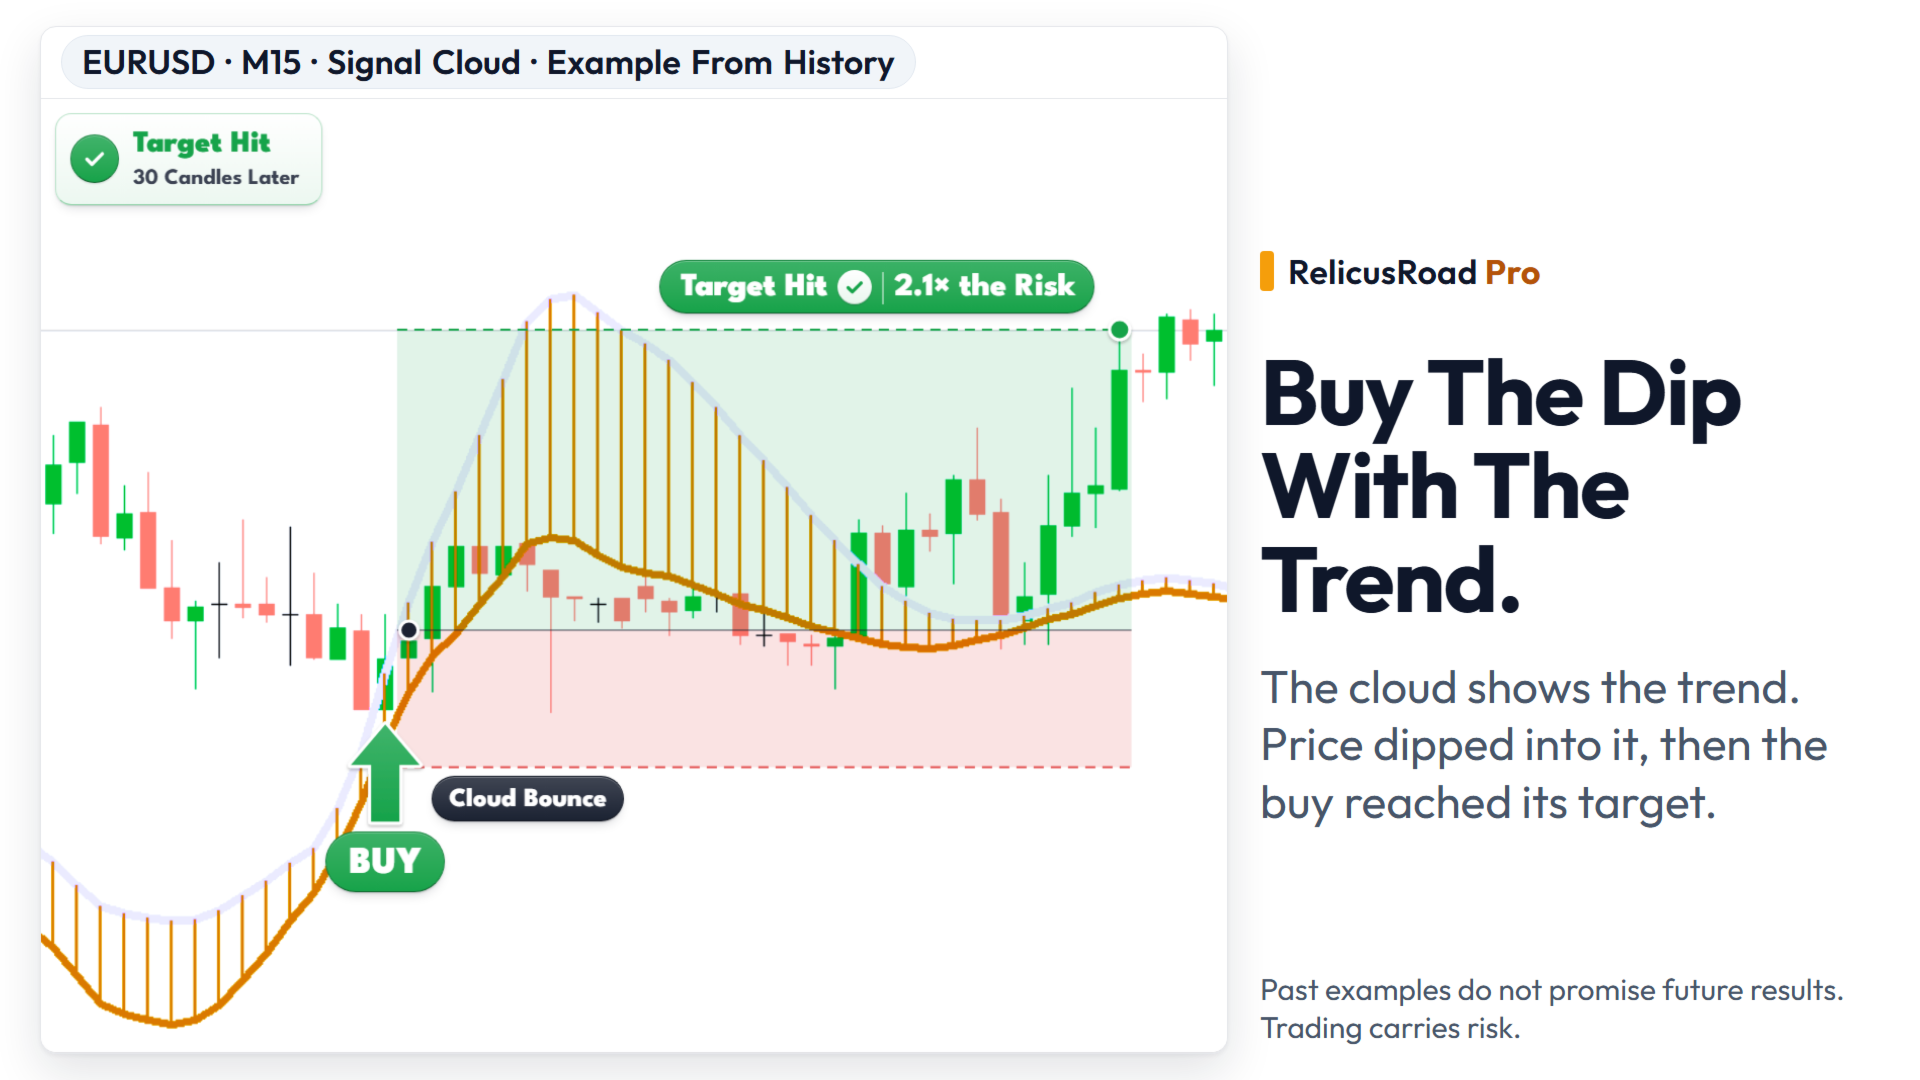
RelicusRoad Signal Cloud는 MetaTrader 4와 MetaTrader 5용 구름 지표로, 12기간과 26기간 EMA의 간격에 따라 크기가 정해지는 가격 밴드를 21봉 앞서 투영합니다. 밴드는 종가의 3기간 EMA를 중심으로 하며, 가장자리가 완만하게 움직이도록 평활화됩니다. 앞쪽으로 이동되어 있으므로 구름의 일부는 항상 마지막 봉의 오른쪽에 위치하며, 가격은 나중에 먼저 그려졌던 구간에 도달합니다. 작동 방식 각 봉마다 지표는 종가의 12기간과 26기간 지수이동평균 사이의 절대 간격을 측정하며, 이는 MACD 선이 보여주는 것과 같은 거리입니다. 이 간격이 밴드 폭의 절반이 되어, 종가의 3기간 EMA에 더하면 상단 경계, 빼면 하단 경계가 됩니다. 두 경계는 9기간 단순이동평균으로 평활화된 뒤 오른쪽으로 21봉 이동해 그려집니다. Width: EMA 12와 EMA 26 사이의 거리. Center: 종가의 3기간 EMA, 이 빌드에서 고정됨. Smoothing:
FREE
RelicusRoad SuperTrend는 MetaTrader 4와 MetaTrader 5용 SuperTrend 지표로, 상승 추세에서는 가격 아래에, 하락 추세에서는 가격 위에 ATR 기반의 추종선을 그립니다. 고전적인 SuperTrend 계산 그대로이며 아무것도 덧붙이지 않았습니다. 상승 쪽 선 하나, 하락 쪽 선 하나뿐이며 화살표, 라벨, 패널은 없습니다. 작동 방식 모든 봉에서 지표는 median price, 즉 봉의 고가와 저가의 중간값을 구하고 그 위아래로 선택한 개수만큼의 Average True Range(ATR) 단위로 밴드를 설정합니다. 종가가 이전 봉의 upper band 위에서 마감되면 추세가 위로 바뀌고, 이전 봉의 lower band 아래에서 마감되면 추세가 아래로 바뀝니다. 이 두 사건 사이에는 추세 방향이 바뀌지 않습니다. Uptrend: lower band가 기본값 초록으로 가격 아래에 그려짐. Downtrend: upper band가 기본값 golden
FREE
RelicusRoad CopyTrader 는 MetaTrader 5 용 무료 트레이드 카피어( trade copier )입니다. 같은 컴퓨터에 있는 MT5 터미널 간에 거래를 복사하므로, 하나의 계좌로 매매하고 나머지 계좌들이 각자의 크기와 리스크로 이를 따라가게 할 수 있습니다. 완전판이며, 기능 제한이나 체험 기간이 없습니다. 한 계좌로 매매하고, 나머지는 따라오게 하세요. MetaTrader 4: RelicusRoad CopyTrader MT4 작동 방식 하나의 터미널이 리더 (Leader, 마스터)로 동작하며 보유 중인 주문을 공유합니다. 원하는 수의 터미널이 팔로워 (Follower, 슬레이브)로 동작하며 이를 그대로 복제합니다. 터미널은 채널 이름으로 짝지어지므로, 한 대의 컴퓨터에서 여러 개의 독립된 복사 그룹을 동시에 운영할 수 있습니다. 복사는 200밀리초 타이머로 실행되므로, 팔로워는 자신의 차트에 틱이 들어오는 것을 기다리지 않고도 새 주문에 반응합니다. 설정 방
FREE
RelicusRoad Multi Timeframe Levels는 MetaTrader 4와 MetaTrader 5용 멀티 타임프레임 지지·저항 지표로, H1, H4, D1, W1, MN1의 최신 스윙 고점과 스윙 저점을 현재 거래 중인 차트에 수평선으로 그립니다. 이 다섯 시간대는 각각 저항선 하나와 지지선 하나를 제공하므로, 장중 차트에는 최대 열 개의 선이 표시될 수 있습니다. 모든 선은 나온 시간대에 따라 색이 정해지므로, 차트를 바꾸지 않고도 상위 시간대의 스윙을 계속 볼 수 있습니다. 작동 방식 고정된 시간대 집합의 각 시간대에 대해 지표는 가장 최근 봉에서부터 거슬러 올라가며 최신 5봉 프랙탈, 즉 양옆 두 봉이 넘어서지 않는 고가를 가진 봉을 찾습니다. 그 고가가 해당 시간대의 저항선이 되고, 저가에 같은 검사를 하면 지지선이 나옵니다. 시간대는 차트 시간대와 같거나 그보다 높을 때만 사용되므로, 표시되는 집합은 차트에 따라 달라집니다: M1, M5, M15, M30 차트
FREE
RelicusRoad Trading Sessions는 MetaTrader 4와 MetaTrader 5용 거래 세션 지표로, M1, M5, M15 차트에서 Tokyo, London, New York 세션의 시작 시각을 점선 수직선으로 표시합니다. 각 세션의 시작은 오늘과 이전 평일들에 걸쳐, 해당 세션의 색으로 선, 작게 회전된 이름 라벨, 이벤트 마커로 표시됩니다. 마우스를 올리면 세션 이름과 시작 시각이 보입니다. 이 지표는 시작 시각만 표시하며 세션 범위, 겹침, 종료 시각은 음영으로 표시하지 않습니다. 작동 방식 지표는 로드될 때 브로커 서버 시간과 UTC 사이의 차이를 읽어 정시 단위로 반올림한 뒤 한 시간을 뺍니다. 그런 다음 현재 UTC 날짜에서 거슬러 올라가는 각 평일에 대해, 서버 시간으로 환산한 Tokyo 시작(23:00 UTC), London 시작(07:00 UTC), New York 시작(12:00 UTC)을 배치합니다. 토요일과 일요일은 건너뜁니다. Tokyo:
FREE
RelicusRoad Fractals는 MetaTrader 4와 MetaTrader 5용 fractal 지표로, 양옆 7봉을 기준으로 하는 Fast 검사와 양옆 15봉을 기준으로 하는 Slow 검사로 두 가지 강도의 스윙 고점과 저점을 표시합니다. 양옆 7봉 창만으로도 이미 많은 작은 흔들림이 걸러지며, Slow 검사는 그 두 배가 넘는 조건을 요구하므로 더 굵은 화살표가 훨씬 넓은 구간에서 유지된 스윙만 골라냅니다. 두 강도가 함께 표시되므로 작은 스윙과 큰 스윙을 한눈에 구별할 수 있습니다. 작동 방식 어떤 봉의 고가나 저가가 창 안의 왼쪽 봉들보다 높거나 낮고, 오른쪽 봉들의 값이 그보다 높거나 낮거나 같지 않을 때 그 봉은 High fractal 또는 Low fractal이 됩니다. 동점일 때는 더 최근 봉이 표시를 가져갑니다. 이 검사는 두 가지 고정된 강도로 실행됩니다: Fast: 양옆 7봉을 기준으로 고점이나 저점이 두드러져야 함. Slow: 양옆 15봉을 기준으로 고점
FREE
RelicusRoad Daily Pivots는 MetaTrader 4와 MetaTrader 5용 일간 피벗 포인트 지표로, 전일 범위를 Fibonacci 레벨로 나누고 마이너스 100퍼센트부터 플러스 200퍼센트까지 위아래로 연장합니다. 고전적인 floor pivot 대신, 직전에 완료된 범위를 저가가 0%, 고가가 100%인 척도로 다룹니다. 열아홉 개의 레벨이 차트 오른쪽 가장자리에 촘촘한 색상 마커로 표시되므로, 오늘 움직임의 크기를 전일 범위의 일부 또는 배수로 읽을 수 있습니다. 작동 방식 지표는 직전에 완료된 기준 기간의 고가와 저가를 가져와 그 범위의 각 비율마다 레벨을 배치합니다: level = low + ratio x (high - low). 주말 봉은 건너뛰므로 월요일의 기준은 마지막 거래일입니다. 기준 기간은 차트 시간대에서 정해집니다. 내부 구간, 회색: 0%, 23.6%, 38.2%, 50.0%, 61.8%, 78.6%, 100%. 상단 구간, 초록: +123
FREE
RelicusRoad Multi Timeframe Levels는 MetaTrader 4와 MetaTrader 5용 멀티 타임프레임 지지·저항 지표로, H1, H4, D1, W1, MN1의 최신 스윙 고점과 스윙 저점을 현재 거래 중인 차트에 수평선으로 그립니다. 이 다섯 시간대는 각각 저항선 하나와 지지선 하나를 제공하므로, 장중 차트에는 최대 열 개의 선이 표시될 수 있습니다. 모든 선은 나온 시간대에 따라 색이 정해지므로, 차트를 바꾸지 않고도 상위 시간대의 스윙을 계속 볼 수 있습니다. 작동 방식 고정된 시간대 집합의 각 시간대에 대해 지표는 가장 최근 봉에서부터 거슬러 올라가며 최신 5봉 프랙탈, 즉 양옆 두 봉이 넘어서지 않는 고가를 가진 봉을 찾습니다. 그 고가가 해당 시간대의 저항선이 되고, 저가에 같은 검사를 하면 지지선이 나옵니다. 시간대는 차트 시간대와 같거나 그보다 높을 때만 사용되므로, 표시되는 집합은 차트에 따라 달라집니다: M1, M5, M15, M30 차트
FREE
RelicusRoad Signal Cloud는 MetaTrader 4와 MetaTrader 5용 구름 지표로, 12기간과 26기간 EMA의 간격에 따라 크기가 정해지는 가격 밴드를 21봉 앞서 투영합니다. 밴드는 종가의 3기간 EMA를 중심으로 하며, 가장자리가 완만하게 움직이도록 평활화됩니다. 앞쪽으로 이동되어 있으므로 구름의 일부는 항상 마지막 봉의 오른쪽에 위치하며, 가격은 나중에 먼저 그려졌던 구간에 도달합니다. 작동 방식 각 봉마다 지표는 종가의 12기간과 26기간 지수이동평균 사이의 절대 간격을 측정하며, 이는 MACD 선이 보여주는 것과 같은 거리입니다. 이 간격이 밴드 폭의 절반이 되어, 종가의 3기간 EMA에 더하면 상단 경계, 빼면 하단 경계가 됩니다. 두 경계는 9기간 단순이동평균으로 평활화된 뒤 오른쪽으로 21봉 이동해 그려집니다. Width: EMA 12와 EMA 26 사이의 거리. Center: 종가의 3기간 EMA, 이 빌드에서 고정됨. Smoothing:
FREE
RelicusRoad Daily Pivots는 MetaTrader 4와 MetaTrader 5용 일간 피벗 포인트 지표로, 전일 범위를 Fibonacci 레벨로 나누고 마이너스 100퍼센트부터 플러스 200퍼센트까지 위아래로 연장합니다. 고전적인 floor pivot 대신, 직전에 완료된 범위를 저가가 0%, 고가가 100%인 척도로 다룹니다. 열아홉 개의 레벨이 차트 오른쪽 가장자리에 촘촘한 색상 마커로 표시되므로, 오늘 움직임의 크기를 전일 범위의 일부 또는 배수로 읽을 수 있습니다. 작동 방식 지표는 직전에 완료된 기준 기간의 고가와 저가를 가져와 그 범위의 각 비율마다 레벨을 배치합니다: level = low + ratio x (high - low). 주말 봉은 건너뛰므로 월요일의 기준은 마지막 거래일입니다. 기준 기간은 차트 시간대에서 정해집니다. 내부 구간, 회색: 0%, 23.6%, 38.2%, 50.0%, 61.8%, 78.6%, 100%. 상단 구간, 초록: +123
FREE
RelicusRoad Fractals는 MetaTrader 4와 MetaTrader 5용 fractal 지표로, 양옆 7봉을 기준으로 하는 Fast 검사와 양옆 15봉을 기준으로 하는 Slow 검사로 두 가지 강도의 스윙 고점과 저점을 표시합니다. 양옆 7봉 창만으로도 이미 많은 작은 흔들림이 걸러지며, Slow 검사는 그 두 배가 넘는 조건을 요구하므로 더 굵은 화살표가 훨씬 넓은 구간에서 유지된 스윙만 골라냅니다. 두 강도가 함께 표시되므로 작은 스윙과 큰 스윙을 한눈에 구별할 수 있습니다. 작동 방식 어떤 봉의 고가나 저가가 창 안의 왼쪽 봉들보다 높거나 낮고, 오른쪽 봉들의 값이 그보다 높거나 낮거나 같지 않을 때 그 봉은 High fractal 또는 Low fractal이 됩니다. 동점일 때는 더 최근 봉이 표시를 가져갑니다. 이 검사는 두 가지 고정된 강도로 실행됩니다: Fast: 양옆 7봉을 기준으로 고점이나 저점이 두드러져야 함. Slow: 양옆 15봉을 기준으로 고점
FREE
RelicusRoad Trading Sessions는 MetaTrader 4와 MetaTrader 5용 거래 세션 지표로, M1, M5, M15 차트에서 Tokyo, London, New York 세션의 시작 시각을 점선 수직선으로 표시합니다. 각 세션의 시작은 오늘과 이전 평일들에 걸쳐, 해당 세션의 색으로 선, 작게 회전된 이름 라벨, 이벤트 마커로 표시됩니다. 마우스를 올리면 세션 이름과 시작 시각이 보입니다. 이 지표는 시작 시각만 표시하며 세션 범위, 겹침, 종료 시각은 음영으로 표시하지 않습니다. 작동 방식 지표는 로드될 때 브로커 서버 시간과 UTC 사이의 차이를 읽어 정시 단위로 반올림한 뒤 한 시간을 뺍니다. 그런 다음 현재 UTC 날짜에서 거슬러 올라가는 각 평일에 대해, 서버 시간으로 환산한 Tokyo 시작(23:00 UTC), London 시작(07:00 UTC), New York 시작(12:00 UTC)을 배치합니다. 토요일과 일요일은 건너뜁니다. Tokyo:
FREE
RelicusRoad CopyTrader 는 MetaTrader 4 용 무료 트레이드 카피어( trade copier )입니다. 같은 컴퓨터에 있는 MT4 터미널 간에 거래를 복사하므로, 하나의 계좌로 매매하고 나머지 계좌들이 각자의 크기와 리스크로 이를 따라가게 할 수 있습니다. 완전판이며, 기능 제한이나 체험 기간이 없습니다. 한 계좌로 매매하고, 나머지는 따라오게 하세요. MetaTrader 5: RelicusRoad CopyTrader MT5 작동 방식 하나의 터미널이 리더 (Leader, 마스터)로 동작하며 보유 중인 주문을 공유합니다. 원하는 수의 터미널이 팔로워 (Follower, 슬레이브)로 동작하며 이를 그대로 복제합니다. 터미널은 채널 이름으로 짝지어지므로, 한 대의 컴퓨터에서 여러 개의 독립된 복사 그룹을 동시에 운영할 수 있습니다. 복사는 200밀리초 타이머로 실행되므로, 팔로워는 자신의 차트에 틱이 들어오는 것을 기다리지 않고도 새 주문에 반응합니다. 설정 방
FREE
RelicusRoad Support Resistance는 MetaTrader 4와 MetaTrader 5용 지지·저항 지표로, 프랙탈 스윙에서 수요·공급 존을 만들고 각 존을 강도와 최근 테스트에 따라 등급을 매깁니다. 가격 위아래에 있는 존들의 간단한 지도를 유지하며, 각 존에는 등급, 너비, 최근 테스트 횟수가 라벨로 표시됩니다. 작동 방식 스윙 고점과 저점은 하나의 선이 아니라 가격 존으로 묶입니다. 스윙은 양옆 7봉 안에서 고가나 저가가 넘어서지 않는 봉이며, 더 큰 15봉 스윙과 이후 강한 반응이 뒤따른 스윙일수록 더 큰 비중을 갖습니다. 가중치가 적용된 스윙들은 가격 축을 따라 합산되며, 가장 밀집된 별개 구역이 존이 됩니다. 각 존은 강도 점수를 얻으며, 반복되는 테스트마다 그 점수가 낮아지고, 존들은 서로 겹치지 않도록 최소 Average True Range(ATR)의 0.75배만큼 간격을 유지합니다. Verified: 최근 100봉 이내에 테스트됐고 여전히 강함. W
RelicusRoad Action Levels는 MetaTrader 4와 MetaTrader 5용 지지·저항 레벨 지표로, 종목 자체의 변동성과 과거 반응에 맞춘 주요 및 보조 가격 레벨 격자를 만들고 각 레벨에 터치 횟수를 표시합니다. 이 격자는 고정된 핍 간격도 아니고 단순한 라운드 넘버 격자도 아닙니다. 간격과 기준점은 완료된 봉에서 도출되며, 각 레벨은 가격이 그 주변에서 보인 움직임으로 점수가 매겨지고, 현재 가격에 가까운 가장 강한 레벨만 표시됩니다. 작동 방식 기본값인 Formula 모드에서 지표는 선택한 시간대의 완료된 봉을 최대 1,200개까지 읽어 반응을 수집합니다. 스윙 고점과 저점, 그리고 위꼬리나 아래꼬리가 긴 봉들입니다. 이어서 일반적인 봉 범위, 반응 사이의 거리, 그리고 두 방식을 섞은 값을 기준으로 여러 간격을 시험하며, 각각에 여러 기준점을 적용합니다. 반응과 과거 지지·저항에 가장 잘 맞는 격자가 채택됩니다. 터치: 가격이 레벨에서 명확히 멀어진 뒤
RelicusRoad Scalping Pivots는 MetaTrader 4와 MetaTrader 5용 스윙 포인트·Fibonacci 레벨 지표로, 60봉 lookback에 걸쳐 번갈아 나타나는 스윙 고점과 저점을 표시하고 최신 스윙의 Fibonacci retracement와 extension에 라벨을 붙입니다. 이름에 들어간 pivot은 이 스윙 포인트를 가리키는 것으로, PP, R1, S1 같은 고전적인 floor pivot point가 아닙니다. 가장 최신 스윙 옆에 지표는 퍼센트 라벨 열을 표시하므로, 손으로 Fibonacci 도구를 그리지 않아도 retracement와 extension 레벨을 읽을 수 있습니다. 작동 방식 어떤 봉의 고가가 그 봉을 포함한 최근 Range봉 중 가장 높은 고가일 때 그 봉은 스윙 고점으로 표시됩니다. 스윙 저점도 같은 방식으로 찾습니다. 이 검사는 과거만 살펴보므로 봉이 지금까지의 극값이 되는 즉시 표시됩니다. 두 번째 단계는 각 상승 구간의
RelicusRoad Dynamic Circles는 MetaTrader 4와 MetaTrader 5용 스윙 고점·저점 지표로, 9봉, 60봉, 156봉이라는 세 가지 관찰 구간에서 동시에 전환점을 원으로 표시합니다. 작은 전환과 큰 전환이 같은 차트에 있지만 서로 다르게 보입니다. 짧은 구간의 점은 작은 스윙을 보여주고, 더 큰 중간·긴 구간의 고리는 훨씬 긴 구간의 극값일 때만 나타납니다. 각 원에는 HH(60)이나 LL(156) 같은 짧은 텍스트 라벨이 붙을 수 있습니다. 작동 방식 모든 봉에 대해 지표는 그 봉의 고가가 직전 N봉(해당 봉 포함) 중 가장 높은 고가인지 확인합니다. 그렇다면 그 봉에 High 원이 표시됩니다. Low도 같은 방식으로 확인됩니다. 이 검사는 과거만 살펴보므로 봉이 지금까지의 극값이 되는 즉시 표시될 수 있습니다. 같은 검사가 각 구간마다 한 번씩, 총 세 번 실행됩니다: 짧은 구간: 기본값 9봉, 작은 점으로 표시. 중간 구간: 기본값 60봉, 고
RelicusRoad Trendlines는 MetaTrader 4와 MetaTrader 5용 자동 trendline 지표로, 확정된 스윙 pivot을 지나는 trendline 채널을 세 가지 스윙 크기에서 맞추고 음영 구역으로 그립니다. 짧은, 중간, 긴 스윙은 각각 고유한 색을 가집니다. 차트는 현재 가장 높은 점수를 받은 두세 개의 채널과, 선택된 하나의 rail에 대해 참고 진입, 손절, 목표를 나타내는 회색 체크무늬 박스를 보여줍니다. 작동 방식 스윙 고점이나 저점은 양옆에 정해진 수의 마감된 봉이 있는 상태에서 그 봉이 가장 높거나 가장 낮을 때만 확정됩니다. 기본값은 짧은 스윙 9봉, 중간 스윙 60봉, 긴 스윙 156봉입니다. 가장 최신의 pivot 10개를 지나는 선은 보통 그중 최소 세 개가 0.35 ATR 이내에 있어야 하며, 그 사이의 어떤 pivot도 선을 뚫고 나가서는 안 됩니다. 고점 선과 저점 선은 이후 짝을 이뤄 채널이 됩니다. Active: 가격이 ra
RelicusRoad Order Blocks는 MetaTrader 4와 MetaTrader 5용 order block 지표로, displacement candle을 찾아 각 움직임을 시작한 캔들을 bullish 또는 bearish order block으로 표시하고, 가격이 그 안으로 얼마나 되돌아왔는지를 추적합니다. smart money concepts(SMC)로 거래하는 트레이더를 위해 만들어졌습니다. 작동 방식 displacement candle은 몸통이 최근 14봉의 Average True Range(ATR)의 1.5배 이상이면서 자신의 고가-저가 범위의 55퍼센트 이상을 차지하는 캔들입니다. 지표는 이어서 최대 세 캔들 전까지 거슬러 반대 색의 마지막 캔들을 찾고, 그 캔들의 고가와 저가가 order block이 됩니다. displacement가 이전 20봉의 최고 고가나 최저 저가를 넘어서 마감하면 block의 점수가 더 높아지지만, 구조 돌파가 필수는 아닙니다. 완료된 봉
MetaTrader 4와 MetaTrader 5용 RelicusRoad는 중심선을 기준으로 변동성 기반 유동성 레벨로 이루어진 채널을 그려서, 가격이 최근 평균 근처에 있는지 아니면 목표와 손절이 놓일 가장자리까지 늘어나 있는지 한눈에 볼 수 있게 해줍니다. 중심선은 최근 가격의 가중 평균입니다. 그 위에는 Sell 레벨 세 개, 아래에는 Buy 레벨 세 개가 있으며 각각 일정한 간격으로 더 멀리 떨어져 있어서, 바깥쪽 선은 가격이 평균에서 멀리 이동했을 때만 닿게 됩니다. 각 선이 알려주는 것 중립선, Safe Close로 표시: 최근 가격이 균형을 이루는 지점이며, 여기로 되돌아온 거래는 일반적인 역할을 다한 것입니다. 레벨 1, TP/SL-1로 표시: 일반적인 스윙이 도달하는 거리로, 추세장에서는 가격이 추세 방향 쪽에서 이 선을 따라 움직이는 경우가 많습니다. 레벨 2, TP/SL-2로 표시: 가격이 늘어난 상태로, 포지션 일부를 정리하거나 손절을 좁힐 지점입니다. 레벨 3,
필터:
Erwin Fonke
672
Erwin Fonke 2025.09.05 06:45 

i am using this indicator in combination with a EA trading assistent. It,s absolute amazing. Almost passed my FTMO challange now. Great work man! Keep it up!

Relicus LLC
38220
개발자의 답변 Waleed Ur Rehman 2026.10.10 09:06
Congratulations on passing FTMO, Erwin! Thanks for sharing it here, that's great news to read.
Juan Feliciano
1730
Juan Feliciano 2025.05.07 21:26 

great indicator. super clean and accurate entries. just want to know how to join discord pls

Relicus LLC
38220
개발자의 답변 Waleed Ur Rehman 2026.10.10 09:06
Thank you, Juan! Glad the entries look clean and accurate to you. Send me a private message here on MQL5 and I'll send you the Discord invite. That's where the strategy guides and the community are.
Danny Tsang
288
Danny Tsang 2025.05.01 08:58 

사용자가 평가에 대한 코멘트를 남기지 않았습니다

Relicus LLC
38220
개발자의 답변 Waleed Ur Rehman 2025.05.01 21:40
Sure. Welcome to the RelicusRoad Community! Please check your private message.
Manuel Gonzalez
170
Manuel Gonzalez 2025.02.16 14:46 

Good morning everyone. Please to the administrator and owner of the indicator. A few years ago I bought this wonderful indicator and wanted to make it work. There was a gentleman within discord who helped me a lot but due to my inexperience I did not understand the instructions well. Now I have acquired more experience and please would like to recover the accesses to: User Manual + Strategies + Training Videos + Private Group with VIP Access + Mobile Version Available (Separately) Please help me recover these accesses. Thank you very much...

Relicus LLC
38220
개발자의 답변 Waleed Ur Rehman 2025.02.17 17:25
Please check your private message :)
ashiem1
49
ashiem1 2024.07.26 23:01 

Before I read and understood the documentation or the training that accompanied this indicator, I placed this on my demo chart and was truly overwhelmed with all of the information and insight into what price was doing. What I did understand was I saw price hitting and reacting to a level of resistance along with (at one simple glance) seeing the indicator telling me all of the HTFrames were also trending down. I took that trade and easily hit my TP. I have since been able to go through the training and see where this indicator is much more robust than I could have ever imagined. Anyone trading one of the many strategies included or trading their own can't help but benefit from this purchase. Truly AMAZING!

Relicus LLC
38220
개발자의 답변 Waleed Ur Rehman 2026.10.10 09:06
Thank you for taking the time to write such a detailed review! It's very useful for other traders, and for us too.
CHUNGSIK YOU
672
CHUNGSIK YOU 2024.02.09 02:56 

Hello, it's been 8 months since I bought the product. I'd like to get a lot of help.

1. RelicusRoad User Guide

2. Training Videos

3. Private Discord Group Access

4. VIP Status

How can I get four support?

please can you send me manual and discord? Thank you

Relicus LLC
38220
개발자의 답변 Waleed Ur Rehman 2024.02.14 09:55
Indicator manual has been sent to your private message and you may find required full support guide in it.
Oscar Jesus Murillo Zamora
309
Oscar Jesus Murillo Zamora 2024.02.03 21:55 

developer always looking to optimized the product, really good indicator, has evrything you need for your trading, love it

Relicus LLC
38220
개발자의 답변 Waleed Ur Rehman 2026.10.10 09:06
Thank you, Oscar! Glad it's helping you. Send me a private message if you ever want help with a setting.
moneyfx3593
19
moneyfx3593 2024.01.24 18:11 

I've been using this since April 2021 before it was on MQL5 . Amazing indicator with top notch support and commitment for ongoing development from the RR team. Great/friendly Discord group too!

Relicus LLC
38220
개발자의 답변 Waleed Ur Rehman 2026.10.10 09:06
Thank you for the kind review! Glad it's helping your trading. Wishing you a good run.
zaid filtons
141
zaid filtons 2024.01.23 15:53 

(i love this indicator) At first i didn't know what i was doing i lost money even though there was tutorial videos i speeded through the tutorial videos thinking i was confident to have a go again and lost again, then i got frustrated thinking it was the creator that had made a bad indicator also put a bad review, the creator contacted me he is really nice guy he offered a 1 to 1 session or either a refund for the indicator... and i am glad i chose the 1 to 1 session. after the 1 to1 session i had it took me a few days to get use to the indicator and the losses i made were made back within few days. yes i do feel like a fool after what i did but most of all this indictor is worth penny the creator has made a discord channel for those who have purchased the indicator in this discord channel you have everything you need for the indicator ... even the creator works on the indicator near enough everyday to make it perfect for those who find faults as in small to big details on the indicator like the alerts signal performance etc. it feels like the creator has made an indicator that is probably worth a lot more than it is like an advert you see with for 2000 dollar plus indicator which a lot cant afford which am glad i bought, i usually wake up late nearly everyday in the afternoon time and for this indicator i wake up so early excited just to trade with the indicator. once a again thank you to the creator and please try not to do what i did at the beginning if you are struggling and you dont know what you are doing , speak to the creator he will help you out the creator took one hour of his time just to teach me what to do which i am very happy he did.

Relicus LLC
38220
개발자의 답변 Waleed Ur Rehman 2026.10.10 09:06
Thank you, Zaid! Glad the one-to-one session helped you get the most out of it. Good trading!
Steffen Schmidt
1072
Steffen Schmidt 2024.01.19 13:43 

Not honest business practices. Good luck with your business endeavors with repainting indicator.

Relicus LLC
38220
개발자의 답변 Waleed Ur Rehman 2024.01.19 13:58
Our indicator consists of 24 different features. 20 features are non-repaint and only 4 features are repaint. I do not understand what you're referring to and why are you saying it's not honest practice? We have open discord group to discuss any issues, we do not ban anyone unless they try to spam or try to sell their services to other people.
Oneill The Best
57
Oneill The Best 2024.01.05 09:11 

don t trust this guys they sell this system but if u don t know how to use it and u ask for help they want 60 $ per month to tell u how it s works lol. so u send me to the guy who have asked for the money Ș))))))) is this a joke? i have spoked to this salahudin today and it was the one asking for the money

Relicus LLC
38220
개발자의 답변 Waleed Ur Rehman 2024.01.19 13:56
We do not charge any of our customers to provide guidance on the indicator. Please co-ordinate with Salahuddin on Discord to assist you.
tomaszroman26
171
tomaszroman26 2023.12.03 21:28 

A stunning piece of art. This system will provide you with all you need to learn how to build a profitable empire slowly. I have tested it for more than a month and already have great results. The support the developer gives you makes it even better. They always answer with help. I give it 5 stars and highly recommend it if you search for complex solutions!

Relicus LLC
38220
개발자의 답변 Waleed Ur Rehman 2026.10.10 09:06
Thank you, Tomasz! Reviews like yours help other traders decide. Good luck with your trading.
Qinchao Zhang
682
Qinchao Zhang 2023.11.30 09:37 

Many functions are numerous but lack refinement, making them mostly trivial and of little practical value, especially unsuitable for long-term trading.

Relicus LLC
38220
개발자의 답변 Waleed Ur Rehman 2026.10.10 09:07
Thank you for the honest feedback. Many features have been refined since this review, and the current version is 2.317. If there's one you'd like improved for longer-term trading, send me a private message and tell me which one. Feedback like this decides what we work on next.
gogibaidwan
34
gogibaidwan 2023.11.22 23:17 

사용자가 평가에 대한 코멘트를 남기지 않았습니다

Relicus LLC
38220
개발자의 답변 Waleed Ur Rehman 2023.11.23 05:12
Indicator manual and discord invitation link has been sent to your private message
Arthit Fx
198
Arthit Fx 2023.11.19 09:50 

사용자가 평가에 대한 코멘트를 남기지 않았습니다

Relicus LLC
38220
개발자의 답변 Waleed Ur Rehman 2023.11.20 05:00
Indicator manual has been sent to your private message
maido
505
maido 2023.11.17 02:37 

Please send me the manual and invite me to the discord.

Relicus LLC
38220
개발자의 답변 Waleed Ur Rehman 2023.11.17 13:13
Indicator manual and discord invitation have been sent to your private message
aa973140507
42
aa973140507 2023.11.11 04:28 

我已经购买了这个指标,使用了几个月,后面才发现没有手册也没有加入discord 小组。

Relicus LLC
38220
개발자의 답변 Waleed Ur Rehman 2023.11.15 14:28
一旦您购买并向我们发送消息。然后,我们会通过私人消息向您发送手册以及私人群组的邀请。
Welber Goncalves
412
Welber Goncalves 2023.11.03 16:50 

사용자가 평가에 대한 코멘트를 남기지 않았습니다

Relicus LLC
38220
개발자의 답변 Waleed Ur Rehman 2023.11.04 16:53
Indicator manual with discord invitation link has been sent to your private message
mjh12345
263
mjh12345 2023.10.31 12:56 

Plenty of support if you join Discord, plenty of options to improve your trading combined in one indicator, plenty of strategies to select from dependent upon your trading style, Salahuddin is both friendly and helpful, I'm pretty confident that there is not much else out there that comes close for $147, constant improvement. Once you realise that there are VERY few consistantly profitable EA's and switch your attention and education to manual trading you will realise what an asset this indicator is..........in my opinion.

Update. 31/01/2024

I'm still using the indicator and I have no idea why we have the bad reviews here. I'm very pleased and will most likely purchase the complete set (TV,MT5&4) in the coming months. Thank you guys.

Relicus LLC
38220
개발자의 답변 Waleed Ur Rehman 2026.10.10 09:07
Thank you! Really glad it's been worth it for you, and thanks for the feature ideas you've shared over time.
Steve Agleron
330
Steve Agleron 2023.10.20 14:46 

Hard to use. its a bit complicated to use and there isn't really much help or support to get started.

Relicus LLC
38220
개발자의 답변 Waleed Ur Rehman 2023.10.23 01:58
Did you join the discord group? Because we have dedicated people to help. You can contact Salahuddin for any help. Also if you look at the manual, you can just choose from any one of the strategies and follow through with the strategies on the discord server.
리뷰 답변