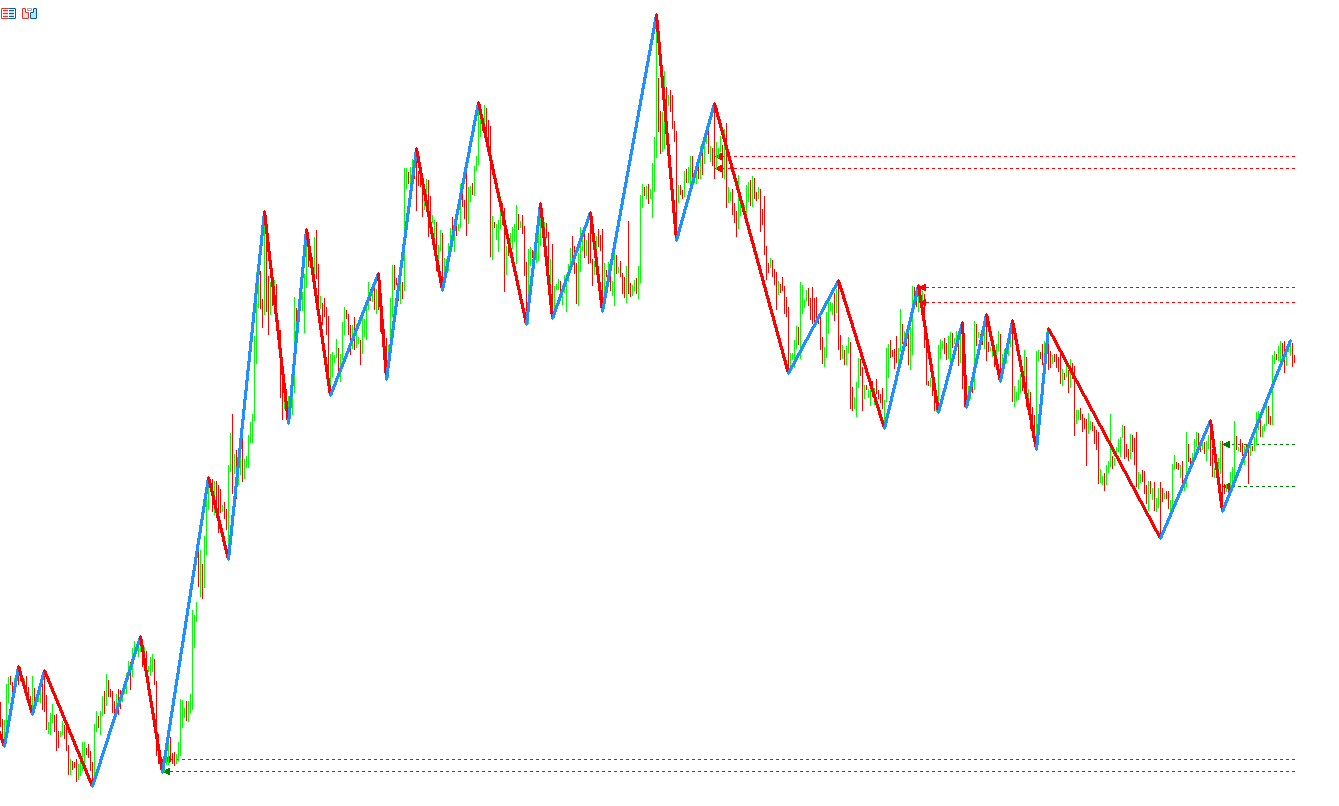
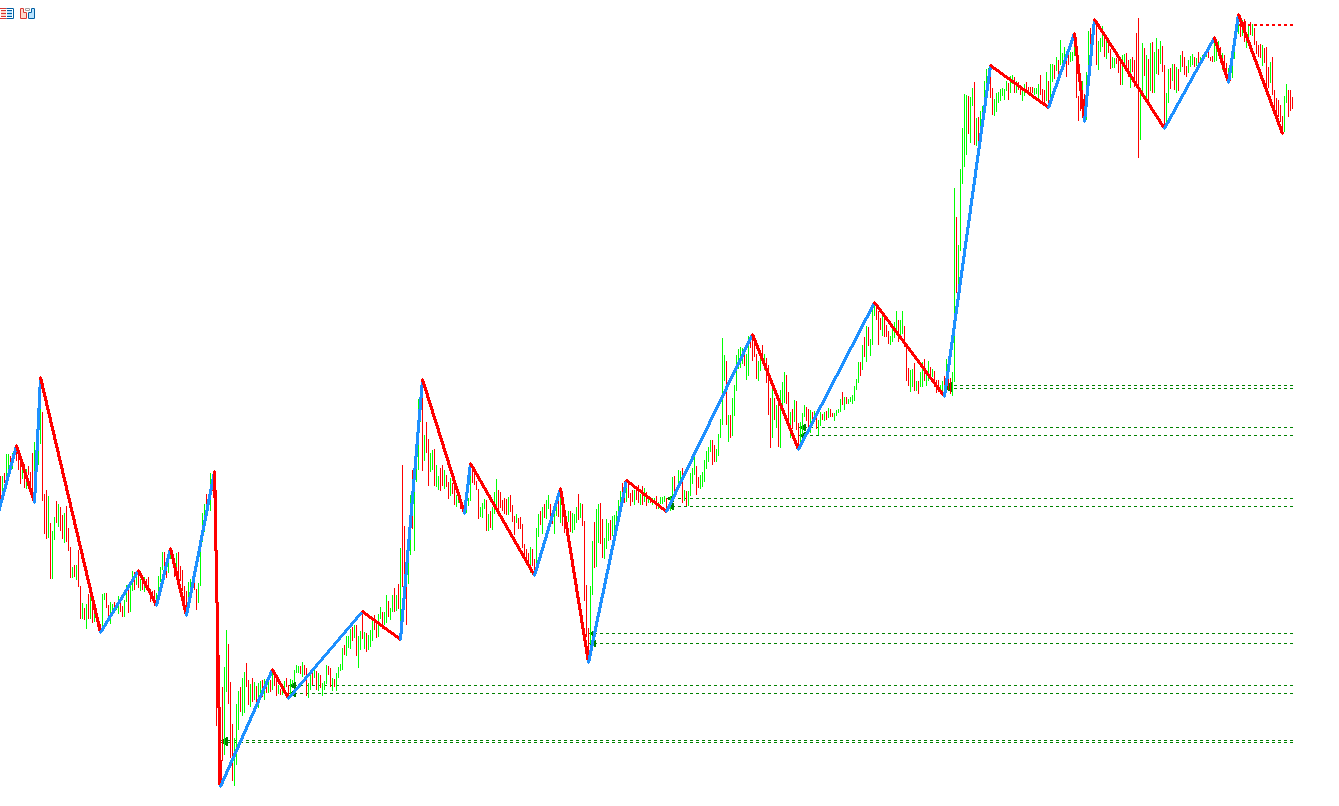
SMC Unmitigated Finding
- 지표
-
Panthita Aichoi
 BTC Wallet :
bc1qx685px03km775uapdvje8qz6t839g3fzt0gegv
ETH ERC20
USDT Address:
0x57cF049c965fbE4D25bD2a9aE02B27a04F5574F9 - 버전: 1.2
- 업데이트됨: 1 8월 2023
- 활성화: 5
SMC Unmitigated Finding is a indicator for find unmitigated supply and demand in previous legs of price
Settings
- Zigzag Settings
- ZZDepth - by Default is 12.
- ZZDeviation - by Default is 5.
- ZZBackStep - by Default is 3.
- Horizontal Line Settings
- SupportColor- color for Support line.
- ResistanceColor - color for Resistance line.
- Settings
- Num of Show- Number of Support & Resistance Show.