MTF Supply Demand Zones MT5
- 지표
- 버전: 2.5
- 업데이트됨: 26 7월 2024
- 활성화: 20

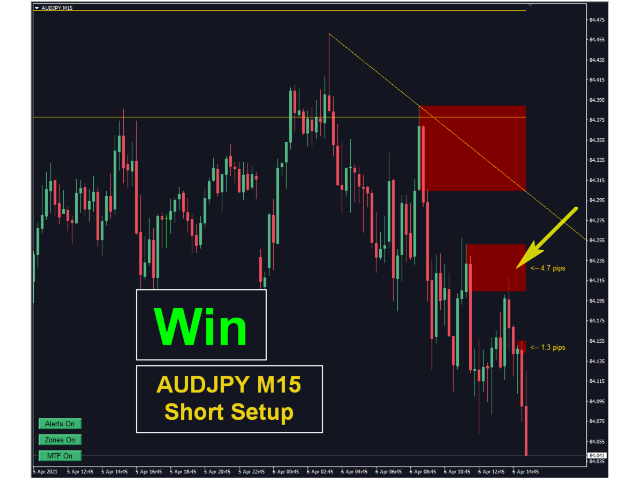
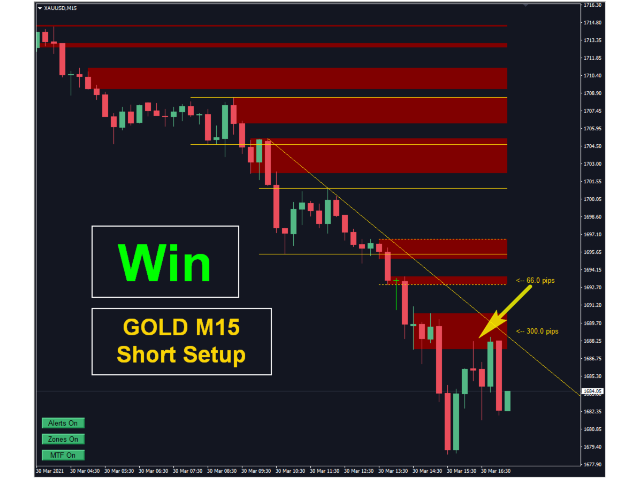
자동화된 수요 및 공급 구역의 차세대. 모든 차트에서 작동하는 새롭고 혁신적인 알고리즘. 모든 구역은 시장의 가격 움직임에 따라 동적으로 생성됩니다.
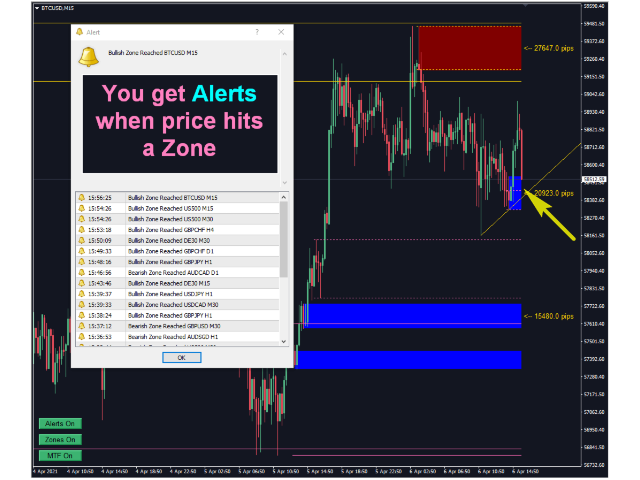
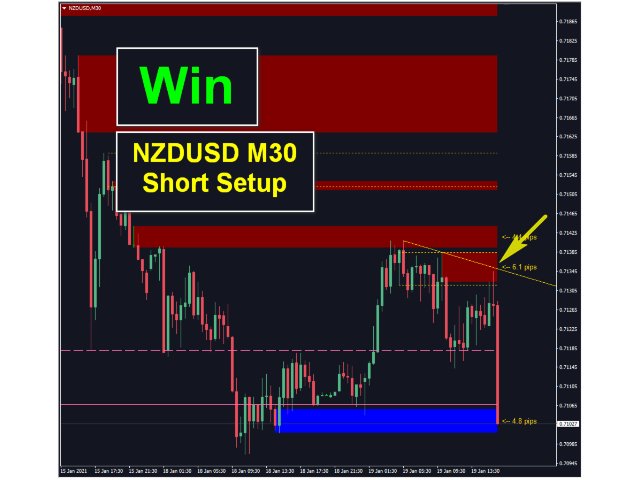
두 가지 유형의 경고 --> 1)가격이 영역에 도달할 때 2)새로운 영역이 형성될 때
당신은 더 이상 쓸모없는 지표를 얻을 수 없습니다. 입증된 결과로 완벽한 거래 전략을 얻을 수 있습니다.
새로운 기능:
가격이 공급/수요 영역에 도달하면 경고
새로운 공급/수요 구역이 생성되면 알림
푸시 알림 알림
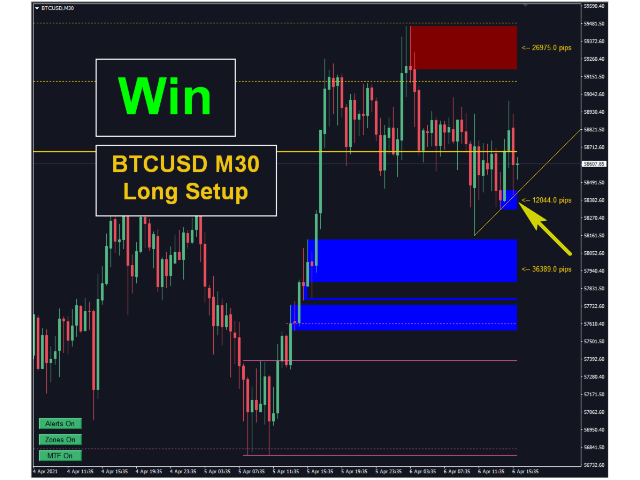
핍의 영역 너비 레이블
기동특무부대에 한 번 더 시간이 주어집니다. 따라서 현재보다 위의 2개의 시간 프레임 대신 현재보다 높은 3개의 시간 프레임을 볼 수 있습니다.
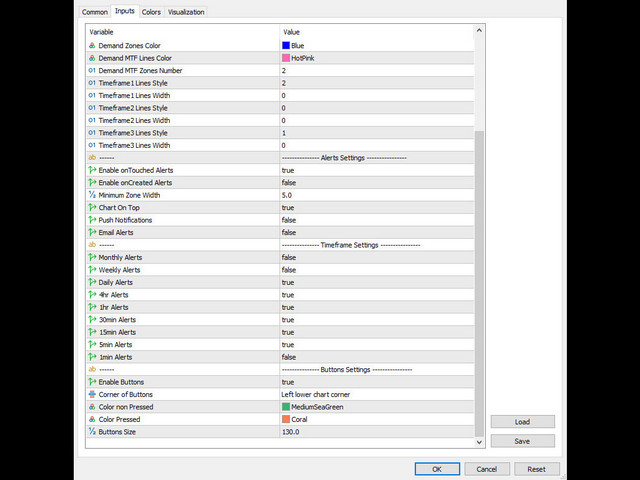
Alerts/Zones/MTF 기능을 활성화/비활성화하는 버튼
당신이 얻는 이점:
거래에서 감정을 제거하십시오.
거래 항목을 객관화하십시오.
높은 확률 설정을 사용하여 수익을 높이십시오.
도면 영역에서 시간을 절약하십시오.
전문가처럼 금융 시장을 거래하십시오.
모든 시장에 대한 즉각적인 다중 시간 프레임 분석.
차트에서 무엇을 볼 수 있습니까?
파란색과 빨간색 사각형은 현재 시간대의 수요와 공급 영역입니다.
점선은 현재 위의 첫 번째 시간대의 공급 및 수요 영역입니다.
솔리드 스타일 라인은 현재보다 두 번째 시간대의 공급 및 수요 영역입니다.
또한 현재 위의 thirdTimeframe에서 공급 및 수요 영역을 볼 수 있습니다.
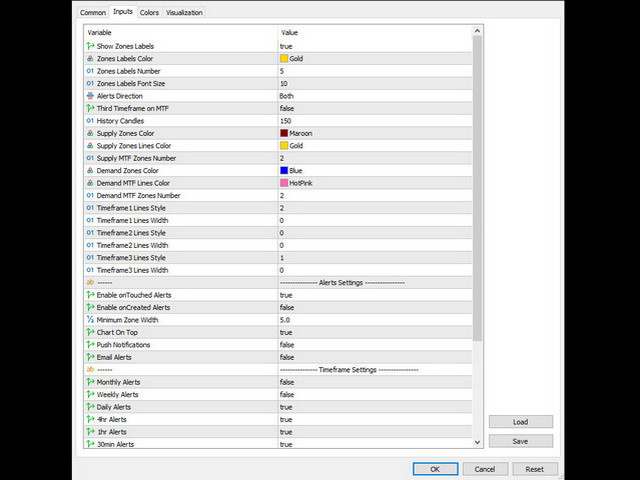
표시기의 입력 매개변수에서 사각형의 색상과 선의 스타일/너비를 변경할 수 있습니다.
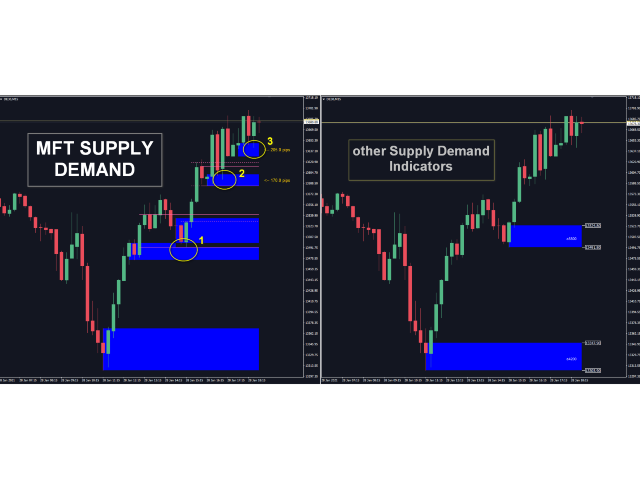
이 지표는 다른 공급 및 수요 지표와 동일합니까?
아니오, 이 지표는 기존의 무료 지표를 개선한 것이 아닙니다.
이 지표가 구역을 생성하는 방식은 시장의 다른 모든 공급 및 수요 지표와 다릅니다.
완전히 새로운 도구입니다. 아래 사진을 확인하실 수 있습니다.
다른 공급 및 수요 지표와의 주요 차이점:
1. MTF 자동 SD 영역 표시기는 다중 시간 프레임 표시기입니다. 현재 차트에서 상위 두 시간대의 영역을 볼 수 있습니다. 예를 들어 현재 차트가 1시간인 경우 4시간 및 일일 시간대의 공급/수요 영역을 볼 수 있습니다.
2. 알고리즘은 완전히 새롭고 처음부터 만들어졌습니다. 다른 지표로도 그려지지 않은 영역을 볼 수 있습니다. 영역이 더 정확하고 더 나은 진입점을 찾을 수 있습니다.
3. 모든 구역은 시장의 가격 움직임에 따라 동적으로 생성됩니다. 이는 구역이 시장 역학에 따라 너비를 변경하고 있음을 의미합니다.
4. 새로운 수준의 거래를 원하는 숙련된 거래자와 초보자를 위해 전문 거래자가 설계했습니다.
이 지표를 사용하여 거래를 한 단계 끌어올리는 방법에 대한 추가 정보가 필요한 경우 기꺼이 도와드리겠습니다.
내 프로필에 개인 메시지를 보낼 수 있습니다.
두 가지 유형의 경고 --> 1)가격이 영역에 도달할 때 2)새로운 영역이 형성될 때
당신은 더 이상 쓸모없는 지표를 얻을 수 없습니다. 입증된 결과로 완벽한 거래 전략을 얻을 수 있습니다.
새로운 기능:
가격이 공급/수요 영역에 도달하면 경고
새로운 공급/수요 구역이 생성되면 알림
푸시 알림 알림
핍의 영역 너비 레이블
기동특무부대에 한 번 더 시간이 주어집니다. 따라서 현재보다 위의 2개의 시간 프레임 대신 현재보다 높은 3개의 시간 프레임을 볼 수 있습니다.
Alerts/Zones/MTF 기능을 활성화/비활성화하는 버튼
당신이 얻는 이점:
거래에서 감정을 제거하십시오.
거래 항목을 객관화하십시오.
높은 확률 설정을 사용하여 수익을 높이십시오.
도면 영역에서 시간을 절약하십시오.
전문가처럼 금융 시장을 거래하십시오.
모든 시장에 대한 즉각적인 다중 시간 프레임 분석.
차트에서 무엇을 볼 수 있습니까?
파란색과 빨간색 사각형은 현재 시간대의 수요와 공급 영역입니다.
점선은 현재 위의 첫 번째 시간대의 공급 및 수요 영역입니다.
솔리드 스타일 라인은 현재보다 두 번째 시간대의 공급 및 수요 영역입니다.
또한 현재 위의 thirdTimeframe에서 공급 및 수요 영역을 볼 수 있습니다.
표시기의 입력 매개변수에서 사각형의 색상과 선의 스타일/너비를 변경할 수 있습니다.
이 지표는 다른 공급 및 수요 지표와 동일합니까?
아니오, 이 지표는 기존의 무료 지표를 개선한 것이 아닙니다.
이 지표가 구역을 생성하는 방식은 시장의 다른 모든 공급 및 수요 지표와 다릅니다.
완전히 새로운 도구입니다. 아래 사진을 확인하실 수 있습니다.
다른 공급 및 수요 지표와의 주요 차이점:
1. MTF 자동 SD 영역 표시기는 다중 시간 프레임 표시기입니다. 현재 차트에서 상위 두 시간대의 영역을 볼 수 있습니다. 예를 들어 현재 차트가 1시간인 경우 4시간 및 일일 시간대의 공급/수요 영역을 볼 수 있습니다.
2. 알고리즘은 완전히 새롭고 처음부터 만들어졌습니다. 다른 지표로도 그려지지 않은 영역을 볼 수 있습니다. 영역이 더 정확하고 더 나은 진입점을 찾을 수 있습니다.
3. 모든 구역은 시장의 가격 움직임에 따라 동적으로 생성됩니다. 이는 구역이 시장 역학에 따라 너비를 변경하고 있음을 의미합니다.
4. 새로운 수준의 거래를 원하는 숙련된 거래자와 초보자를 위해 전문 거래자가 설계했습니다.
이 지표를 사용하여 거래를 한 단계 끌어올리는 방법에 대한 추가 정보가 필요한 경우 기꺼이 도와드리겠습니다.
내 프로필에 개인 메시지를 보낼 수 있습니다.

This is an incredibly powerful, accurate, and insightful indicator. It functions without any issues on my laptop, and my very slow tablet. The alerts are always timely, and compared to other Supply and Demand indicators, this one draws zones that would otherwise be missed. Did I mention it's accurate? Price reacts to these zones, its crazy. I also emailed the author with some questions, and they wrote back within a very short amount of time. The support offered for this indicator is infinite. There is also a 71 page thread (that spans back for 4 years) on forexfactory with screenshots of its performance, as well as a video course for how to use this already intuitive indicator. Im really happy with this purchase, it is a MUST HAVE for every Supply and Demand trader. Many thanks to the author for his hard work, his ability and talent to teach, as well as his emotional support for his fellow traders and customers. Mentorship is offered as well (email him for details). There really isnt any more that could be asked for, this is the real deal. The description quality and completeness here on MQL5 discloses all of the functions. After closing and reopening my MT5 on both devices maybe 20+ times the indicator has not failed once, therefore I can confidently say its reliable. It's more than usable, its straight forward Supply and Demand zones without any frills or unnecessary confusing addons. Again, the support ive received, and the support ive seen others receive from the forum makes me want to get a "HPZ Trading" tattoo on my forehead, that's how awesome it is. What are you waiting for? Get this indicator today.