RSI Divergence Full
- 지표
-
Mihails Babuskins
 Senior developer for financial markets.
Contact me: Forex.terminology@outlook.com
🔵 Telegram group link: https://t.me/CommunityAndChat - 버전: 2.1
- 업데이트됨: 7 1월 2025
- 활성화: 20
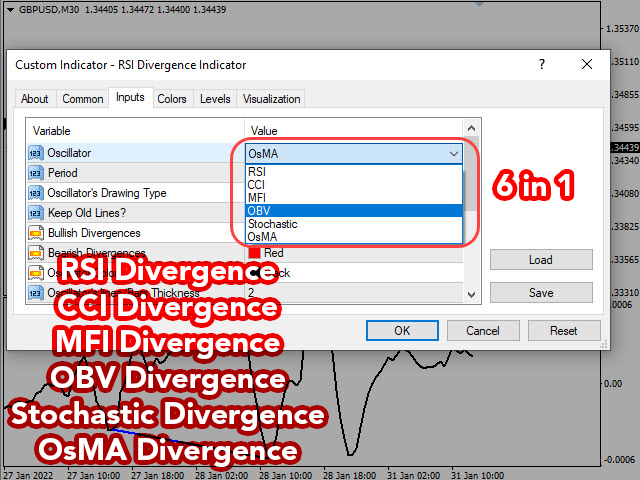
RSI Divergence Full +10 other divergence indicators
- Contact me after payment to send you the User-Manual PDF File.
- Download the MT5 version here.
- Also you can download the >>> Hybrid Trading EA <<< that is designed and implemented based on RSI Divergence Indicator.
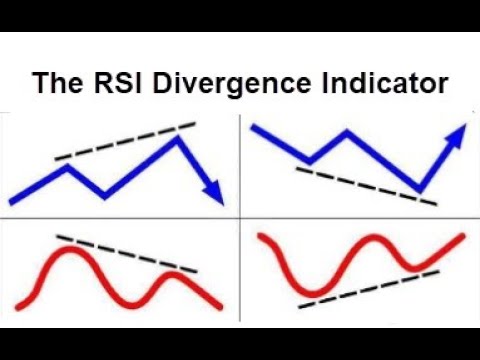
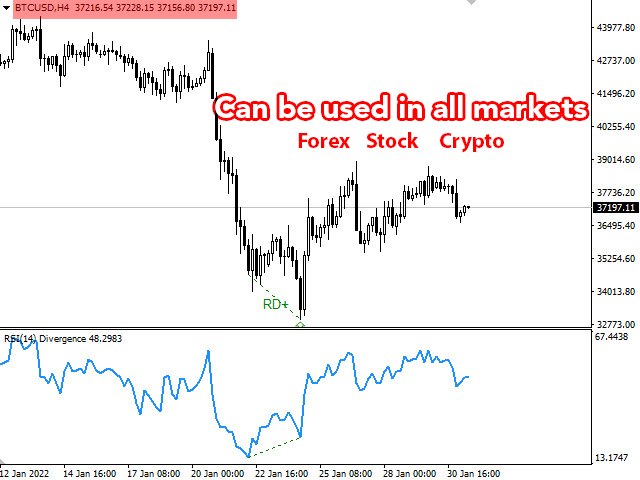
RSI is a pretty useful indicator in itself but it's even more effective when you trade divergence patterns with that. Because the divergence signal of the RSI indicator is one of the most powerful signals among the indicators.
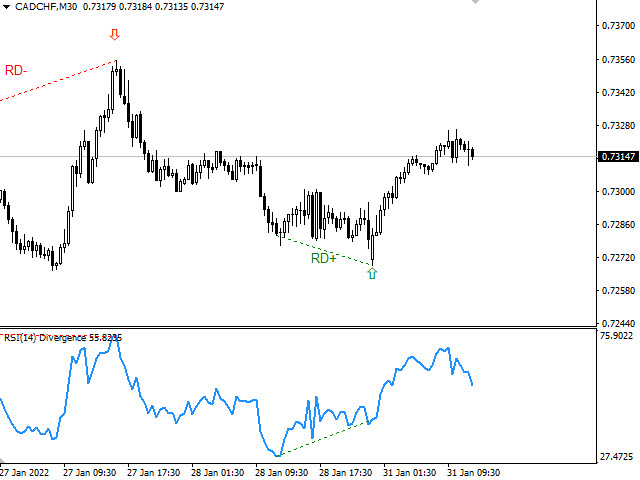
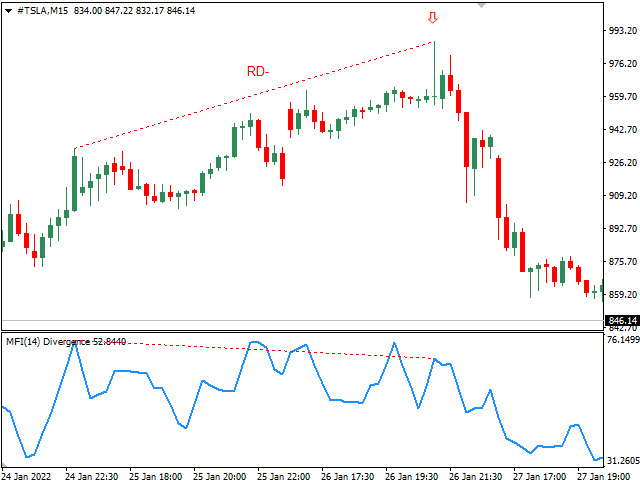
Divergences signal a potential reversal point because directional momentum does not confirm the price. A bullish divergence occurs when the underlying security makes a lower low and RSI forms a higher low, which shows less downside momentum. A bearish divergence forms when the security records a higher high and RSI forms a lower high, which shows less upside momentum.
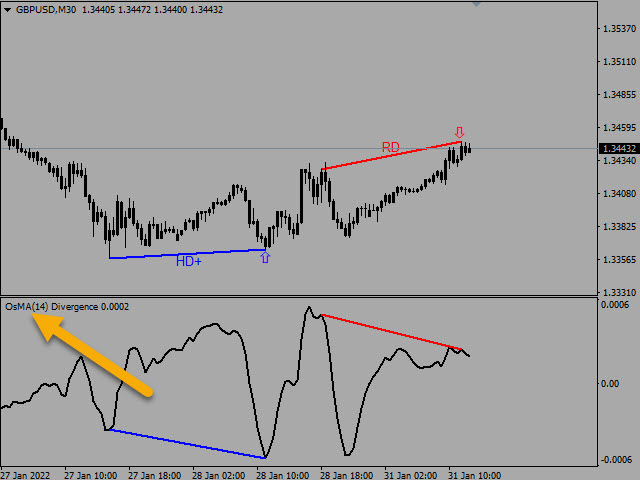
The indicator also finds hidden divergences (HD). Hidden divergences are created in the direction of the trend, and are often strong signals for the trading.
This indicator is very functional and can greatly improve the outcome of your trading.
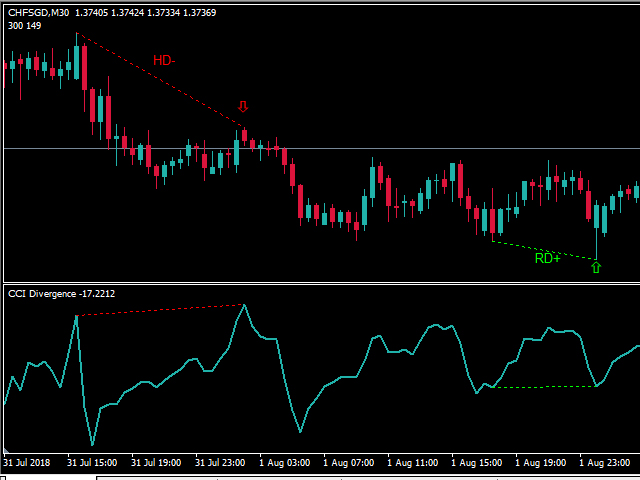
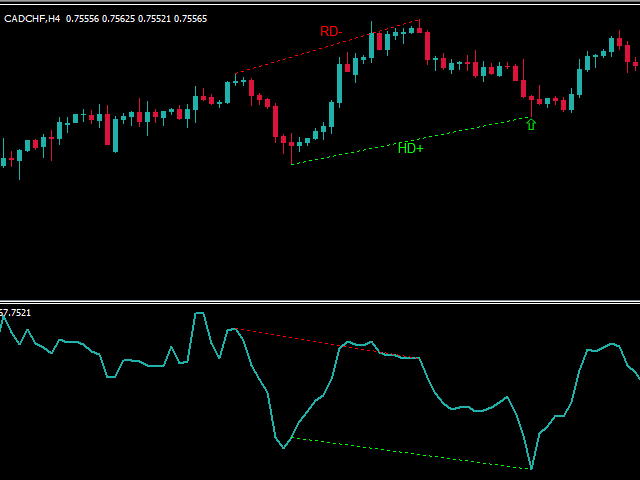
Detection method
Indicator detects price pivots and checks the corresponding value of pivots on RSI indicator.
When a divergence is detected (price movement and oscillator in the opposite direction), it is plotted bylines in the chart and oscillator.
Indicator Parameters
- RSI Period
- Type Of Drawing RSI (Line or Histogram)
- Color Of RSI Lines/Bars
- Bullish Divergences (Choose a color to draw bullish divergences)
- Bearish Divergences (Choose a color to draw bearish divergences)
- RSI lines/Bars Thickness
- Divergences Lines Thickness
- Divergences Lines Style (Enter a number to solid, dashed, etc.)
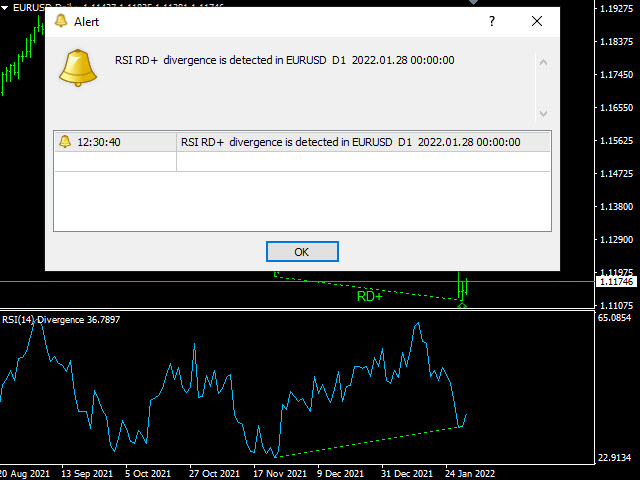
- Alert (ON/OFF)
- Divergences Filter (You can choose to show regular or hidden divergences or both)
- Sending Push Notifications (To know when divergence occurs. The user can choose to send push notifications or not
/////////////////////////////////////////////////////////////////////
RSI, MFI and OBV divergences detector are added in the new version, enjoy.


Nice