MACD Divergence and TFR for MT4
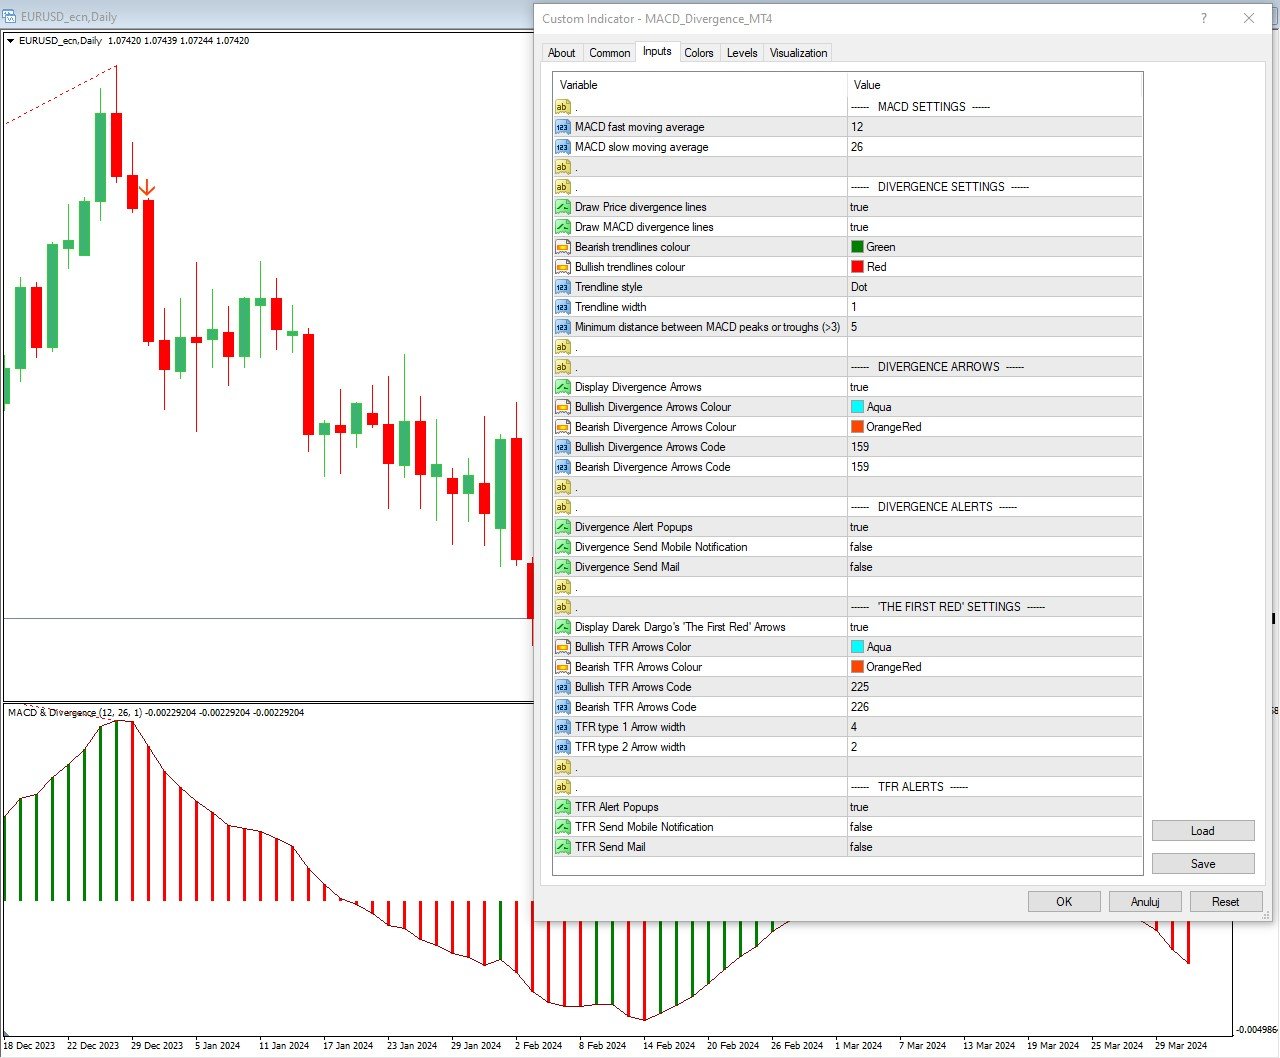
- 지표
- 버전: 1.0
- 활성화: 5
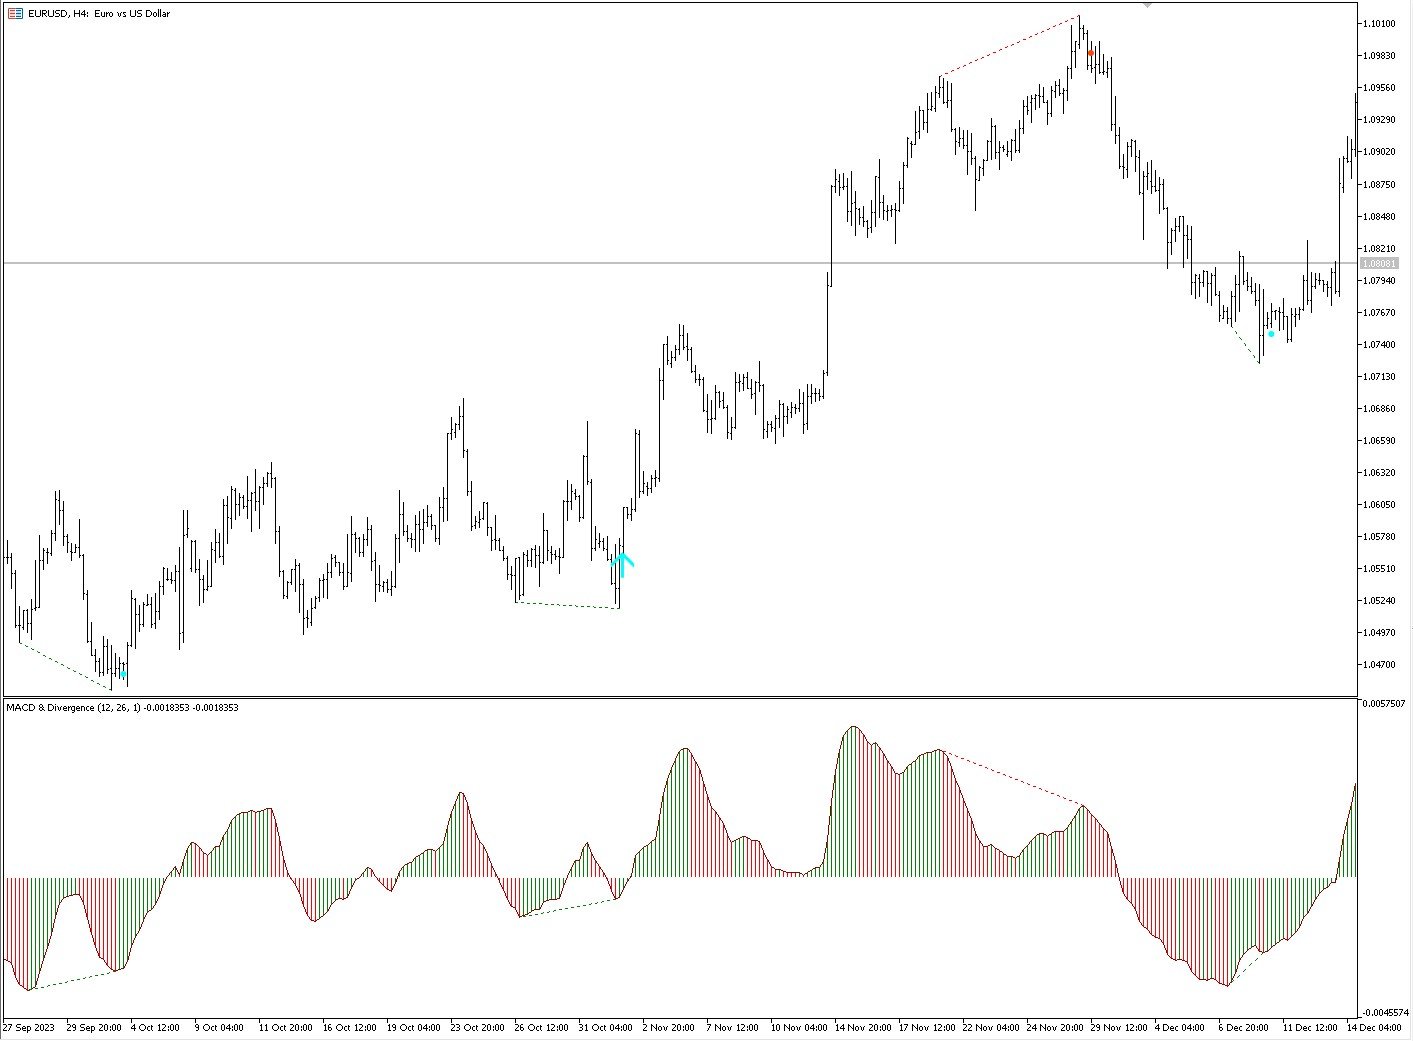
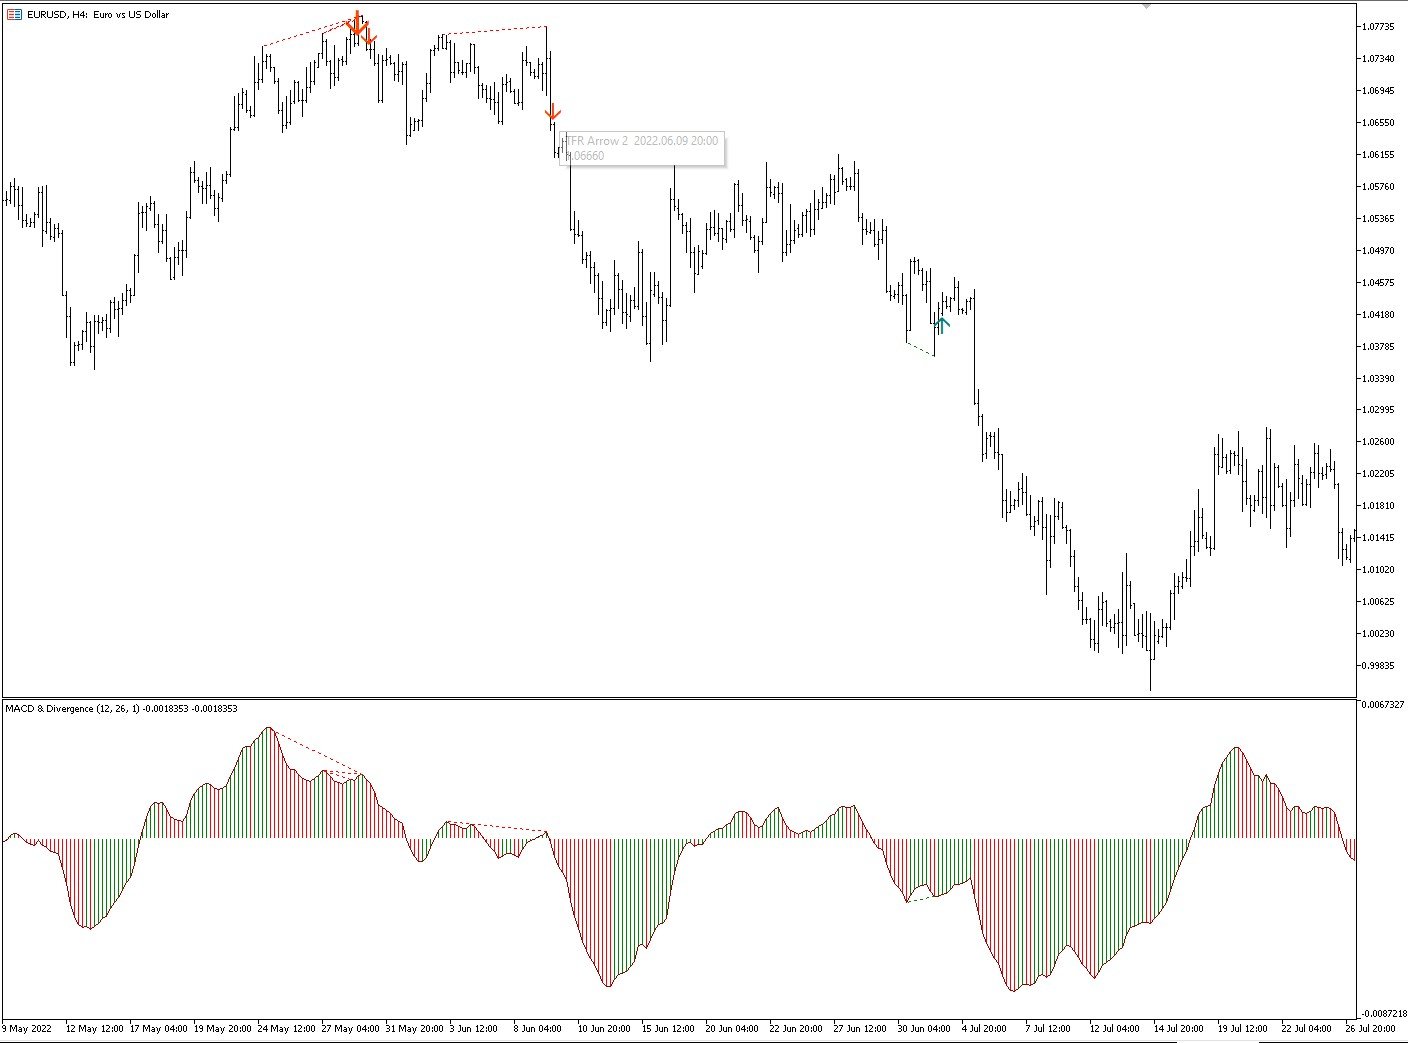
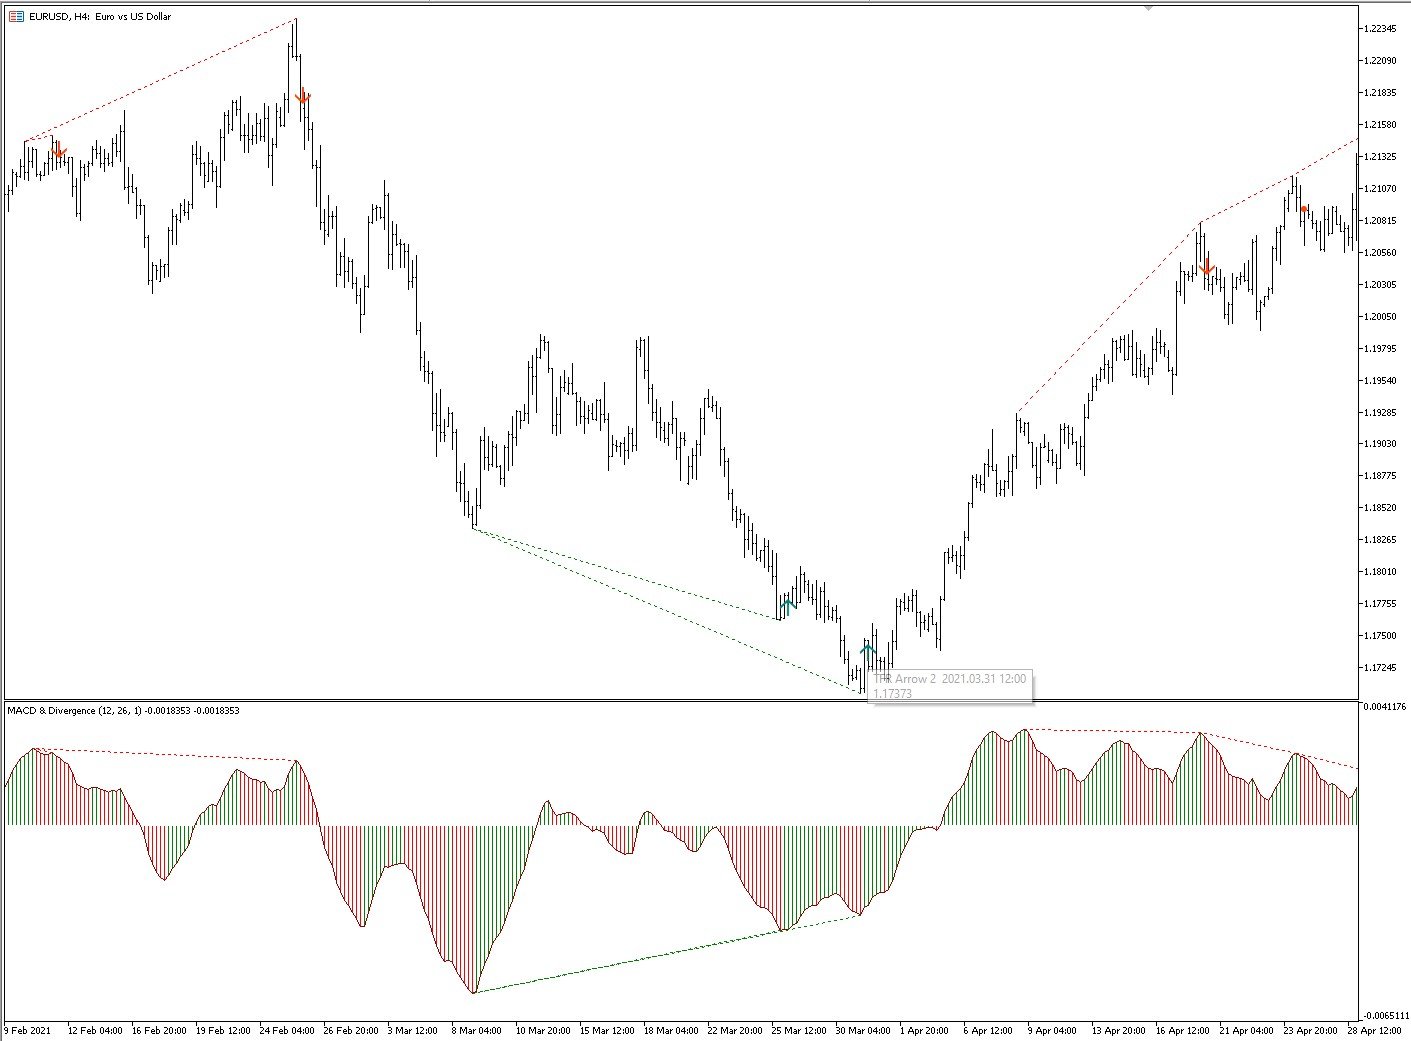
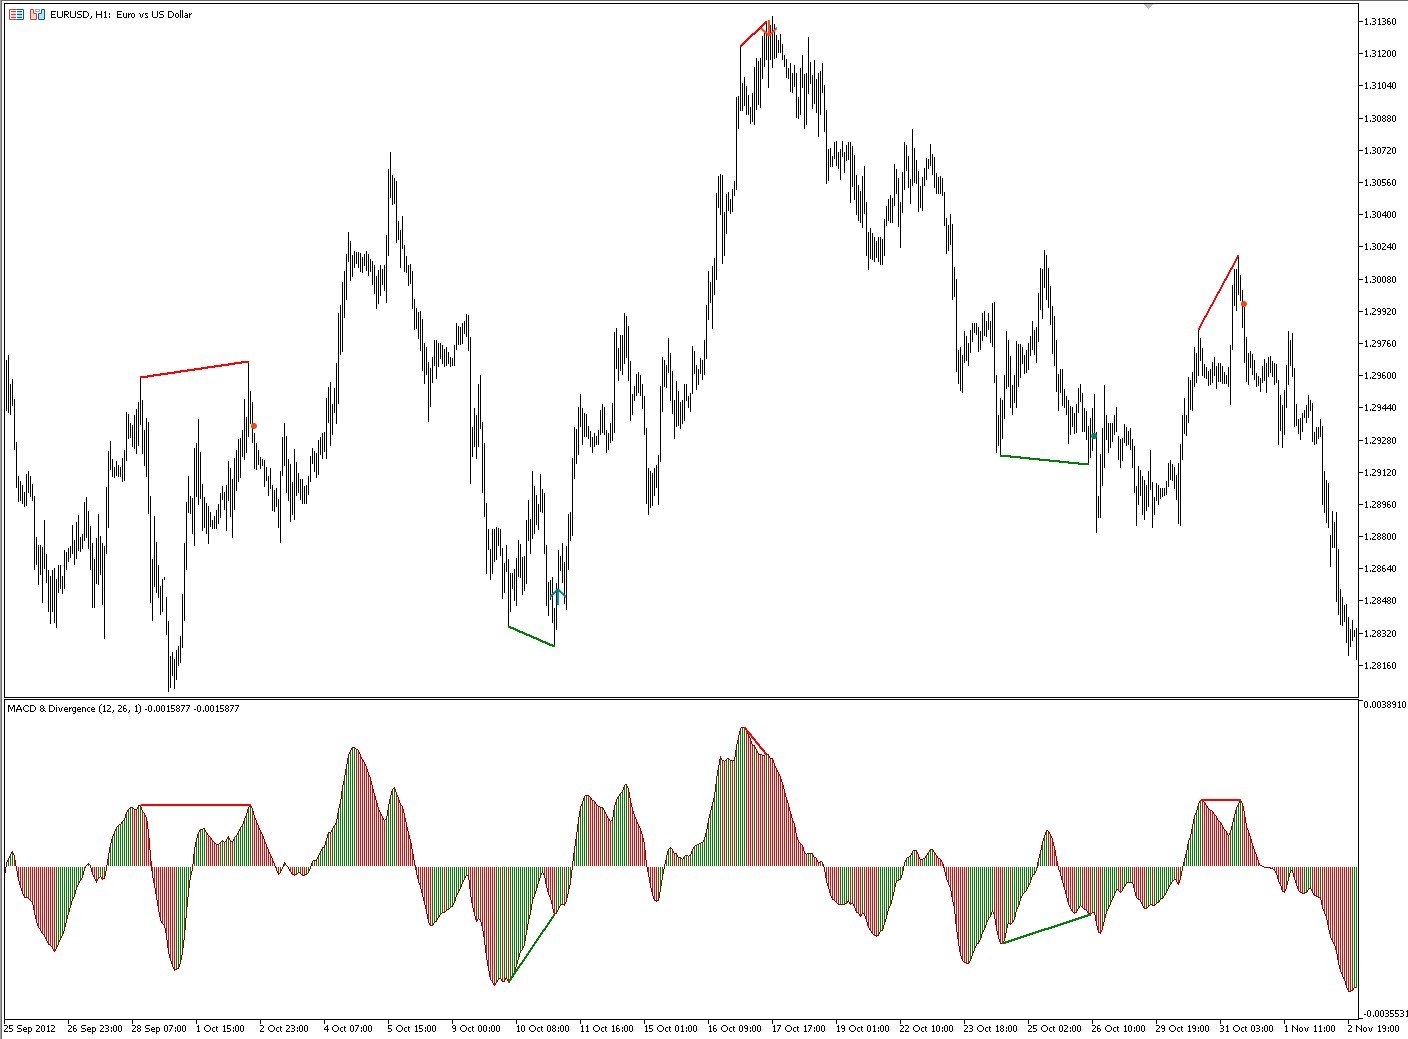
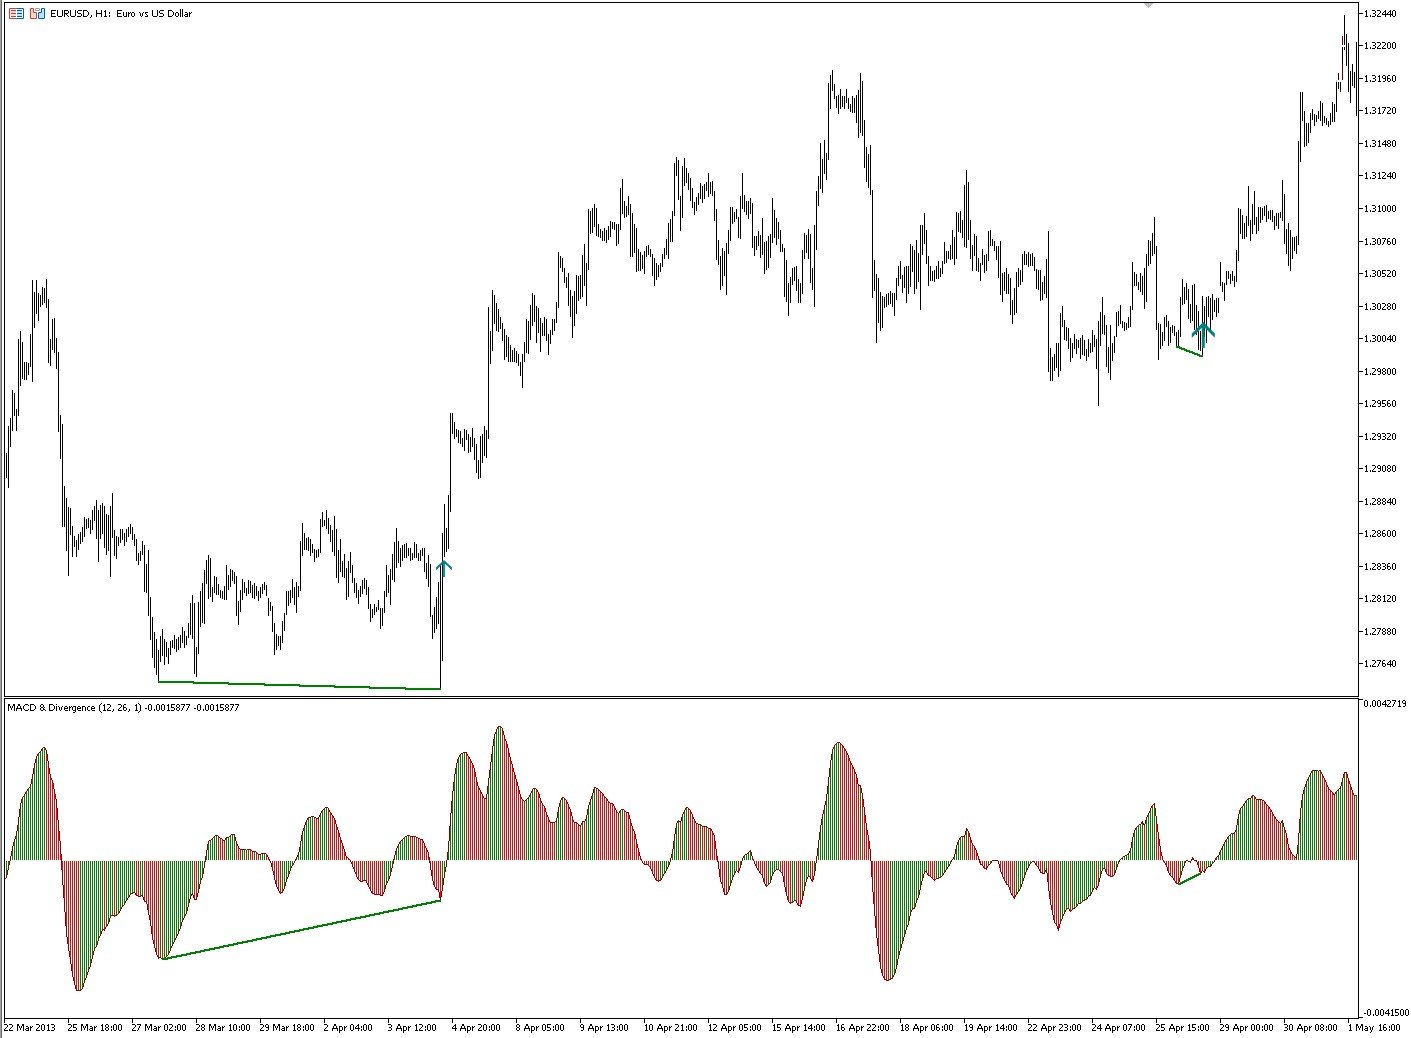
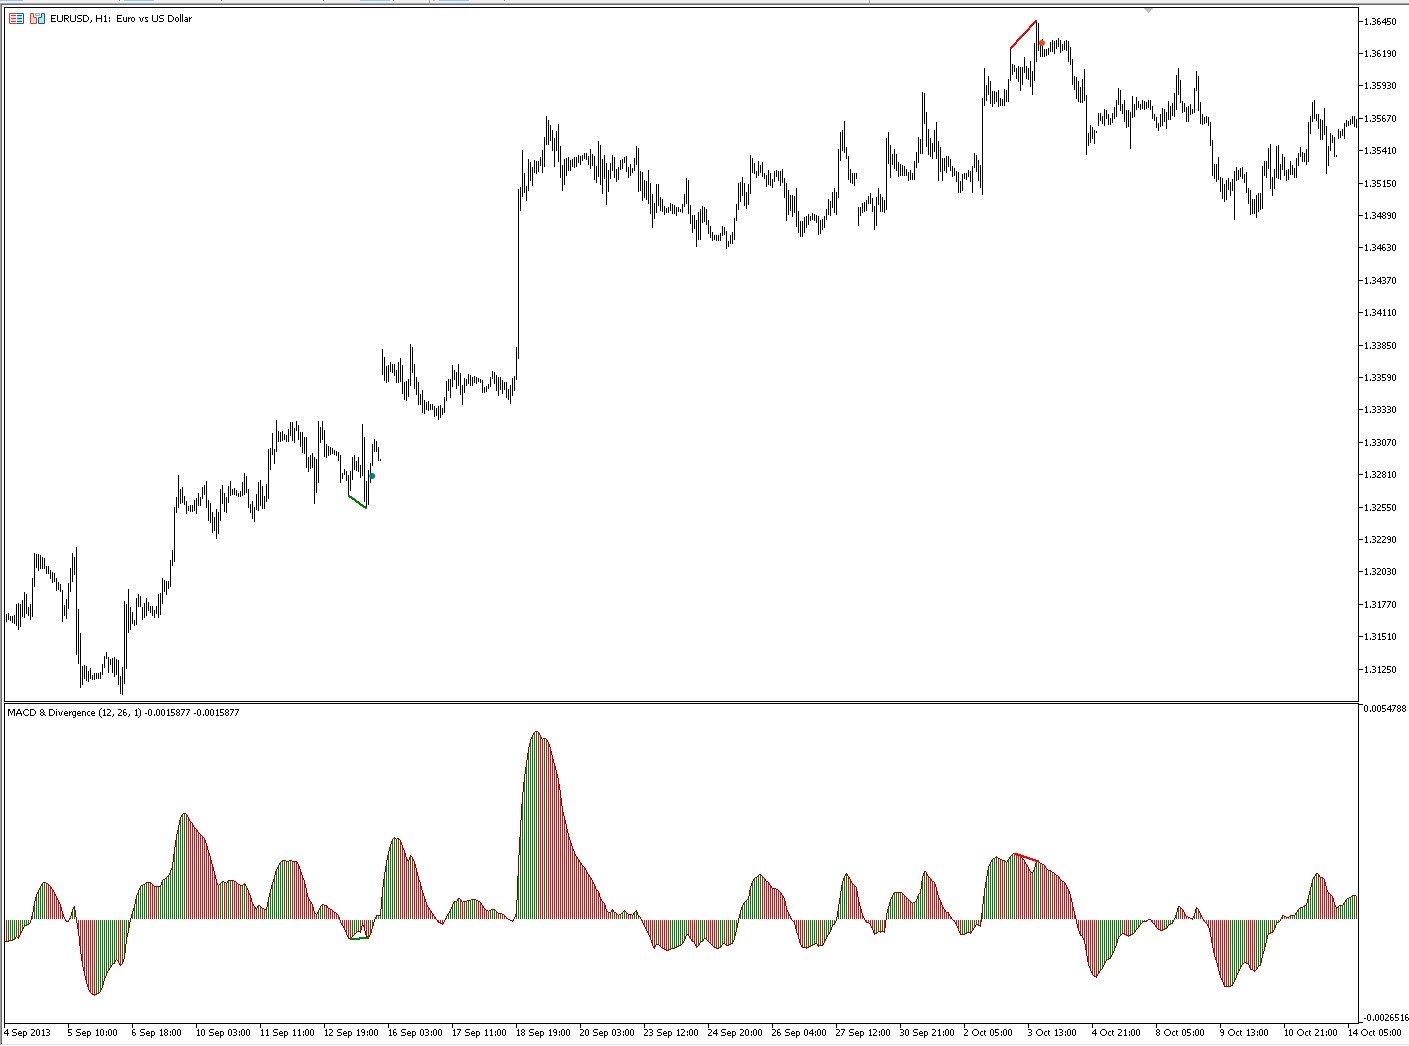
The indicator identifies divergence by analyzing the slopes of lines connecting price and MACD histogram peaks or troughs.
-
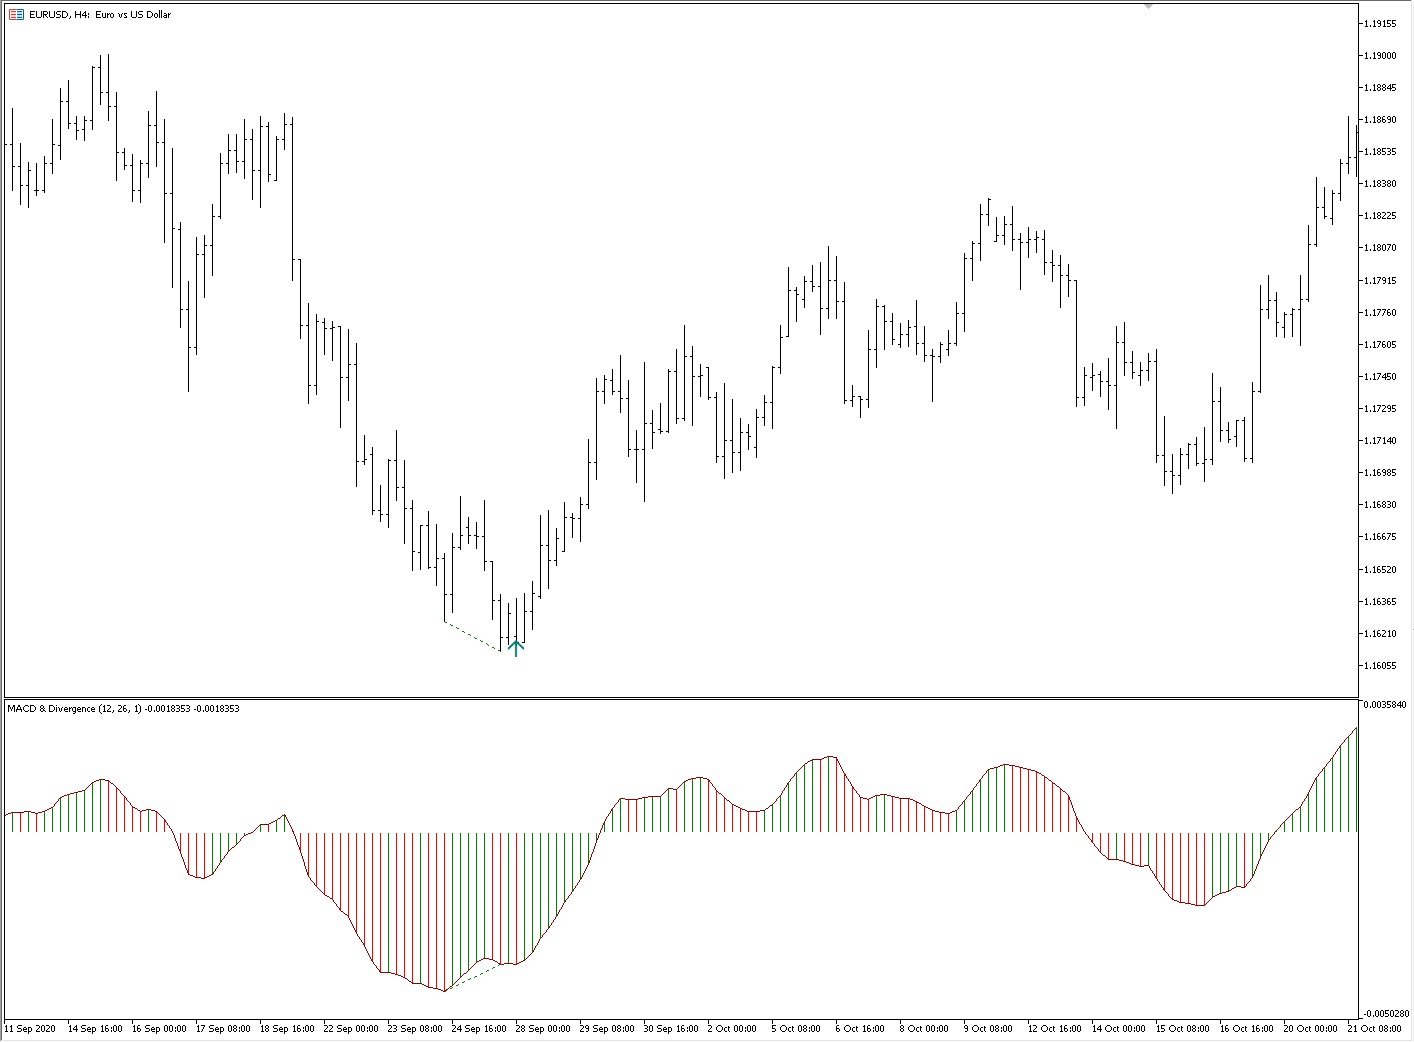
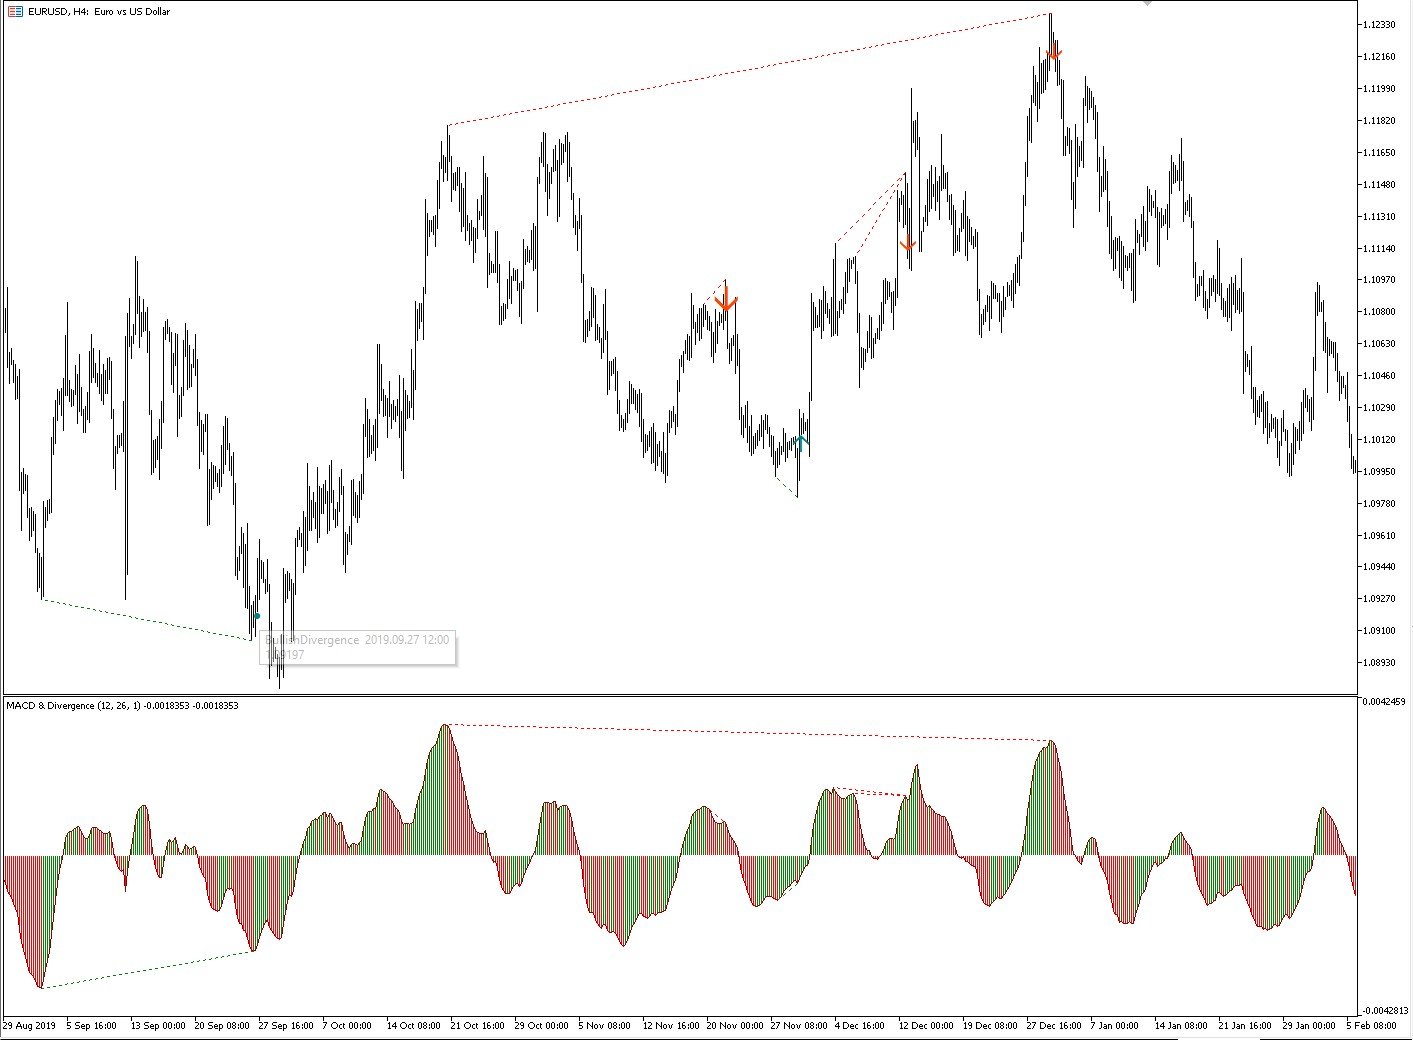
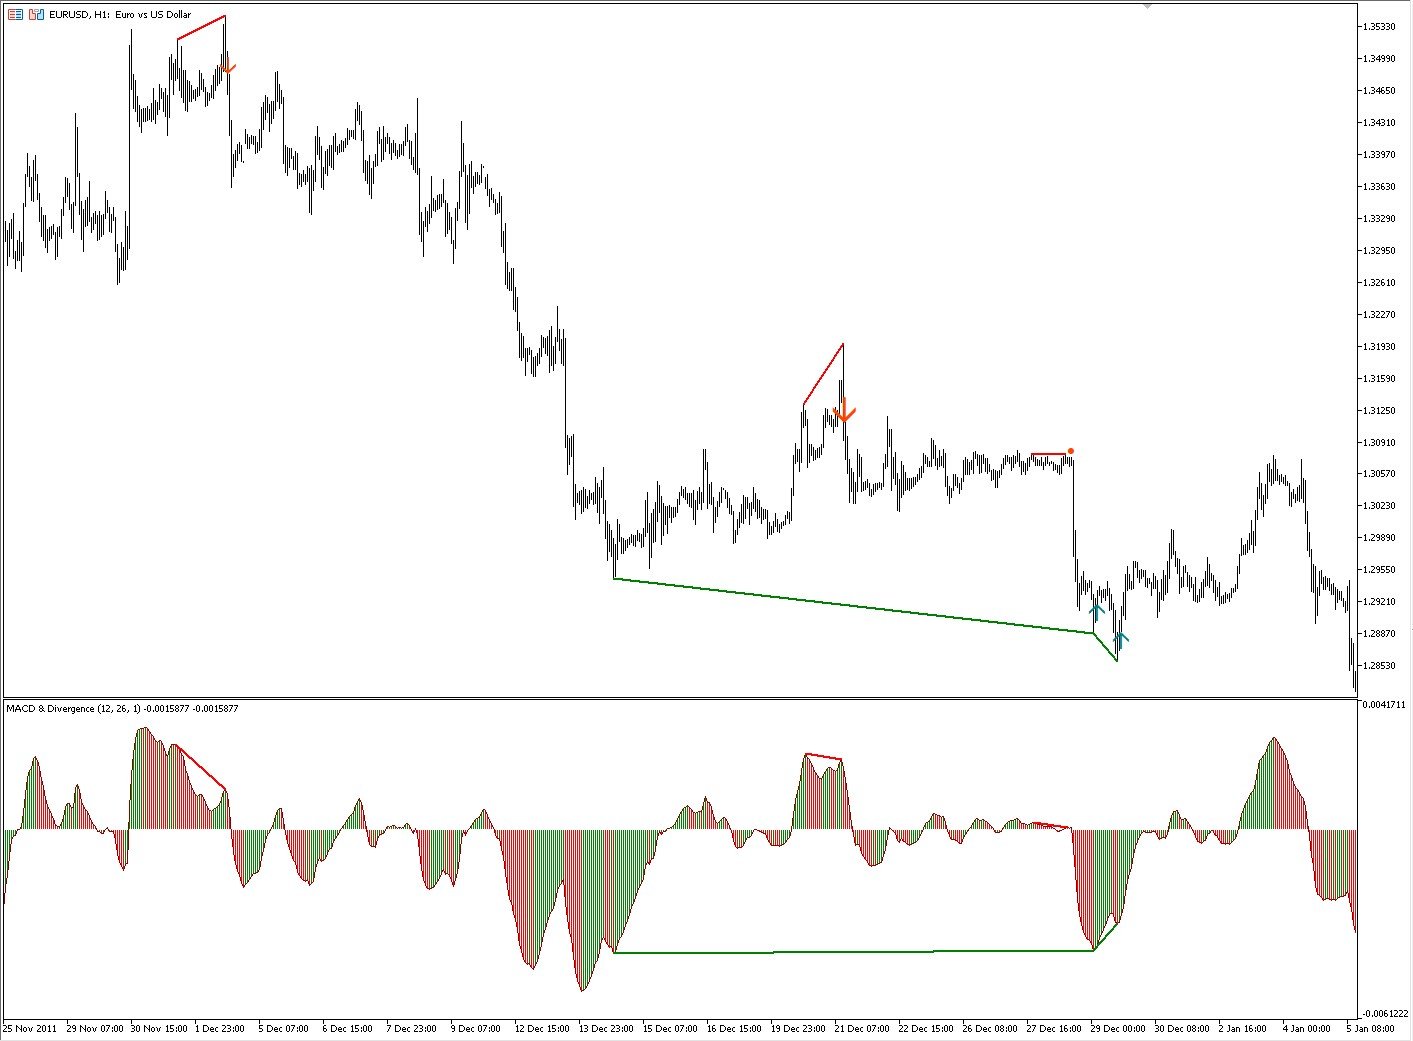
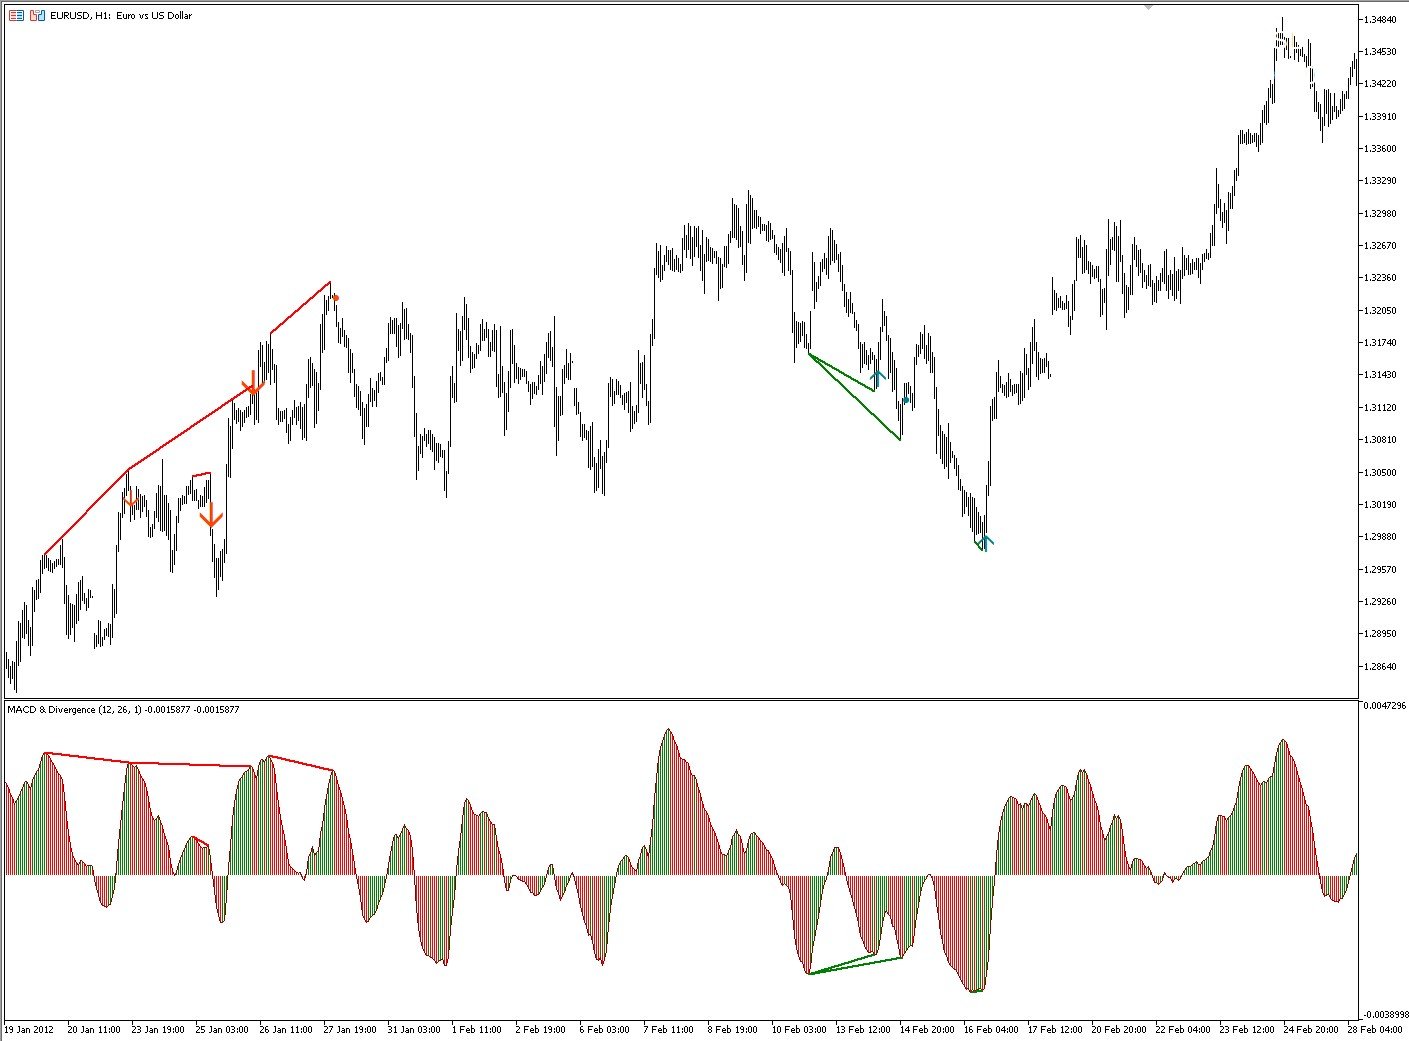
Bullish Divergence (Convergence): Occurs when the lines connecting MACD troughs and corresponding price troughs have opposite slopes and are converging.
-
Bearish Divergence: Occurs when the lines connecting MACD peaks and corresponding price peaks have opposite slopes and are diverging.
When a divergence signal is detected, the indicator marks the chart with dots at the price level and time corresponding to the signal.
Additional Features:
The indicator integrates signals from Darek Dargo’s trading system, known as TFR (The First Red). If a divergence coincides with a TFR signal, directional arrows are displayed on the chart, highlighting the enhanced signal.
MACD Histogram:
-
The histogram is color-coded for clarity:
-
Red bars indicate a higher value compared to the previous bar.
-
Green bars indicate a lower value compared to the previous bar.
-
-
A color change from red to green below the zero line suggests a potential buying opportunity. Conversely, a color change from green to red above the zero line indicates a potential selling opportunity.
-
Divergence and TFR signals act as filters, adding confirmation to these moments.
Technical Details:
The MACD histogram is calculated as the difference between a 12-period and 26-period exponential moving average. The signal line is not included in the divergence pattern, ensuring the focus remains on histogram dynamics.
Very good and precise indicator. I have been working with him for several months and I can say that he has paid back many times. If anyone still has doubts, I recommend YouTube instructions from Darek Dargo.