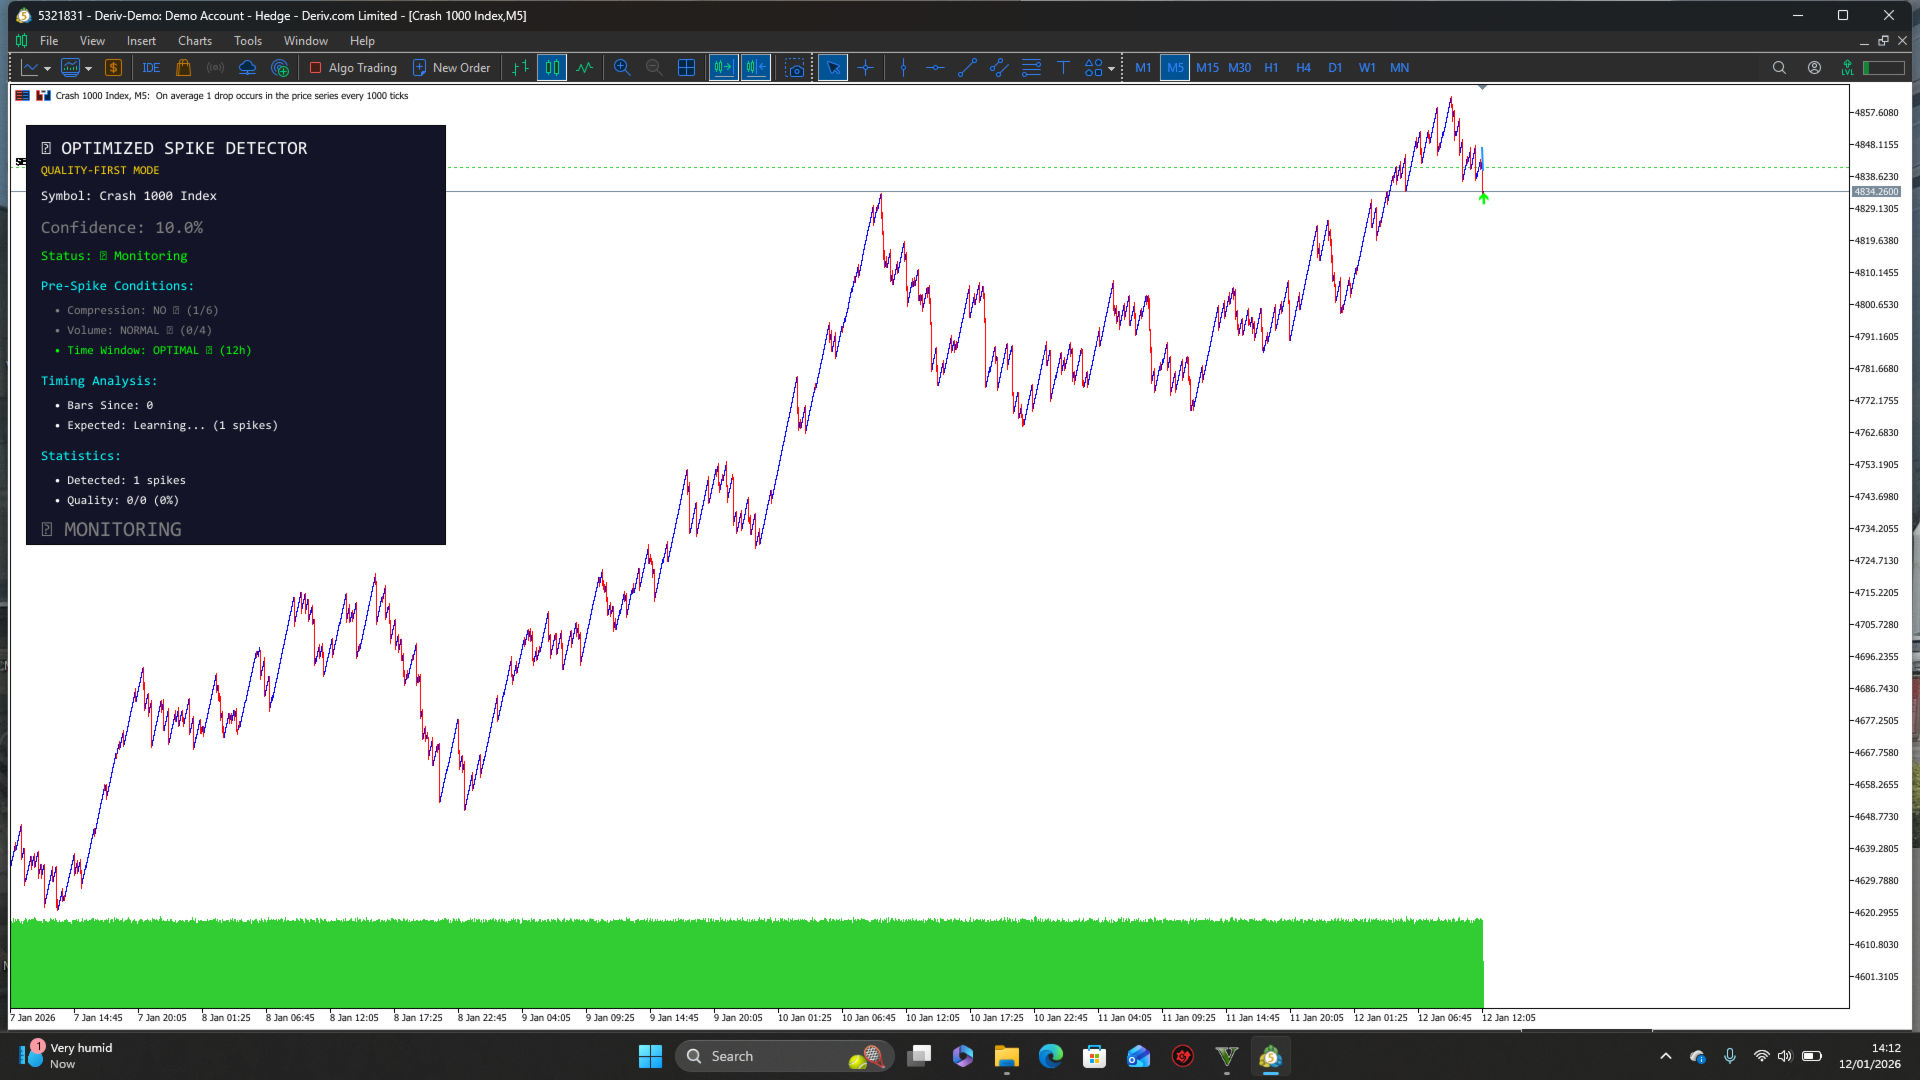
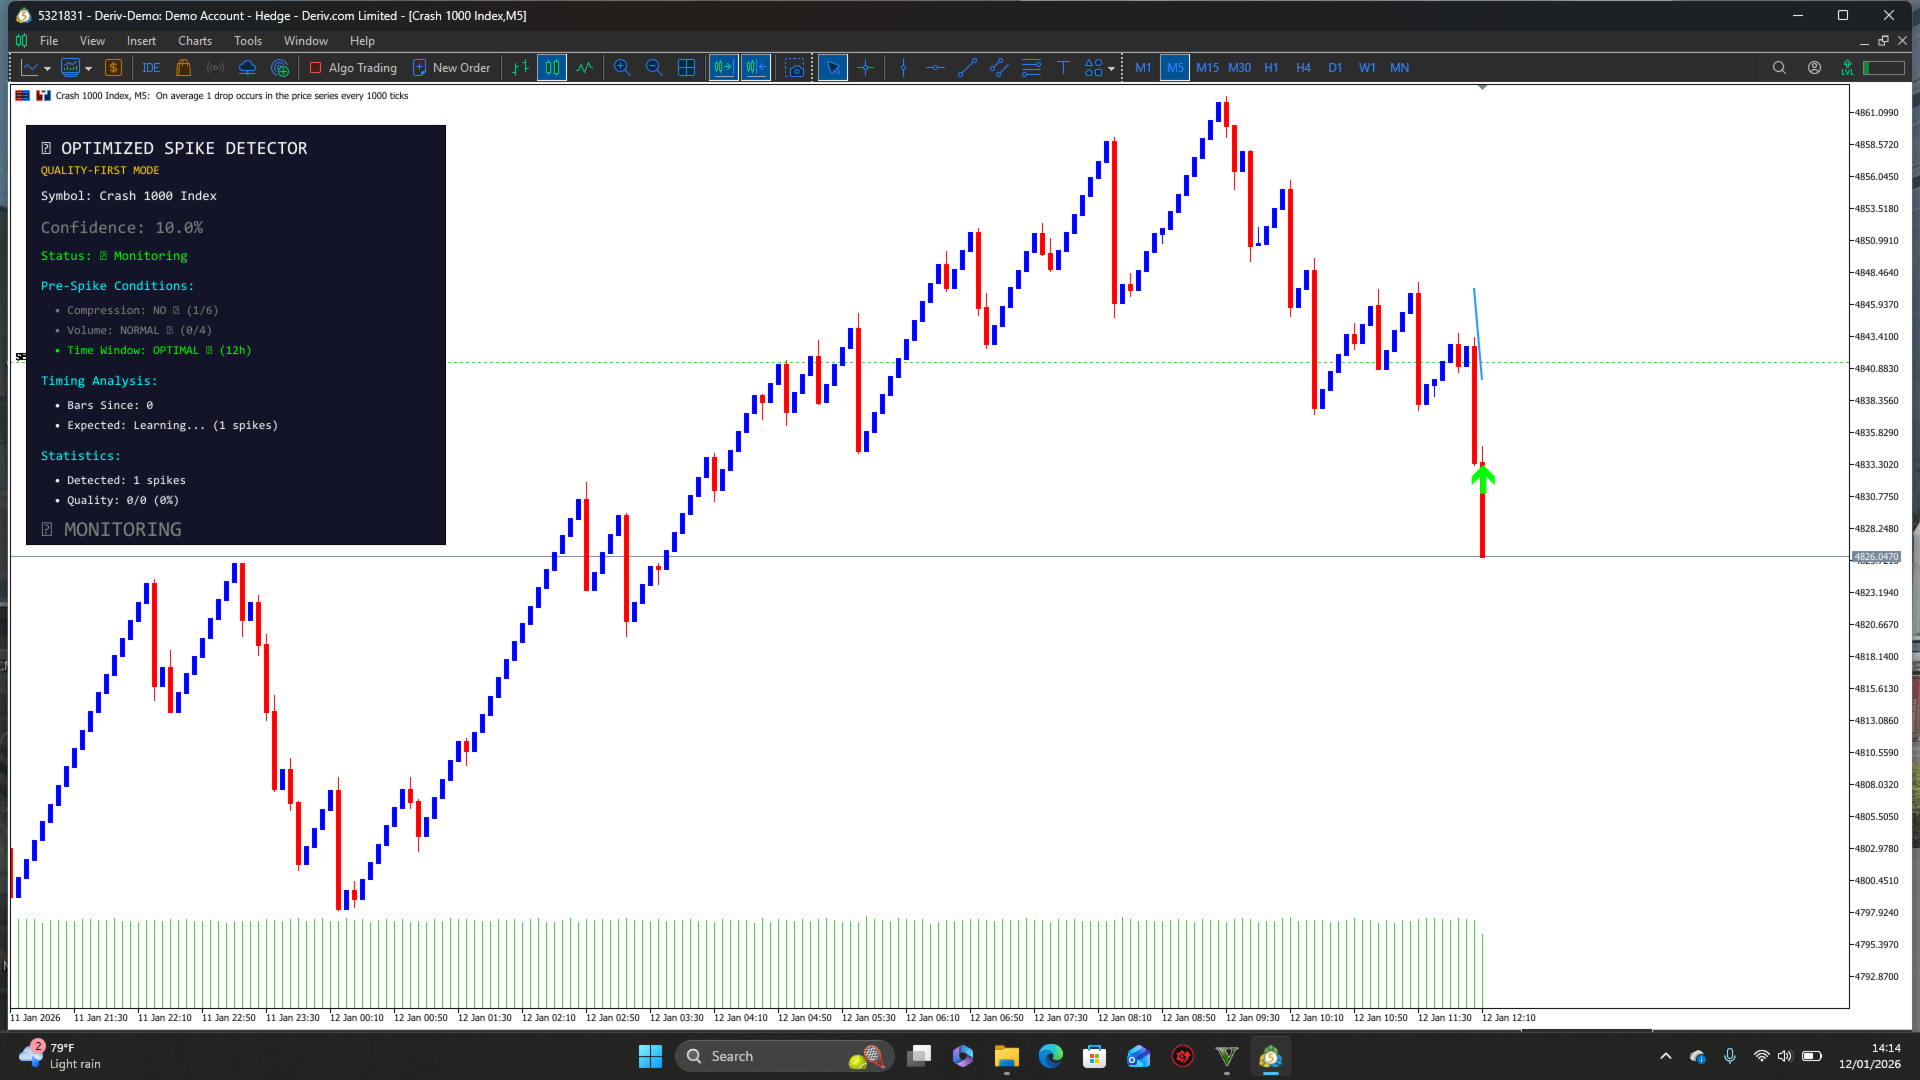
Optimized Spike Detector Pro
- インディケータ
- バージョン: 6.0
- アクティベーション: 5

Optimized Spike Detector Pro for MT5 is a professional-grade technical indicator designed to identify and capitalize on sharp, impulsive price movements (spikes) in any financial instrument. Utilizing a sophisticated, multi-algorithmic core, it distinguishes significant volatility expansions from market noise with exceptional accuracy. The tool dynamically adapts to changing market conditions, filtering out false signals and highlighting only high-probability spike setups in real-time. Featuring fully customizable sensitivity parameters, visual and push alert systems, and multi-timeframe analysis, it provides clear entry and exit points for scalpers and day traders. Built for speed and reliability in the MQL5 environment, this detector is an essential edge for strategies focused on breakouts, news events, and rapid momentum shifts.