RC Range Filtered AlgoAlpha MT5
- インディケータ
-
Francisco Rayol
 MQL5 | MQL4 | PINESCRIPT | NINJASCRIPT
RC ATR Volatility Hedge Zones: https://www.mql5.com/en/market/product/114742 - バージョン: 1.0
- アクティベーション: 10
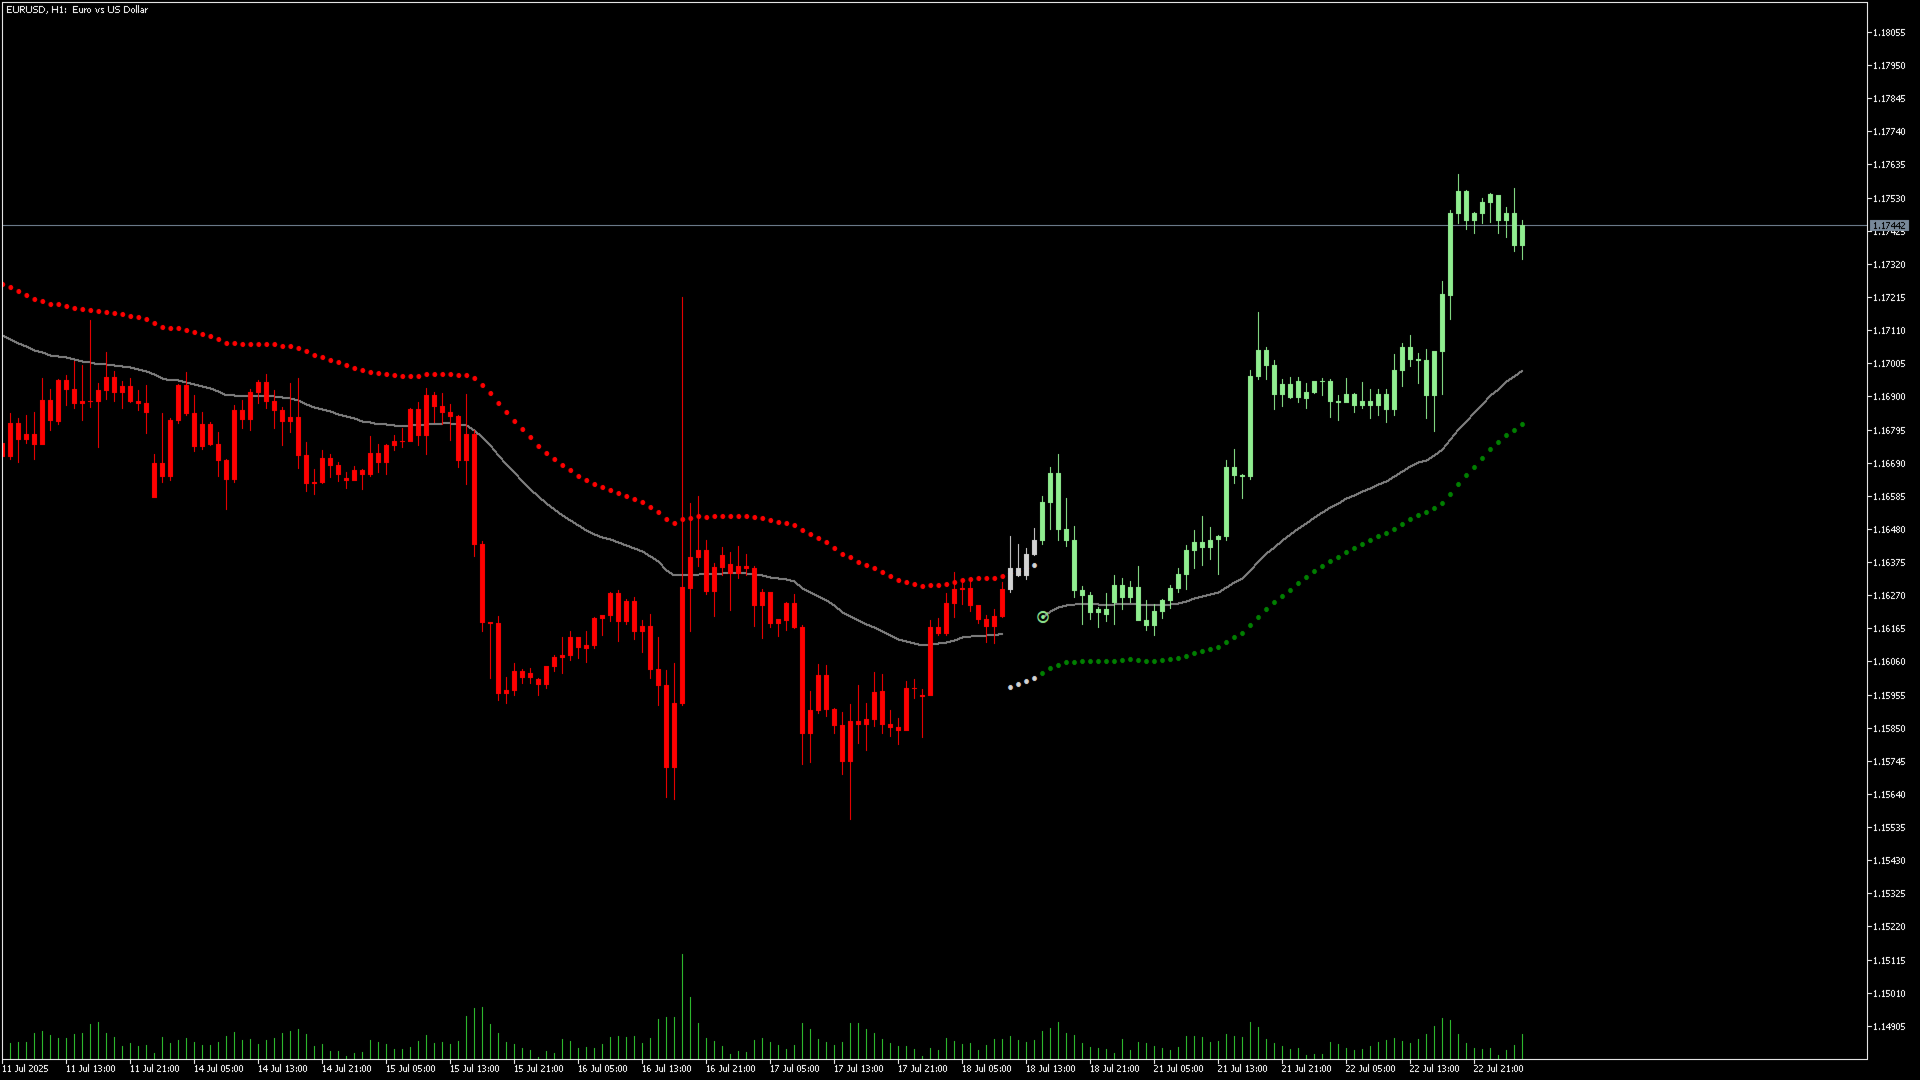
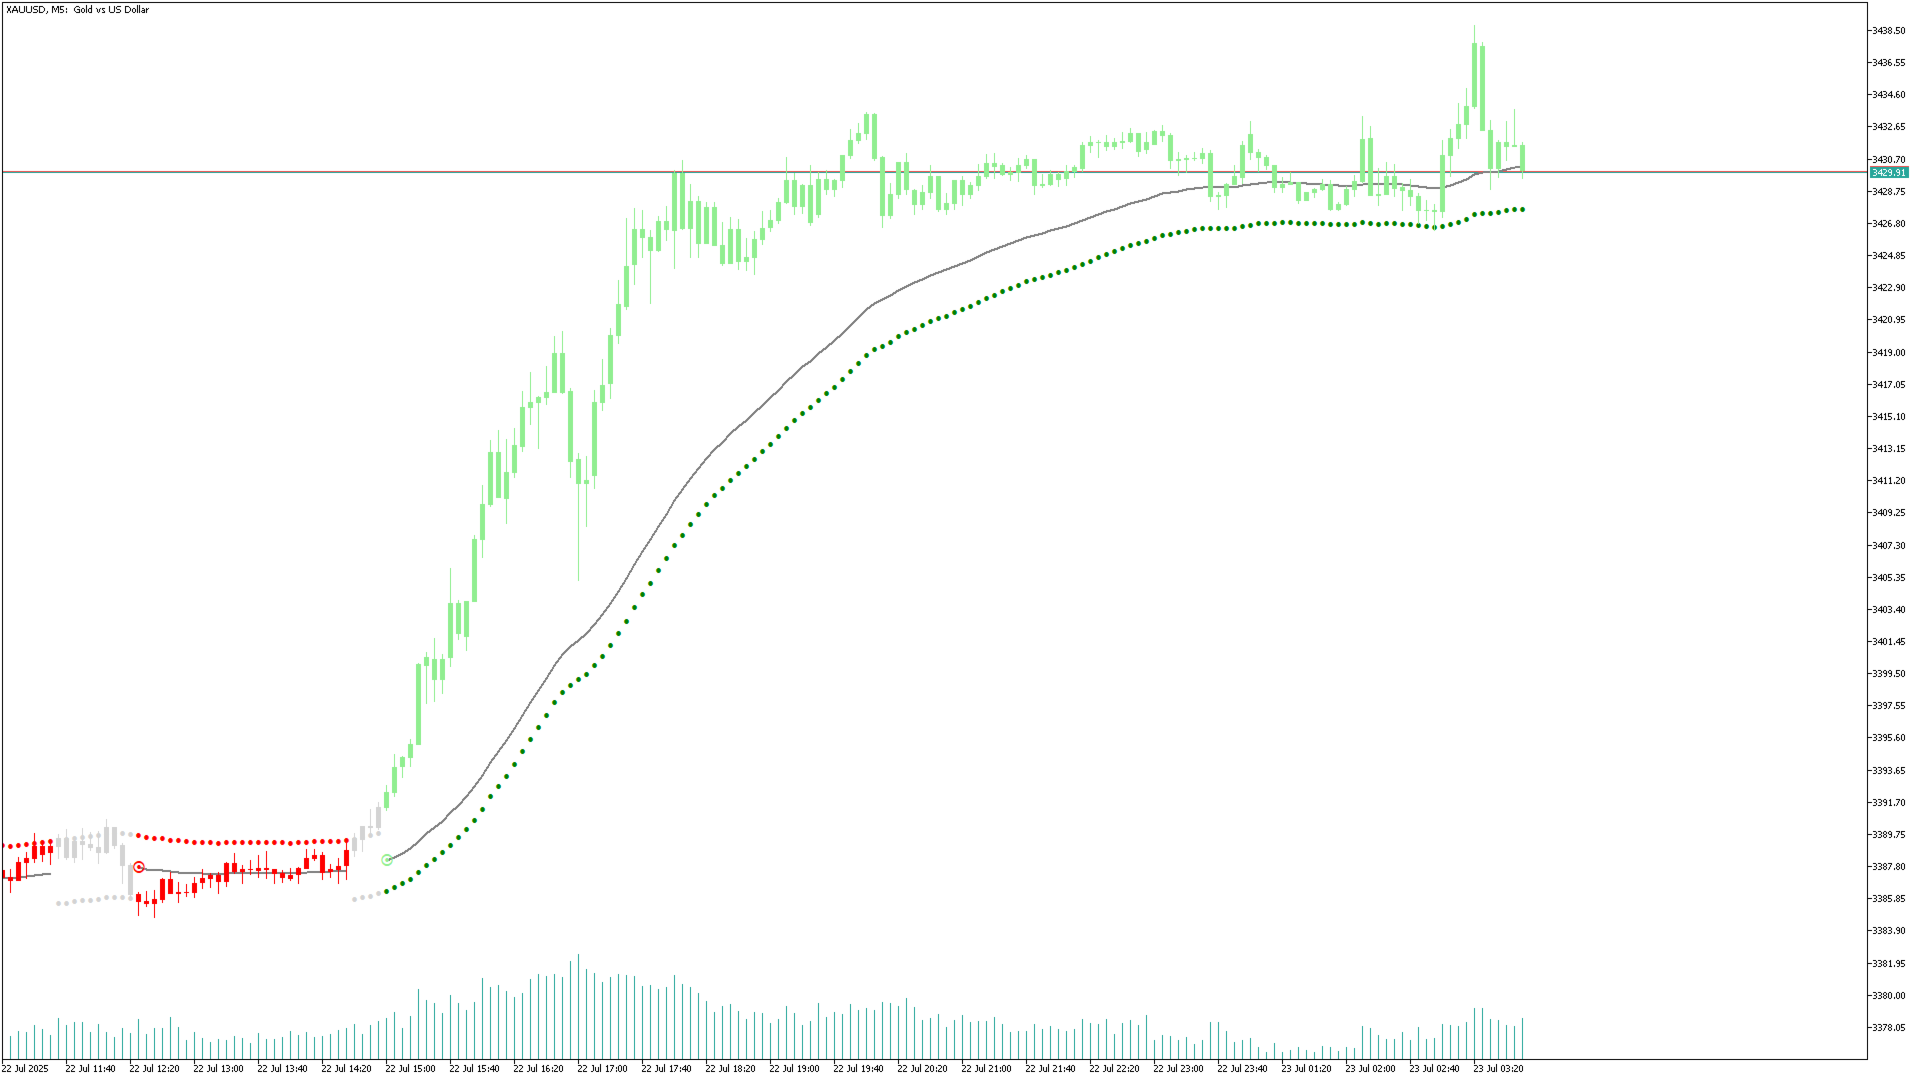
Range Filtered AlgoAlphaは、市場のボラティリティを分析することで潜在的な取引機会を特定するためのテクニカル分析ツールです。このMetaTrader向けAlgoAlphaオリジナルTradingViewインジケーターの改訂版は、複数の分析方法を組み合わせて視覚的な市場評価を提供します。
技術的特徴
価格平滑化にカルマンフィルター(Kalman Filtering)を採用
ボラティリティ測定にATRベースバンド(ATR-based Bands)を統合
トレンド分析にスーパートレンド(Supertrend)要素を組み込み
カラーろうそく足(Candles)とマーカー(Markers)で視覚的シグナルを提供
設定可能なアラート機能(Configurable Alerts)を装備
機能性
当インジケーターは市場データを処理し以下を実現:
ATR(平均真の範囲)を使用したボラティリティレンジ計算
市場ノイズ低減のためのフィルタリング技術(Filtering Techniques)適用
視覚的要素(Visual Elements)による潜在的なトレンド方向の表示
使用事例
ボラティリティベース取引戦略(Volatility-based Trading)に有用
各種銘柄のテクニカル分析(Technical Analysis)補助ツールとして使用可能
市場状況の視覚的参照ポイント(Visual Reference Points)を提供
免責事項
取引には重大なリスクが伴います。本インジケーターは情報提供のみを目的としており、取引決定の責任は利用者にあります。