KT Auto Fibo
- インディケータ
- バージョン: 1.1
- アップデート済み: 25 3月 2022

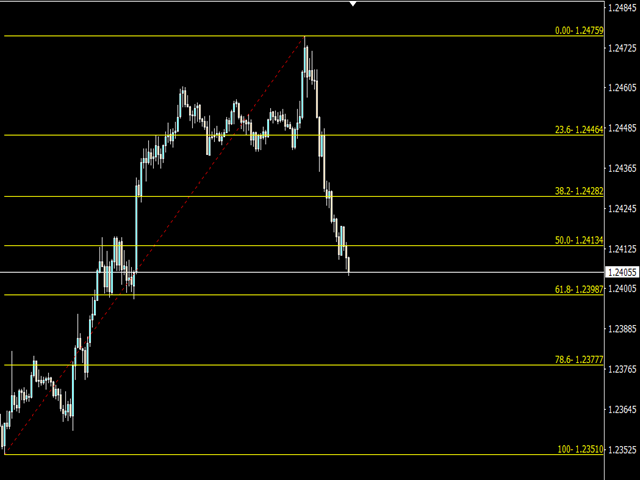
O KT Auto Fibo desenha automaticamente os níveis de retração de Fibonacci com base na direção atual da tendência. Os pontos máximos e mínimos são selecionados automaticamente usando os valores máximos e mínimos disponíveis no gráfico. Você pode dar zoom e rolar o gráfico para ajustar os níveis de Fibonacci conforme necessário.
Modos
- Automático: Desenha automaticamente os níveis de Fibonacci com base na área do gráfico.
- Manual: Desenha os níveis de Fibonacci apenas uma vez. Depois disso, você pode alterar manualmente os pontos de ancoragem.
Uso:
- Ajuda a prever logicamente os futuros alvos de lucro.
- Alta possibilidade de reversão quando combinado com suportes/resistências ou linhas de tendência.
- Proporciona entradas de baixo risco em mercados de tendência.
Parâmetros de entrada
- Automático: Desenha os níveis de retração de Fibonacci sem necessidade de intervenção humana.
- Manual: Desenha os níveis de retração de Fibonacci apenas uma vez. Depois disso, você pode esticar os pontos de ancoragem manualmente.
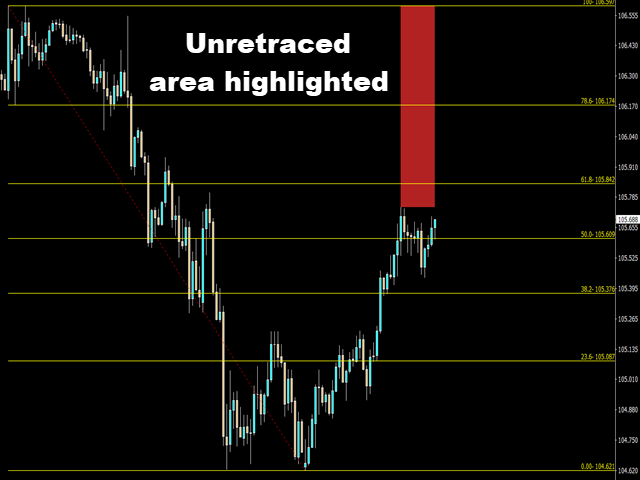
- Mostrar área não retraçada: Exibir/ocultar a área no gráfico que ainda não foi tocada pela retração do preço.
- O restante das configurações é autoexplicativo.