KT Heiken Ashi Smoothed MT4
- インディケータ
- バージョン: 1.5
- アップデート済み: 10 5月 2022
- アクティベーション: 10

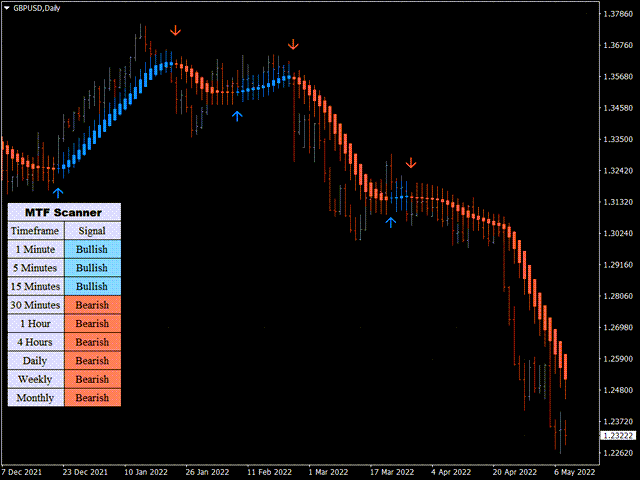
KT Heiken Ashi Smoothed は、標準の Heiken Ashi をさらに平滑化したバージョンであり、トレンド転換時には買い/売り矢印も表示します。シンプルながら実践的なこのインジケーターは、市場の微妙な変化を視覚的に捉えたいトレーダーに最適です。
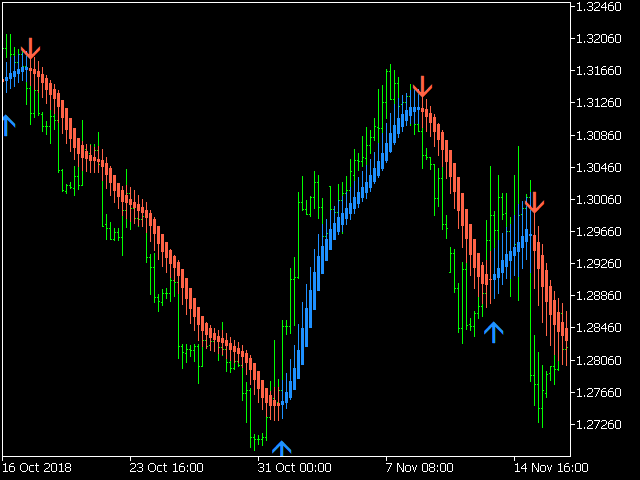
- 状態がベアからブルに変わると買い矢印を描画します。
- 状態がブルからベアに変わると売り矢印を描画します。
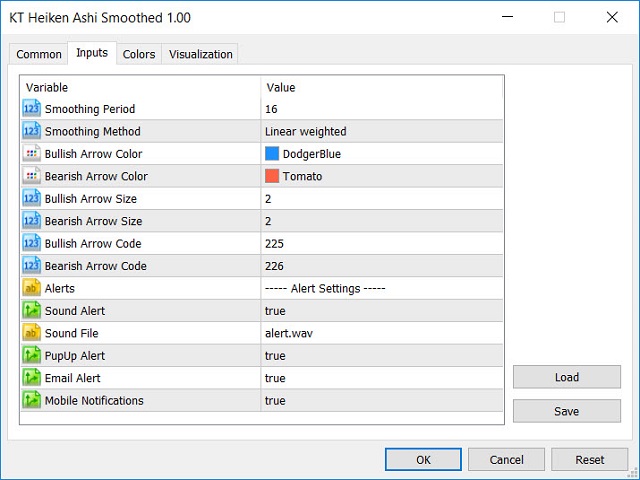
- モバイル通知・メール・サウンド・ポップアップの各種アラートに対応。
Heiken Ashi Smoothed とは?
標準 Heiken Ashi に見られるノイズやダマシを排除するため、2 本の移動平均を重ねてローソク情報を滑らかにしています。多少の遅延はあるものの、スイングポイントや新たなトレンドの兆しを視覚化でき、肉眼では捉えにくい価格のリズムを浮き彫りにします。得られたヒントを活用すれば、エントリー/エグジット戦略やリスク管理の精度を高められます。
活用例
本インジケーターは FX、コモディティ、株式など幅広い市場で利用できます。以下はトレード機会を探る際の主なポイントです。
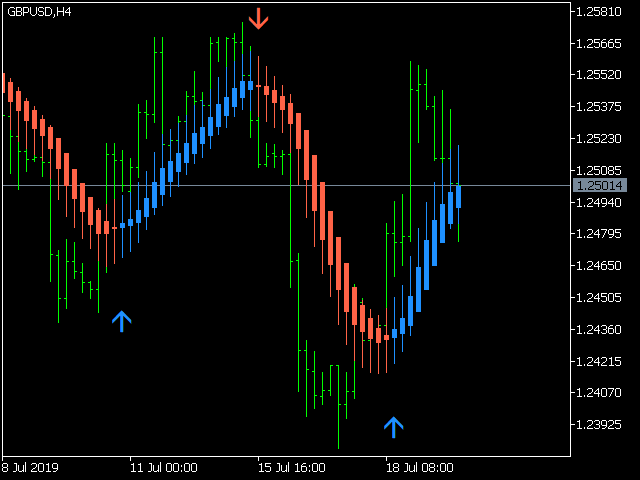
- 下ヒゲのない青いローソク足は力強い上昇トレンドを示唆。
- 上ヒゲのない赤いローソク足は力強い下降トレンドを示唆。
- トレンド反転は、上下に長いヒゲを持つ小さな実体のローソク足でしばしば発生します。


ユーザーは評価に対して何もコメントを残しませんでした