Matrix indicator for MT5 by ITC
- インディケータ
-
Renaud Herve Francois Candel
 ITC SOFTWARE is a technology company based in the United States since 2010.
🟠🔴 The company develops financial software and indicators for different trading platforms:
-Metatrader 4 and Metatrader 5
-TradingView
-NinjaTrader - バージョン: 1.10
- アップデート済み: 4 7月 2023
- アクティベーション: 5
Matrix Indicator
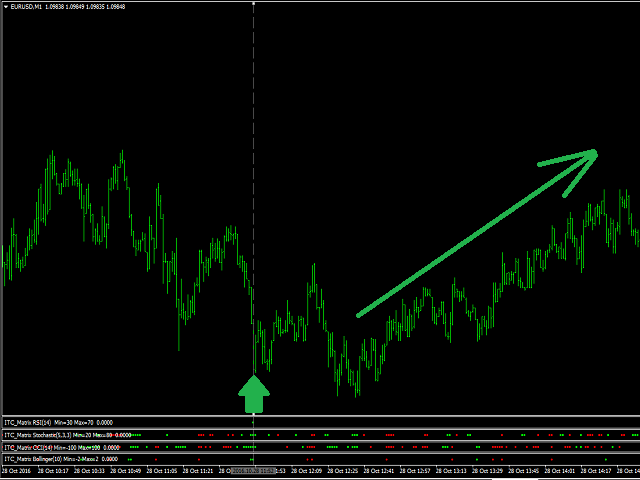
Matrix Indicator is a simple but effective indicator.Matrix indicator displays usual oscillators indicators in a user friendly color coded indicator.
This makes it easy to identify when all indicators are aligned and spot high probability entries.
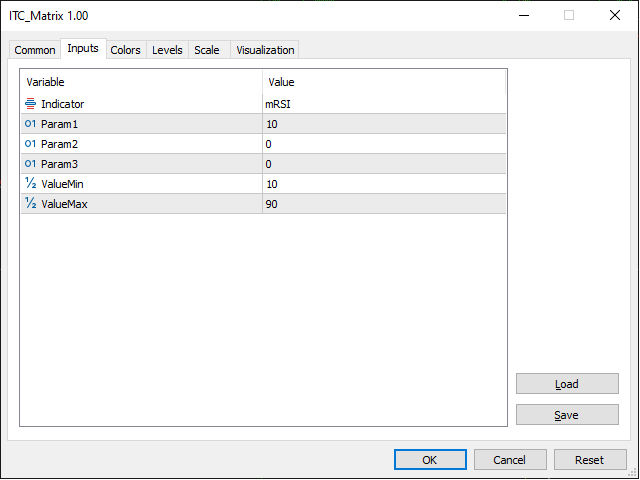
Inputs of indicator are:
- Indicator: RSI, Stochastic, CCI, Bollinger Bands
- Param1/Param2/Param3: usual settings for the indicator
- ValueMin: Oversold level for oscillator
- ValueMax: Overbought level for oscillator
Example of settings for the indicator:
- Indicator=RSI
- Param1=14
- ValueMin=10
- ValueMax=90
- Indicator=Stochastic
- Param1=5
- Param2=3
- Param3=3
- ValueMin=20
- ValueMax=80
- Indicator=CCI
- Param1=14
- ValueMin=-100
- ValueMax=100
- Indicator=Bollinger
- Param1=20
- ValueMin=-2.0
- ValueMax=2.0
Other indicators for MT4:
We developed more than 60 indicators and utilities for Metatrader 4 and Metatrader 5.
Indicators for MT5:
All our indicators are developed both for MT4 and MT5.
List of all our indicators:
👉 You can get the complete list of our indicators visiting our profile page.