Energy Gravity

Energy Gravity — User Guide

Energy Gravity is a structural market analysis tool that visualizes the hidden energetic geometry of price.

The indicator treats the market as a dynamic field of distributed mass, where past price interaction forms:

  • attraction zones

  • equilibrium areas

  • structural tension

  • probable return directions

Core concept:

Price does not move randomly — it interacts with accumulated liquidity and time.

Energy Gravity shows where equilibrium is located, where liquidity is concentrated, and how far the current price has deviated from the structural environment.

What the Indicator Shows

1. EQ — Gravity Center

The blue EQ (Equilibrium) line represents the center of price distribution.

It reflects:

  • the current market balance point

  • the environment price tends to return to

  • dynamic shifts when a new structure forms

Interpretation:

  • price near EQ → balanced market

  • price far from EQ → increasing structural tension

  • EQ moving with price → a new structure is forming

2. Z-Zones — Structural Nodes

The indicator automatically detects areas where price spent the most time.

Labels:

  • Z1 — strongest liquidity zone (primary magnet)

  • Z2, Z3… — secondary zones

  • ZxH — upper boundary of the zone

  • ZxL — lower boundary

These zones represent:

  • natural support and resistance

  • return areas

  • liquidity accumulation regions

Interpretation:

  • movement inside the zone → range behavior

  • break outside boundaries → potential impulse

  • return to zone → structural retest

3. ACTIVE — Active Zone

When price is inside a zone, the label ACTIVE appears.

This means:

  • local balance

  • structural trading environment

  • higher probability of range movement

4. Heatmap — Density Field

The heatmap displays the distribution of market “mass”:

  • red / yellow — strong attraction zones

  • green / blue — weak structure

  • price moves faster through low-density areas

Practical insight:

If there is little density ahead, the move may continue without significant pullbacks.

5. Gravity Force and Bias

The panel shows:

Gravity

  • direction of structural pull

  • strength of deviation from equilibrium

Bias

  • direction of structural attraction (UP / DOWN)

  • current structural target

6. Target Hierarchy

Energy Gravity automatically determines the nearest structural objective.

Logic:

  1. If price is inside a zone → target = zone center

  2. If outside zones → target = nearest zone

  3. If no zones nearby → target = EQ

Displayed as:

Bias: UP → Target: Z1 (1.0850)

This indicates where the market is structurally “pulled”.

Market States

Energy Gravity identifies the current market phase:

BALANCE

Price near EQ.
Range conditions likely.

ORBIT

Price inside a liquidity zone.
Range trading environment.

STRETCH

Price deviated from structure.
Higher probability of mean reversion.

ESCAPE

Price left the structure.
Impulse movement, new environment forming.

How to Read the Indicator

Step 1 — Context

Start with State:

  • BALANCE / ORBIT → range environment

  • STRETCH → deviation

  • ESCAPE → impulse phase

Step 2 — Structure

  • EQ — global equilibrium

  • Z1 — primary liquidity magnet

  • ACTIVE — local balance area

Step 3 — Tension

Gravity Force:

  • low → balance

  • medium → stretch

  • high → impulse

Step 4 — Targets

Bias + Target show:

  • direction of structural pull

  • nearest structural objective


Practical Applications
  • Finding mean-reversion areas

  • Trading inside structural ranges

  • Filtering false breakouts

  • Evaluating move strength

  • Identifying market context

  • Directional filter for strategies

  • Structural input for Expert Advisors

Energy Gravity is not a signal generator.
It is a tool for understanding market structure and tension.

Recommended Timeframes

Most stable performance:

  • H1 — primary mode

  • M30 — active intraday trading

  • H4 — medium-term context

On M1–M5 the indicator is more sensitive to noise.

Main Settings

History Bars

Amount of data used for structure calculation

Recommended:

  • H1: 700–1000

  • M30: 1000–1500

  • H4: 400–600

Lower value → faster adaptation
Higher value → more stable structure

Decay Factor

Speed of memory decay

  • higher → faster reaction

  • lower → longer-term structure

Recommended:

  • H1: 0.002–0.004

  • M30: 0.003–0.006

  • H4: 0.001–0.002

Level Step

Structure resolution

  • smaller → more detail, more noise

  • larger → major zones only

Recommended:

  • H1: 40–60 points

  • H4: 80–150 points

Min Mass Threshold

Filter for significant zones

Recommended range:
0.015–0.03

Heatmap Range

Visualization range around current price

Recommended:
H1: 800–1500 points

Reducing the value improves performance.

Typical Scenarios

Mean Reversion

  • State = STRETCH

  • price outside dense zones

  • target = structural Target

Trend Filter

  • State = ESCAPE

  • trade in direction of movement

  • avoid counter-trend trades

Range Trading

  • State = BALANCE or ORBIT

  • trade inside structural boundaries

Key Idea

Energy Gravity does not predict the market.
It reveals its structure.

The indicator helps answer:

  • Where is equilibrium?

  • Where is liquidity located?

  • Is structure nearby?

  • How far is the market stretched?

  • Is continuation or return more likely?


おすすめのプロダクト
Advanced Trading Chaos  The main purpose of the indicator is to help the trader detect the signals described by Bill Williams in his books to make a quick and correct trading decision. 1)Bullish/Bearish Reversal Bar(BDB) 2) Divergent Bar(DB) 3) Second Sage Signal — the third consecutive Awesome Oscillator bar  4) Working fractals (Fractals that worked above/below the red forehead  5) Three bar coloring modes 5.1) Coloring of bars according to the AO indicator (Including the squatting bar) 5.2
Divergence Matrix Pro for MetaTrader 5 Divergence Matrix Pro is a confirmed multi-oscillator divergence indicator for MetaTrader 5. It detects regular and hidden divergence between price and selected oscillators, then presents the confirmed structure through divergence lines, pivot labels, action markers, an optional current-timeframe Matrix Panel and optional alerts. The indicator is an analysis and confirmation tool. It does not open or close trades, and the signal score is not a win rate or a
Ichimoku Kinko Hyo is a purpose-built trend trading charting system that has been successfully used in nearly every tradable market. It is unique in many ways, but its primary strength is its use of multiple data points to give the trader a deeper, more comprehensive view into price action. This deeper view, and the fact that Ichimoku is a very visual system, enables the trader to quickly discern and filter "at a glance" the low-probability trading setups from those of higher probability. This i
Radar Trade Analytic
Jeverson Rodrigues Ferreira
Radar Trade Analytic 2.0 – MT5用クオンツパネル Radar Trade Analyticとは? Radar Trade Analyticは、Radar Tradeエコシステムのクオンツ(定量分析)モジュールです。メインチャートの下に独立したウィンドウで表示され、同一の独自エンジン「Sigma」で構築された4つの同期レイヤーを表示します。チャート上で見えるものとパネルで読み取れるものが直接対応することを保証しています。 売買シグナルはありません。ターゲットもありません。アラートもありません。Radar Trade Analyticは本当に重要なデータだけを整理し、明確な判断ができるようにします。 バージョン2.0での変更点 # 改善点 旧バージョン (1.00) バージョン2.0 1 Delta Flow (CVD) M1足のみを使用して計算(下位時間足での推定値) TICK_FLAG_BUY/SELLフラグ付きティックによる実際のアグレッション・デルタ。プロ向けプラットフォームと同じデータを使用 2 自動フォールバック M1が利用できな
Sqn Max Indicator Sqn Max is an exclusive indicator to trade the market with high effectiveness. The indicator is based on price action, volatility and trend. This indicator is as simple as possible but not too simple. The indicator can generate alerts to ease the trading process. You don't have to stay all day in front of your screen. The indicator can be used with any class of assets and with any time frame. It is possible to achieve better results trading our list of selected assets. We achi
トレンド、ロケーション、モメンタムを総合的に評価し、0~100のトレードス​​コアで表示するマルチマーケット・マルチタイムフレーム対応のスキャナー。適応型レジーム検出機能と内蔵ノイズフィルターを搭載。FX、仮想通貨、指数、貴金属、原油など、最大10銘柄を同時にスキャンします。 詳細説明 APEXマルチマーケットスキャナー ― チャートを何度もめくる必要はありません。市場全体を一度に把握できます。 APEXは、最大10銘柄(FX主要通貨ペア/マイナー通貨ペア、仮想通貨、指数、金、銀、原油)を同時にスキャンするプロ仕様のダッシュボードです。各チャート上のあらゆる情報を、トレードス​​コア(0~100)という単一の数値に集約します。 多くのスキャナーはクロスラインを表示するだけですが、APEXはなぜ今その銘柄が重要なのか、そしていつその銘柄を放置すべきなのかを明確に示します。 思考プロセス: レジーム検出 — APEXはまず、ADXとATRを用いて各銘柄を5つの市場状態(トレンド、レンジ、ブレイクアウト、ボラティリティ、コンプレッション)のいずれかに分類します。トレンドで有効
How To Determine If The Market is Strong Or Weak? Strength Meter uses an Adaptive Algorithm That Detect Price Action Strength In 4 Important Levels! This powerful filter gives you the ability to determine setups with the best probability. Features Universal compatibility to different trading systems Advance analysis categorized in 4 levels Level 1 (Weak) - Indicates us to WAIT. This will help avoid false moves Weak Bullish - Early signs bullish pressure Weak Bearish - Early signs bearish press
Boom & Crash & PainX & GainX Ultimate Spike Detector Trade Spikes With Confidence — Not Guesswork Catching spikes should be one of the most profitable strategies in synthetic markets. But for most traders, it becomes one of the most frustrating. You enter too early… price goes against you. You wait for a spike… it never comes. You finally catch one… but don’t know whether to hold or close. You make profit… then give it all back because there’s no exit plan. This is exactly the problem the Ultim
# DRAWDOWN INDICATOR V4.0 - The Essential Tool to Master Your Trading ## Transform Your Trading with a Complete Real-Time Performance Overview In the demanding world of Forex and CFD trading, **knowing your real-time performance** isn't a luxury—it's an **absolute necessity**. The **Drawdown Indicator V4.0** is much more than a simple indicator: it's your **professional dashboard** that gives you a clear, precise, and instant view of your trading account status. --- ## Why This Indicator
Neon Stoch Div — World Investor Neon Stoch Div is an advanced indicator for MetaTrader 5 that detects regular and hidden divergences using the Stochastic Oscillator (%K/%D). Designed to accurately identify price exhaustion zones, it combines high-quality technical analysis with a Midnight Neon visual interface optimized for extended trading sessions. What does it do? It compares price pivots with those of the Stochastic Oscillator to detect bullish and bearish divergences, both regular and hi
Triangle Pattern Gann v3.1 - Complete Feature Documentation Core Functionality OverviewTriangle Pattern Gann v3.1 is a sophisticated MetaTrader 5 indicator that combines W.D. Gann's geometric trading principles with advanced triangle pattern recognition to deliver actionable trading signals. Primary Features1. Triangle Pattern Detection SystemAscending Triangle Recognition Function: Automatically identifies bullish continuation patterns Detection Criteria: Flat horizontal resistance line
GoldPro Max
Taher Ahmed Mohamed Taha Elshafei
GOLDPRO MAX Advanced Multi-Timeframe and Smart Money Market Analysis for MetaTrader 5 GoldPro Max is a professional market analysis indicator for MetaTrader 5 designed to help traders study market direction, price structure, liquidity, market imbalance and potential trading areas from multiple perspectives. The indicator combines Multi-Timeframe Analysis, Smart Money Concepts, Market Structure, Liquidity Analysis, Order Blocks, Fair Value Gaps, Premium and Discount analysis, Smart Analytical Eng
Cosmic Scalper
Pieter Gerhardus Van Zyl
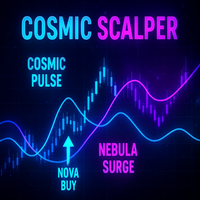
Cosmic Scalper – MT5 A multi-layer momentum engine designed to track short-, medium- and long-range volatility shifts. It plots three pairs of dynamic trend lines: Cosmic Pulses (bullish drift) and Nebula Surges (bearish drift). These lines adjust using ATR-based quantum ranges, galactic high/low scans, and trend-biased filtering. When strength conditions align, the indicator prints Nova Buy or Supernova Sell dots, factoring wick structure, volatility bursts, candle body expansion, future midpoi
Description : Rainbow EA MT5 is a simple Expert advisor based on   Rainbow MT5 indicator witch is based on Moving average with period 34. The indicator is incorporated in the EA, therefore, it is not required for the EA to operate, but if you wish, you can download it from   my product page . The Expert Advisor settings are as follows : Suitable for Timeframes up to H1 The parameters below can be set according to your trading rules. StopLoss ( Stop Loss in pips) TakeProfit ( Take Profit in pips
Fit line supports to extrapolation next movement of market, support for buy/sell decision. Indicator using spline algorithm to extrapolation.  You can change number of spline with parameter "PointsNumber" and number of extrapolation point with "ExtrapolateBars". Eextrapolation points will be save into csv format, with prefix in parameter "PointsPrefix", and store in folder File of Data Folder.
The   Pure Price Action ICT Tools   indicator is designed for pure price action analysis, automatically identifying real-time market structures, liquidity levels, order & breaker blocks, and liquidity voids. Its unique feature lies in its exclusive reliance on price patterns, without being constrained by any user-defined inputs, ensuring a robust and objective analysis of market dynamics.   MARKET STRUCTURES A Market Structure Shift, also known as a Change of Character (CHoCH), is a pivota
Type: Oscillator This is Gekko's Cutomized Moving Average Convergence/Divergence (MACD), a customized version of the famous MACD indicator. Use the regular MACD and take advantage of several entry signals calculations and different ways of being alerted whenever there is potential entry point. Inputs Fast MA Period: Period for the MACD's Fast Moving Average (default 12); Slow MA Period: Period for the MACD's Slow Moving Average (default 26); Signal Average Offset Period: Period for the Signal A
Confluence Edge Indicator Confluence Edge Indicator is a powerful all-in-one technical analysis tool designed to provide a complete multi-timeframe view of market conditions. It removes the need for multiple chart indicators by combining proven trading methodologies into a single, clean, intuitive dashboard. Built for traders who rely on confluence, this indicator delivers real-time analysis using price action, volume, momentum, market structure, and algorithmic scoring concepts. It is designed
製品概要 KMB Smart Pattern Analyzer PRO は、ユーザーが指定したチャート範囲内で市場パターンを検出し、技術的な一致度に基づいてランキングする高度なテクニカル分析インジケーターです。 複数の分析エンジンを1つのプロフェッショナルなツールに統合しています。 ローソク足パターン分析 クラシックチャートパターン認識 ハーモニック構造検出 市場構造 / SMC分析 チャート全体にランダムなシグナルを表示するのではなく、ユーザーが指定した市場エリアに集中し、最も強いパターン候補、方向性、ブレイクアウトレベル、無効化レベル、予測ターゲットゾーンを構造的に分析します。 主な機能 最も一致度の高い Top 3パターン を検出・ランキング 対応分析: ローソク足パターン クラシックチャートパターン ハーモニックパターン Market Structure / SMC ユーザー指定範囲の分析 以下を表示: パターンタイプ 市場方向 Score Momentum Breakoutレベル T1 / T2 / T3ターゲット Invalidationレベル Structure情報 選択
Harvester Pro Universal Master The Ultimate Volatility Breakout & Trend-Following Solution for XAUUSD and Major Pairs. Harvester Pro Universal Master is a professional-grade Expert Advisor (EA) engineered for high-performance trading on the MetaTrader 5 (MT5) platform. Optimized specifically for XAUUSD (Gold) and major currency pairs like EURUSD , this EA combines a sophisticated Volatility Breakout engine with a robust EMA/TEMA Trend-Following filter to capture explosive market moves with surg
* Professional Smart Money indicator for M15. * Non-repaint. * Order Blocks, FVG, Liquidity, BOS, Session/Kill Zone filter, Premium/Discount zones, 7-point confluence, Win Rate tracker. User Guide  https://www.mql5.com/en/blogs/post/768304 WHY M15 ONLY? — THE STRATEGIC ADVANTAGE Most indicators try to work on every timeframe and end up performing poorly on all of them. SMC Pro takes the opposite approach: one timeframe, perfected. WHY M15 WAS CHO
平均方向性指数(ADX)マルチカレンシースキャナー MT5 は、複数の通貨ペアを同時に分析するために設計された高度なトレーディングインジケーターです。これは、平均方向性指数に基づくリアルタイムのシグナルを提供することで、意思決定プロセスを強化したいトレーダーに利益をもたらし、効率的な市場トレンド分析を可能にします。 このツールは、トレンドの強さと方向の動きを簡単に特定できるようにし、ADXに基づく戦略を採用するトレーダーにとって不可欠な資産となっています。リアルタイムのアラートとユーザーフレンドリーなダッシュボードを備え、トレーダーは市場の状況を迅速に評価し、情報に基づいた取引選択を行うことができます。 MQL製品のインストールガイド | MT4/MT5で購入したMQL製品の更新 | 一般的なトラブルシューティングガイド | インジケーター設定 / ガイド 主な機能 バッファ統合: インジケーターの値をアクセス可能なバッファとして公開し、Expert Advisorが自動取引のためにシグナルデータを利用できるようにします。 視覚的矢印シグナル: シグナルキャンドルのチャート上に明確なB
Gecko EA MT5
Profalgo Limited
5 (1)
NEW PROMO: Only a few copies copies available at 349$ Next price: 449$ Make sure to check out our " Ultimate EA combo package " in our   promo blog ! Gecko runs a simple, yet very effective, proven strategy.  It looks for important recent support and resistance levels and will trade the breakouts.  This is a "real" trading system, which means it will use a SL to protect the account.  It also means it will not use any dangerous techniques like martingale, grid or averaging down. The EA shows its
Fimathe Viewer Indicator
Jose Ricardo Guilherme Ferreira
FIMATHE INDICADOR - MASTER THE TECHNIQUE WITH PRECISION No mather if you are looking for a Fimathe indicator, Fimathe PCM or Fimathe channel visualzer, Stop wasting time with manual drawings.  FimatheViewer  is the ultimate productivity tool for traders using the Fimathe method. It automates your mapping, projections, and zones instantly.   KEY BENEFITS: Instant Mapping:  Auto-calculates Expansion, Neutral Zones, and Take Profit levels. Dynamic Channels:  Simply move your reference channel and
Mega Spikes Max
Niccyril Chirindo
2.33 (3)
Mega Spikes Max is a specialized indicator for Boom and Crash synthetic indices that generates trading signals with automatic alert notifications. Features The indicator analyzes market conditions using proprietary algorithms and displays buy/sell arrows directly on the chart. It works specifically with Boom and Crash indices on M5 timeframe. Signal generation combines multiple technical analysis methods to identify potential trading opportunities. The system provides two TP levels and SL calcu
HAS RSI Signal — SL/TP自動計算機能付き プロフェッショナル・トレンドインジケーター HAS RSI Signal は、信頼性の高いクラシックな手法と最新のノイズ除去アルゴリズムを融合させた強力なトレーディングツールです。 平均足スムーズド(Heiken Ashi Smoothed) と RSI を組み合わせることで、トレンドの転換点や買われすぎ・売られすぎ圏からの脱出タイミングを正確に捉え、明確なエントリーシグナルを提示します。 主な特徴: 二重のフィルタリング: 平均足スムーズドで市場の「ノイズ」を除去し、RSIで勢い(モメンタム)の強さを確認します。 損切り・利確ラインの自動計算: 単にシグナルを出すだけでなく、ボラティリティ( ATR )に基づいた最適なストップロス(SL) と テイクプロフィット(TP)を自動で算出します。 視覚的な分かりやすさ: シグナルはチャート上にカラーキャンドルとして表示されるため、一目でトレンドを把握でき、取引画面をスッキリと保てます。 充実の通知機能: アラート、音声、スマートフォンへのプッシュ通知機能を搭載。チャンスを逃すこと
Engulfing with EMAs Indicator Unlock the power of advanced candlestick pattern detection with the Engulfing with EMAs Indicator , a cutting-edge tool designed for MetaTrader 5. This futuristic indicator combines the precision of engulfing pattern analysis with the trend-following strength of Exponential Moving Averages (EMA 21 and EMA 50), empowering traders to identify high-probability setups across all currency pairs and timeframes. Key Features: Comprehensive Engulfing Detection : Detects b
概要 ATRマルチレベルおよび移動平均バンドインジケーターは、トレーダーが市場のトレンド、サポートおよびレジスタンスレベル、ボラティリティを特定するのを支援する強力なツールです。このインジケーターは、価格変動の周りにビジュアルバンドを作成するために、複数の移動平均とATR(平均真の範囲)乗数を組み合わせています。これにより、トレーダーは潜在的な反転ポイント、トレンド条件、および市場の統合ゾーンを検出するのに役立ちます。 特徴 複数バンドの視覚化: トレンドを簡単に識別するために、赤、オレンジ、黄色、緑、青、紫などの異なる色で、6つの動的バンドを表示します。 ATRボラティリティバンド: 市場のボラティリティに基づいてバンドのグラフを調整し、反転または価格の継続の可能性について明確な視覚的信号を提供します。 カスタマイズ可能なパラメーター: ATR乗数と移動平均の期間を調整可能で、市場の異なる条件やトレーディング戦略に適応します。 トレンドの明確な識別: バンドはボラティリティに応じて拡張および収縮し、トレーダーがトレンド、統合期間、および潜在的なブレイクポイントを簡単に視認できます。
FREE
Smart Sweep Sniper: Midnight Open PRO Edition The ultra-specialized institutional tool for Day Trading and Prop Firms If you like it, please leave a positive review to support our work; if you encounter any problems, please let us know. This Midnight Open edition marks a radical evolution. It abandons generalist macro-economic analysis to become an instrument of surgical precision, focused exclusively on intraday reactivity and the pinpoint exploitation of the midnight opening price (NY). Desig
インディケータは現在のクオートを作成し、これを過去のものと比較して、これに基づいて価格変動予測を行います。インジケータには、目的の日付にすばやく移動するためのテキスト フィールドがあります。 オプション: シンボル - インジケーターが表示するシンボルの選択; SymbolPeriod - 指標がデータを取る期間の選択; IndicatorColor - インジケータの色; HorisontalShift - 指定されたバー数だけインディケータによって描画されたクオートのシフト; Inverse - true は引用符を逆にします。false - 元のビュー。 ChartVerticalShiftStep - チャートを垂直方向にシフトします (キーボードの上下矢印)。 次は日付を入力できるテキストフィールドの設定で、「Enter」を押すとすぐにジャンプできます。
このプロダクトを購入した人は以下も購入しています
この製品は 2026 年の市場向けに更新され、最新の MT5 ビルドに最適化されています。 価格更新のお知らせ: Smart Trend Trading System は現在 $99 で提供されています。 次の 30 件の購入 後、価格は $199 に上がります。 特別オファー: Smart Trend Trading System を購入後、私にプライベートメッセージを送ることで、 Smart Universal EA を無料 で受け取り、Smart Trend のシグナルを自動売買に変えることができます。 Smart Trend Trading System は、リペイントなし、再描画なし、遅延なしの完全なトレーディングシステムです。よりクリーンなシグナル、より明確なトレンド方向、そしてより整理された取引方法を求めるトレーダー向けに作られています。   [User Manual]   ,  [PDF]  ,   [Installation manual]   and  [Online course] このシステムは、トレンド検出、反転ゾーン、Smart Cloud、トレーリングス
Trend Sniper X
Sarvarbek Abduvoxobov
5 (11)
Trend Sniper X は、MetaTrader 5 用のマルチタイムフレーム・トレンドフォロー・インジケーターです。トレーダーがトレンドの方向性と反転ポイントを明確かつ正確に特定できるよう支援します。 価格情報: 現在の価格はキャンペーン価格であり、今後のアップデートや新機能のリリースに伴い変更される可能性があります。 Code2Profit チャンネル マルチタイムフレーム分析で相場をマスターしよう! Trend Sniper X で勝率を最大化する方法:重要なルールとセッションのコツ 技術仕様 プラットフォーム MetaTrader 5 インジケータータイプ マルチタイムフレーム・トレンドインジケーター 操作タイムフレーム あらゆるチャートタイムフレームに対応。個別に選択可能な上位タイムフレーム (M1–MN1) を搭載 主要銘柄 FX、ゴールド (XAUUSD)、およびその他のCFD 推奨口座 あらゆる口座タイプに対応 視覚化 色分けされたトレンドローソク足 (買い/売り/弱気/変化) + 買い/売り矢印 追加モジュール セッション市場ボックス (シドニー、東京、ロンドン
Welcome to ENTRY IN THE ZONE AND SMC MULTI TIMEFRAME Entry In The Zone and SMC Multi Timeframe is a real-time market analysis tool based on Smart Money Concepts (SMC), designed to analyze market structure, price direction, and key trading zones. It supports both Single-Timeframe Analysis and Multi-Timeframe Analysis, providing a clearer view of the overall market structure across multiple timeframes, with real-time BUY / SELL signals that do not repaint. It is designed to help filter trading opp
SuperScalp Pro
Van Minh Nguyen
4.61 (31)
SuperScalp Pro – プロフェッショナル多層コンフルエンス・スキャルピングシステム SuperScalp Pro は、複数のコンフルエンスを組み合わせたプロフェッショナル向けスキャルピングシステムです。より高い確率のトレードチャンスを見つけられるよう設計されており、明確なエントリー確認、ATRに基づくStop LossとTake Profit、さらにXAUUSD、BTCUSD、主要なFX通貨ペアに対応した柔軟なシグナルフィルター機能を提供します。 XAUUSD、BTCUSD、Forex 通貨ペア、指数向けの最適化された設定ファイルはこちらからご利用いただけます: [Set Files] SuperScalp Pro Auto Trader EA による自動売買が利用可能です: [Auto Trader] SuperScalp Pro の公式 MQL5 チャンネルをフォローして、製品のアップデート、ニュース、最新のお知らせをご確認ください: [Official Channel] SuperScalp Pro は、Supertrend、VWAP、EMA、RSI、ADX、出
まず正直に言いましょう。 どんなインジケーターも、それ単体であなたを利益化させることはできません。もしそう言う人がいるなら、それは夢を売っているだけです。完璧な売買シグナル(矢印)を表示するインジケーターは、いくらでも“完璧に見せる”ことができます。正しい過去の区間を拡大して、勝ちトレードだけを切り取ればいいだけです。私たちはそれをしません。 SMC Intraday Formula はツールです。 市場構造を読み取り、最も高い確率の価格ゾーンを特定し、今この瞬間のスマートマネーの痕跡をシンプルな言葉で正確に示します。最終判断はあなたが行います。トレードを実行するのもあなたです。しかし今は「希望」ではなく「精度」でエントリーできます。 私たちはこのインジケーターを、ゴールド(XAUUSD)および主要FX通貨ペアで約3年間、日々のスキャルピングに使用してきました。M1、M5、M15、M30の主要ツールです。これは未来を予測しようとするのではなく、今まさに形成されている高確率セットアップを示し、その理由を説明します。 他のすべてのインジケーターと何が違うのか? ほとんどのトレーディングイ
Neuro Poseidon is a new indicator by Daria Rezueva. It combines precise trading signals with adaptive TP/SL levels - creating best possible trades as a result! Message me and get  Neuro Poseidon Assistant  as a gift to automize your trading process! What makes it stand out? 1. Proven profitability on all assets and timeframes 2. Only confirmed BUY and SELL signals present on the chart 3. Adaptive TP & SL levels generated by the software for each trade 4. Easy to understand - suitable for al
時折、私自身もこのシステムを使って取引を行っています。 実口座での私の手動による「BOMBER」トレードをぜひご評価ください - LIVE SIGNAL このインジケーターを購入された方には、以下の特典を 無料 で提供しています: 各トレードを自動で管理し、ストップロスとテイクプロフィットを設定し、戦略ルールに基づいてポジションを決済する補助ツール 「Bomber Utility」 様々な銘柄に合わせたインジケーターの設定ファイル(セットファイル) 「最小リスク」、「バランスリスク」、「待機戦略」 の3つのモードで使用できる Bomber Utility 用の設定ファイル このトレーディング戦略をすぐに導入・設定・開始できる ステップバイステップのビデオマニュアル ご注意: 上記の特典を受け取るには、MQL5のプライベートメッセージシステムを通じて販売者にご連絡ください。 オリジナルのカスタムインジケーター 「Divergence Bomber(ダイバージェンス・ボンバー)」 をご紹介します。これは、MACDのダイバージェンス(乖離)戦略に基づいた 「オールインワン」型のトレーディン
伝説が帰ってきました:Entry Points Pro 10。 MQL5 Marketのトップ3に3年間入り続けた伝説的インジケーターの再始動です。 2つのバージョンで合計589件の高評価レビュー、毎日数千人のトレーダーが実際のトレードに使用し、デモのダウンロードは31,000件以上   MT4+MT5 。 私はこの5年間に寄せられたレビューをすべて読み、約束を並べる代わりに、その答えをバージョン10に組み込みました。1999年から相場に携わり、 誠実さ、自らの評判、そして顧客を大切にする 作者による製品です。 Entry Points Proのエントリーシグナルは、リペイント(再描画)を一切行いません。 そして今回初めて、これは作者の言葉ではなく検証可能な事実になりました。確定シグナルはローソク足の終値確定後にのみ表示され、自動テストで リペイントはゼロ と確認されています(EURUSD、XAUUSD、BTCUSDで2,486,568回の不変条件チェック、違反0件)。検証方法は公開されており、ストラテジーテスターでご自身で再現できます。 ご購入後は、必ずすぐにダイレクトメッセージでご
M1 SNIPER は使いやすいトレーディングインジケーターシステムです。M1時間足向けに設計された矢印インジケーターです。M1時間足でのスキャルピングのためのスタンドアロンシステムとして、また既存のトレーディングシステムの一部としても使用できます。このトレーディングシステムはM1時間足での取引に特化して設計されていますが、他の時間足でも使用できます。元々、この手法はXAUUSDとBTCUSDの取引用に設計しましたが、他の市場においても役立つと考えています。 インジケーターのシグナルは、トレンドの方向と逆方向に取引できます。インジケーターのシグナルを利用して両方向に取引するのに役立つ特別な取引テクニックをご紹介します。この手法は、特別な動的なサポートとレジスタンスの価格帯を利用することに基づいています。 ご購入後、M1 SNIPER矢印インジケーターをすぐにダウンロードできます。さらに、M1 SNIPERツールのすべてのユーザーに、以下のスクリーンショットに表示されているApollo Dynamic SRインジケーターを無料で提供しています。この2つのインジケーターを組み合わせることで
この製品は 2026 年の市場向けに更新され、最新の MT5 ビルドに最適化されています。 価格更新のお知らせ: Atomic Analyst は現在 $99 で提供されています。 次の 30 件の購入 後、価格は $199 に上がります。 特別オファー: Atomic Analyst を購入後、私にプライベートメッセージを送ることで、 Smart Universal EA を無料 で受け取り、Atomic Analyst のシグナルを自動売買に変えることができます。 Atomic Analyst は、リペイントなし、再描画なし、遅延なしの Price Action トレーディングインジケーターで、手動取引、シグナルの明確化、EA 自動化のために設計されています。 User manual: settings, inputs and strategy.   &   User Manual PDF . 価格行動、強さ、モメンタム、マルチタイムフレーム方向、高度なフィルターを分析し、トレーダーがノイズを減らし、弱いセットアップを避け、より構造化された取引判断を行えるようにします。 このイ
SUPERHEROインジケーターは、「オールインワン」方式に基づいて設計された多通貨対応の取引システムです。このインジケーターは市場を独自に分析し、取引の開始および終了のタイミングに関するシグナルを提供します。ストップロス注文とテイクプロフィット注文を使用します。R:R比率は1:1です。 私は時折、このシステムのシグナルに基づいて自ら取引を行いますが、その結果は以下の通りです— ライブシグナル このシステムはスマートフォンにプッシュ通知を送信できるため、PCに縛られることなく「外出先」からでも取引を行うことができます。自己勘定取引を行う企業に最適です。 すべてのお客様への特典: このインジケーターをご購入いただいたすべてのお客様に、私から特別なユーティリティをプレゼントいたします。その内容は以下の通りです: 自動的にストップロス注文とテイクプロフィット注文を発注します 価格が目標水準に達すると、自動的に取引を決済します 指値注文による取引に対応しています 平均化取引モードに対応しています この優れた、しかも非常に便利なユーティリティをプレゼントとして受け取りたい場合は、SUPERHER
UZFX {SSS} スキャルピング・スマートシグナル v4.0 MT5は、変動の激しい市場において正確かつリアルタイムのシグナルを求めるスキャルパー、デイトレーダー、スイングトレーダー向けに設計された、リペイントのない高性能な取引インジケーターです。(UZFX-LABS)によって開発されたこのインジケーターは、価格行動分析、トレンド確認、スマートフィルタリングを組み合わせることで、すべての通貨ペアおよび時間軸において、高確率の売買シグナル、警告シグナル、トレンド継続の機会を生成します。 トレードの判断に迷うのはもうやめましょう。明確さ、正確さ、そして規律ある市場執行を求めるトレーダーのために設計された、体系的なシグナルシステムに従い始めましょう。 私のおすすめ* 最適な時間足:15分足以上。 {H1} が私のお気に入りです。そして、その成果は驚異的です…!! 主な機能の更新 • 自動売買シグナル検出 • 高度な反転認識ロジック • 市場反転の可能性に先立つ早期警告シグナル • トレンド継続確認シグナル • エントリー、ストップロス、TP1、TP2、TP3レベルを備えた組み込み型
Gann Made Easy   は、ミスター・ギャンの理論を使用した取引の最良の原則に基づいた、プロフェッショナルで使いやすい外国為替取引システムです。 W・D・ガン。このインジケーターは、ストップロスとテイクプロフィットレベルを含む正確な買いと売りのシグナルを提供します。 PUSH通知を利用して外出先でも取引可能です。 ご購入後、取引方法の説明と優れた追加インジケーターを無料で入手するには、私にご連絡ください! おそらく、ギャンの取引手法についてはすでに何度も聞いたことがあるでしょう。通常、ギャンの理論は初心者のトレーダーだけでなく、すでにある程度の取引経験がある人にとっても非常に複雑なものです。なぜなら、ギャンの取引手法は理論的にはそれほど簡単に適用できるものではないからです。私はその知識を磨き、最良の原則を私の外国為替インジケーターに組み込むために数年を費やしました。 このインジケーターは非常に簡単に適用できます。必要なのは、それをチャートに添付し、簡単な取引推奨事項に従うだけです。このインジケーターは常に市場分析の仕事を行い、取引の機会を探します。適切なエントリーポイントを検
AXIOM MATRIX MT5 ローンチ価格:$99 Axiom Matrix はローンチ価格 $99 でご利用いただけます。 最初の30件の購入後、価格は $199 に上がります。 ご購入後、手順のご案内と限定ギフトボーナスの受け取りのために、直接DMをお送りください。 Axiom Matrix は、MetaTrader 5 用のプロフェッショナルなマルチシンボル・マルチタイムフレーム市場スキャナー兼意思決定ダッシュボードです。 Market Watch をスキャンし、複数の時間足を分析し、複数のエビデンスエンジンを読み取り、最も強いチャンスを比較し、1つのクリーンなマトリックスダッシュボード内で最適な BUY、SELL、WAIT、またはブロック状態を表示します。 私が Axiom Matrix を作った理由は、市場スキャンという重い作業を代わりに行ってくれる1つのツールが欲しかったからです。 RSI だけを確認したくありませんでした。 次に MACD だけ。 次に移動平均線。 次に出来高。 次にボラティリティ。 次にサポートとレジスタンス。 そして、1つのトレードアイデアを作るた
FiboSniper Pro – プロフェッショナル・マルチフィルター Fibonacci Grid トレーディングシステム FiboSniper Pro は、Fibonacci Envelopes と ADX、EMA、RSI、ATR、Time Filter などの多層フィルターを組み合わせた高度なテクニカル分析インジケーターシステムです。フィルタリングされたエントリー機会の特定をサポートし、ATR のボラティリティに基づいて Stop Loss と Take Profit レベルを自動的に計算します。特に M5 スキャルピング戦略を重視するトレーダー向けに設計されています。 購入後、Auto Trader X を使用して FiboSniper Pro のシグナルを自動売買する方法について、手順をご希望の場合は私までご連絡ください。 Auto Trader X による自動売買に対応: [Auto Trader X] ユーザーガイドと推奨セットファイルはこちら: [Click here] FiboSniper Pro MQL5 公開チャンネルに参加して、アップデートやニュースをご確認くだ
SkyHammer Signal Pro Entry、SL、TP レベルを固定表示する、プロ仕様のノーリペイント・トレンドシグナルインジケーター SkyHammer Signal Pro は、明確で固定され、検証可能なシグナルを求めるトレーダー向けに設計された、構造的なトレンド・モメンタム系シグナルインジケーターです。 特に M1 と M5 などの短期時間足で最も効果を発揮します。 このインジケーターは、天井や底を予測するためのものではありません。シグナルを出す前に、確認された市場構造、トレンド方向、モメンタムの強さ、健全なボラティリティ、そしてターゲットまでの十分な値幅を確認します。 主な機能 固定シグナルメカニズム シグナルが確認されると、矢印、Entry、Stop Loss、TP1、TP2 の各レベルはチャート上に永久的に固定されます。 その後のローソク足の動きによって、シグナルが消えたり、移動したり、変更されたりすることはありません。 これにより、トレーダーは各シグナルを明確に確認でき、リアルタイム相場中にシグナルが消えるという一般的な問題を避けることができます。 完全な過去シ
Power Candles V3 - 自己最適化型強弱インジケーター Power Candles V3は 、通貨や銘柄の強さを、適用されたすべてのチャート上で実行可能なトレードプランに変換します。単にローソク足を色分けするだけでなく、バックグラウンドでリアルタイムの自動最適化を実行し、目の前の銘柄に対して最適なストップロス、テイクプロフィット、およびシグナルの閾値を提示します。ワンクリックで実取引に適用でき、エントリーポイント、ストップロス、テイクプロフィットのラインが正確な価格位置にチャート上に表示され、方向性を示すアラートがリアルタイムで発動します。 このツールは、Stein Investmentsのエコシステムの一部です。  18種類以上のツールをすべて閲覧し、AIを活用したセットアップの推奨事項を入手し、  https://stein.investments でコミュニティに参加しましょう クローズしたバーごとに3,000回以上のトレードシミュレーション。9つの強さの状態。2つの戦略を並行してテスト。勝率の高い設定をワンクリックで適用。 なぜこれが必要なのか ほとんどの強
トレンドキャッチャーインジケーター トレンドキャッチャーインジケーターは、開発者独自の適応型トレンド分析指標を組み合わせることで、市場価格の動きを分析します。短期的なノイズを除去し、根底にあるモメンタムの強さ、ボラティリティの拡大、価格構造の挙動に焦点を当てることで、真の市場方向性を特定します。また、移動平均線、RSI、ボラティリティフィルターなどの平滑化およびトレンドフィルタリング機能を備えたカスタマイズ指標も使用します。 実際の運用状況のモニタリングやその他の製品については、こちらをご覧ください: https://www.mql5.com/en/users/mechanic/seller ご注意ください。私はTelegramでEAや設定を販売していません。詐欺です。すべての設定はブログで無料で公開しています。 重要!ご購入後すぐにご連絡ください。手順とボーナスをお送りします!
Crystal Heikin Ashi Signals - Professional Trend & Signal Detection Indicator Advanced Heikin Ashi Visualization with Intelligent Signal System for Manual & Automated Trading Final Price: $149 ---------> Price goes up $10 after every 10 sales . Limited slots available — act fast . Overview Crystal Heikin Ashi Signals is a professional-grade MetaTrader 5 indicator that combines pure Heikin Ashi candle visualization with an advanced momentum-shift detection system. Designed for both manual traders
GEM Signal Pro GEM Signal Pro は、MetaTrader 5 向けのトレンドフォロー型インジケーターです。より明確なシグナル、より整理されたトレードセットアップ、そして実用的なリスク管理をチャート上で確認したいトレーダーのために設計されています。 単純な矢印だけを表示するのではなく、GEM Signal Pro はトレード全体の考え方を、より見やすく分かりやすい形で表示します。条件が確認されると、インジケーターはエントリー価格、ストップロス、利確目標をチャート上に表示し、トレードセットアップをより効率的に確認できるようにします。 動作の仕組み このインジケーターは、まず内部ロジックに基づいて有効なシードシグナルを検出します。 確認条件が満たされると、GEM Signal Pro はチャート上に完全なセットアップを表示します。これにより、トレーダーはトレード構造をより明確に把握し、手作業による分析を減らすことができます。 チャート上のトレードレベル 確認済みシグナルに対して、GEM Signal Pro は以下を表示できます。 エントリー価格 ストップロス テ
The Oracle Pro
Ottaviano De Cicco
5 (1)
The Oracle Pro:MT5向け合成マルチタイムフレーム・バイアスエンジン ️ サマー・ローンチ・オファー — The Oracle Pro を 199 USD で(早期購入者向け)。価格は普及に応じて上昇します。最終価格 399 USD。 The Oracle Pro は、要求の高いプロのトレーダーのために作られた MetaTrader 5 向けのプレミアム・マルチタイムフレーム バイアスエンジン です。ひとつの問いに規律をもって答えます。すなわち、各タイムフレームの現在の方向バイアスは何か、その強さはどれほどか、そしてタイムフレーム同士はどれだけ一致しているか。すべては確定足のみで計算され、リペイントはありません。 The Oracle Pro はマルチファクター・コンセンサス・システムです。独自のインジケーターと最適化されたアルゴリズムを単一の高度なコンセンサス・ベクトルに統合し、それを単一のインジケーター・インスタンス内で現在足と上位足のスタックにわたって読み取ります。複数のチャートにばらばらのツールを積み重ねる代わりに、です。 これは Oracle コンセンサス手法
Azimuth Pro
Ottaviano De Cicco
5 (7)
Azimuth Pro V2:MT5向けシンセティック・フラクタル構造分析と確認済みエントリー 概要 Azimuth Pro は Merkava Labs によるマルチレベルスイング構造インジケーターです。4つのネストされたスイングレイヤー、スイングアンカーVWAP、ABCパターン検出、3タイムフレーム構造フィルタリング、そして確定バーでの確認済みエントリー — 1つのチャートで、ミクロスイングからマクロサイクルまでを網羅するワークフロー。 これはブラインドシグナル製品ではありません。ロケーション、コンテキスト、タイミングを重視するトレーダーのための構造ファーストワークフローです。 ️ サマーセール — 夏至とThe Oracle Proの発売を記念して、Azimuth Proが30%オフ。現在279 USD(通常399 USD)。期間限定の夏季オファー。 1. V2での変更点 シンセティック・マルチタイムフレームエンジン 上位タイムフレーム分析をMeridian Proと同じ独自のシンセティックアーキテクチャで一から再構築。よりクリーンなHTFコンテキスト、安定したライブ動作、
Reversion King Indicator
Eugen-alexandru Zibileanu
5 (6)
新たな王者が登場 - インジケーター + 注文管理表示(TP1 + TP2 + TP3)+ オプションのTelegramシグナル送信機能付き(無料) (完全なトレード&シグナルシステム) ゴールド向け最高のEA: Gold Slayer このインジケーターには、高度な戦略、カスタマイズ可能な注文管理システム、そしてエンベロープ拡張を組み合わせた平均回帰システムが搭載されています。さらに、RSIなど複数のインテリジェントな確認フィルターによって、高確率の反転エントリーをBUY・SELLシグナルとして検出します。 単にトレードを学ぶだけでなく、複数ポジションを効果的に管理し、過去に利益を出しているオープンポジションで損失トレードをカバーする方法も学べます。 M5向けに構築・最適化されており、流動性が高くシグナルの精度が安定しているBTCUSDとXAUUSDで優れたパフォーマンスを発揮します。 このインジケーターは、ATRを基に自動計算されたエントリー、ストップロス、テイクプロフィットレベルを備えた明確なLong・Shortシグナルを提供するため、リスク管理が最初から組み込まれています。 マ
この製品は 2026 年の市場向けに更新され、最新の MT5 ビルドに最適化されています。 価格更新のお知らせ: Smart Price Action Concepts は現在 $200 で提供されています。 次の 30 件の購入 後、価格は $299 に上がります。 特別オファー: 購入後、私にプライベートメッセージを送ることで、 無料ボーナス + ギフト を受け取ることができます。 まず、このトレーディングツールはリペイントなし、再描画なし、遅延なしのインジケーターであり、プロフェッショナルな取引に最適であることを強調しておきます。 [Online course] ,   [User Manual]  ,  [How to Install]  ,   [PDF] Smart Price Action Concepts Indicator は、初心者から経験豊富なトレーダーまで使える非常に強力なツールです。20 種類以上の便利なインジケーターを 1 つにまとめ、Inner Circle Trader Analysis や Smart Money Concepts Trading S
Crystal Quantum Pro
Muhammad Jawad Shabir
5 (2)
CRYSTAL QUANTUM PRO Institutional Signal & Trade Intelligence for MetaTrader 5 Final Price: 199 USD ----> Price goes up 10 USD after every 10 sales. Limited launch slots available, act fast. Most indicators give you an arrow and leave you alone. A naked arrow is a gamble. Winning consistently requires CONFLUENCE , a clear STOP and TARGET , and honest PROOF that the system works. Crystal Quantum Pro delivers all three in one clean, no-repaint package. Crystal Quantum Pro is a complete decision sy
Ace Trend
Mikhail Sergeev
5 (3)
私たちはあなたにトレンド取引の世界でゲームのルールを変える革命的な指標を提示します。 指標は、パフォーマンスを再考し、前例のない高さにあなたの取引経験を高めるように設計されています。 私たちの指標は、競合他社とは一線を画す高度な機能のユニークな組み合わせを誇っています。 "実質の価格設定要因"の先端技術は最も困難で、揮発市況の最高の安定性を保障する。 不安定なパターン、壊れた指標に別れを告げ、意識的で制御された取引を歓迎します。 指標は単なる美しい絵ではありません! 指標は、トレーダーの側にオッズをシフトし、それによって利益を得る必要があります。 インジケータ信号(完全自動モード)に基づいて取引結果に慣れる: https://www.mql5.com/ja/signals/2339244 AceTrendは、rbtiバージョンによるトレンド指標のランキングで第一位にランクされています。AceTrend-取引における最大の収益性と制御。 私たちの指標は、歴史ではなく、現在の市場相場に基づいて収益性を強調しています。 革命に参加-あなたの取引経験の可能性のロックを解除! インジケーターは、
Quant Direction は、3次元の市場分析ツールです。完全に客観的なアルゴリズムベースの市場分析を提供し、様々なパラメータにわたる正確なパーセンテージ偏差を同時に算出します。高度なAI搭載モデリングツールで開発され、厳密なテストを経て開発されたこのアルゴリズムは、かつてない精度で市場を分析するように設計されています。プラットフォーム上では、あらゆる通貨ペアや金融商品を分析できます。 短期取引、デイトレード、スイングトレードなど、どのような取引スタイルに も、Quant Directionは最適な選択肢です。 オペレーターの本当の利点 Quant Directionの真の利点は、感情、眼精疲労、過剰分析を完全に排除できる点にあります。方向性を探るために何十ものチャートを手作業で精査したり、自分の好みを常に疑ったりする必要がなくなります。このシステムは、8つの時間間隔(5ヶ月から月単位まで)をミリ秒単位で処理します。あらゆる瞬間に市場を支配している主体を正確に明らかにし、常に成功確率が最も高い方向で取引できるようにします。 市場分析の3つの側面 このアルゴリズムは市場を3つの
FX Volume MT5
Daniel Stein
4.79 (24)
FX Volume:ブローカー視点で捉える本物の市場センチメント クイック概要 トレード手法をさらに高めたいとお考えですか? FX Volume は、リテールトレーダーやブローカーのポジション状況をリアルタイムで提供します。これは、COTのような遅延レポートよりもはるかに早く知ることができます。安定した利益を目指す方も、さらなる優位性を求める方も、 FX Volume は大きな不均衡を見極め、ブレイクアウトを確認し、リスク管理を洗練させるのに役立ちます。今すぐ始めて、実際の出来高データがどのように意思決定を変革するかを体感してください! 1. FX Volume がトレーダーにとって非常に有益な理由 高精度の早期警戒シグナル • 各通貨ペアを売買しているトレーダー数を、他者よりも早く、ほぼリアルタイムで把握できます。 • FX Volume は、複数のリテールブローカーから得られる本物の出来高データを収集し、分かりやすい形式で提供する 唯一 のツールです。 強力なリスク管理 • ロングやショートの大きな偏り(インバランス)を特定し、潜在的なトレンド転換を見逃しません。ストップ
FX-AIEA Smart Supply and Demand Zone Identification Indicator (Supply and Demand Indicators MT5) Version: 2.51 | Compatible Platform: MetaTrader 5  Why do trades need supply and demand zones? Supply and demand zones are the core manifestation of institutional order flow, reflecting real buying and selling power more accurately than traditional support and resistance. However, manual drawing is not only time-consuming but also highly subjective and prone to missing key areas. FX-AIEA Supp
BTMM State Engine Pro by G-Labs — Beat The Market Maker indicator for MetaTrader 5. Asian session range, London and New York kill zones, level progression (L1/L2/L3), peak formation detection (PFH/PFL), entry signals, and a multi-pair scanner from one chart. Stop scanning charts one pair at a time. The State Engine tracks the BTMM daily cycle automatically — Asian box, room boundaries, level blocks, peak formations, and filtered entries — while the scanner dashboard shows level, peak status, d
作者のその他のプロダクト
MidPrice_A — The Hidden Power of the Market in a Single Number Looking for a way to see the true market direction without noise, lag, or overloaded charts? MidPrice_A is a minimalistic yet powerful tool that reveals the pure price impulse , based on a professional market movement logic. What does MidPrice_A do? Unlike traditional indicators that rely on closing prices and often lag behind, MidPrice_A analyzes the candle mid-price and measures how far the market has actually shifted over the last
FREE
Smart Gain Smart Gain は、リスクをコントロールしながら資金の安定的な成長を目的とした自動売買システムです。 本システムの基本コンセプトは、取引サイクルの管理によってドローダウンの深さを抑え、市場環境の変化に適応することにあります。 戦略にはアルゴリズムの一部として平均化ロジックが組み込まれており、手動での調整は必要ありません。システムのリスクと収益性は、基本ロットサイズによって調整されます。 推奨取引条件 通貨ペア: EURUSD 時間足: M15 設定: デフォルト 安定かつ安全な運用のため、以下の設定を推奨します。 最低残高: 5000単位 (セント口座では約 50USD ) 基本ロット: 残高 1000単位ごとに 0.01 — 中程度のリスク設定 残高 2000単位ごとに 0.01 — より保守的な設定 これらの条件に従うことで、システムは長期的かつ安定した運用を目的として設計されています。 推奨設定 Smart Gain — 入力パラメータ Base lot size: 0.05 (残高5000~10000向け) Maximum slippage: 3
フィルタ:
レビューなし
レビューに返信