SQN Max indicator for MT5 by ITC
- インディケータ
-
Renaud Herve Francois Candel
 ITC SOFTWARE is a technology company based in the United States since 2010.
🟠🔴 The company develops financial software and indicators for different trading platforms:
-Metatrader 4 and Metatrader 5
-TradingView
-NinjaTrader - バージョン: 1.50
- アップデート済み: 4 7月 2023
- アクティベーション: 5
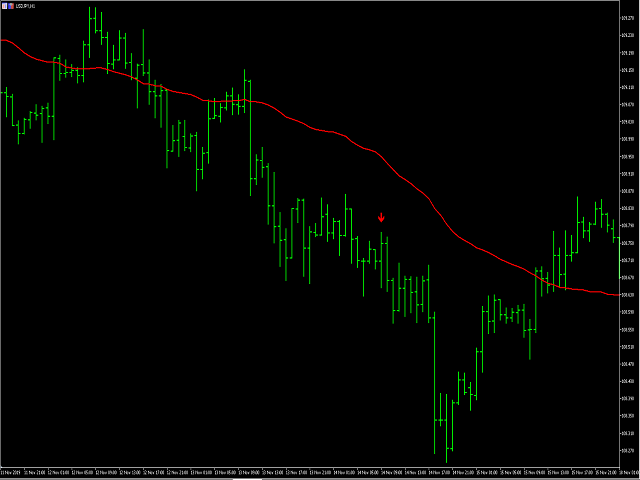
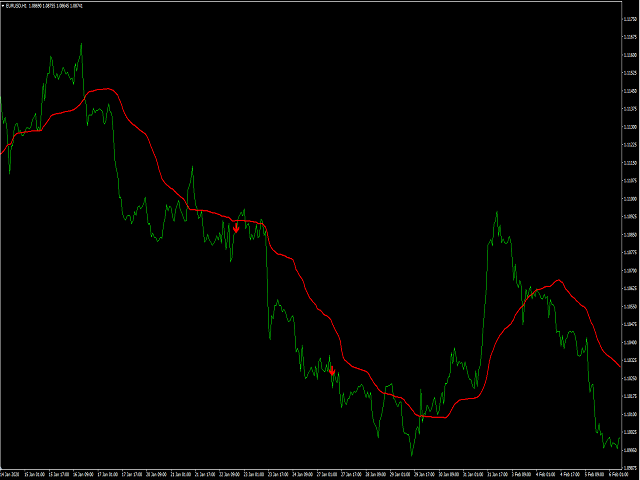
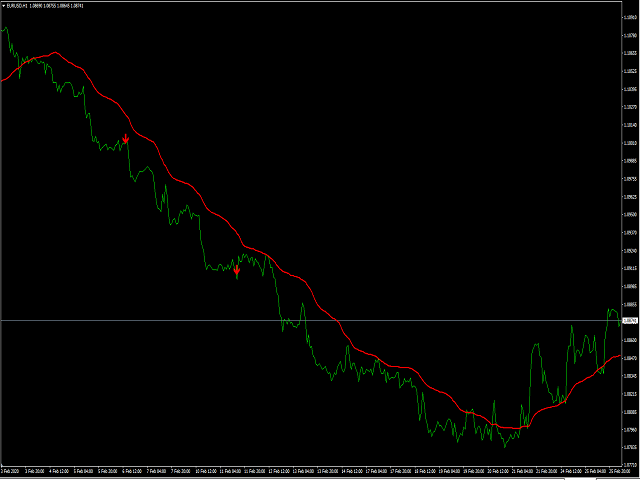
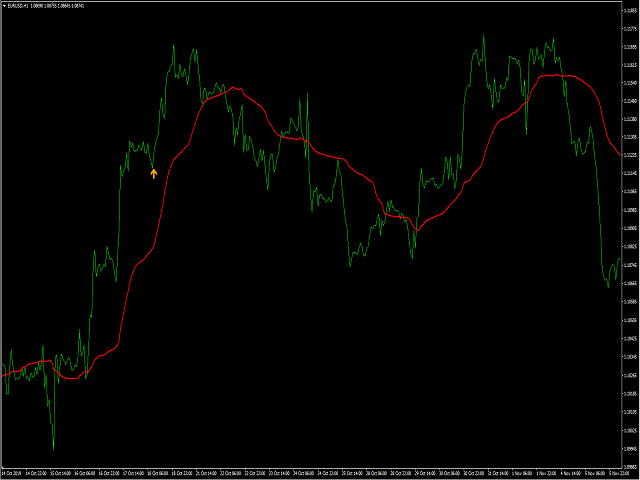
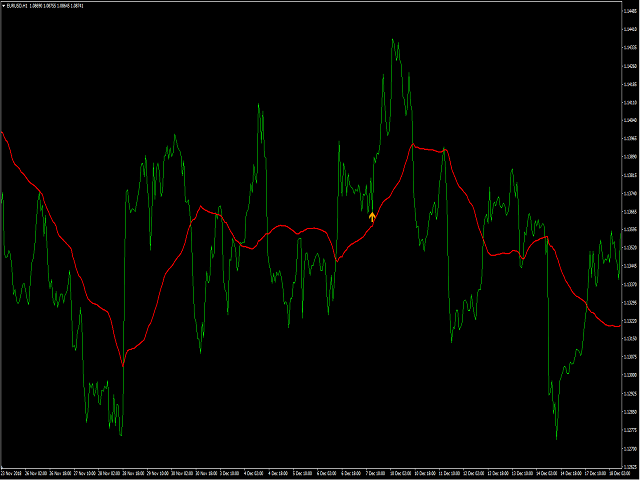
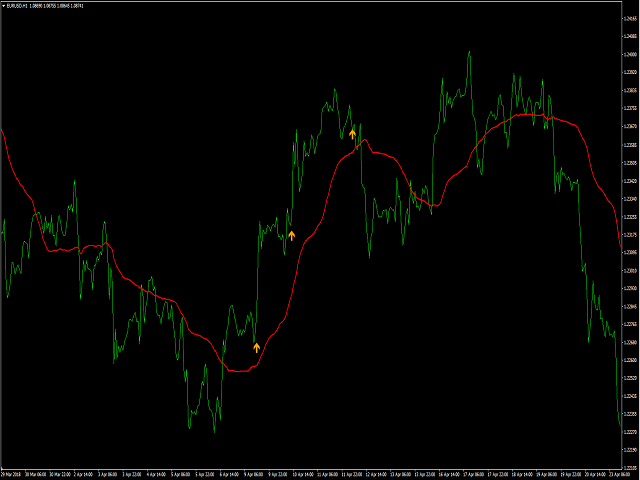
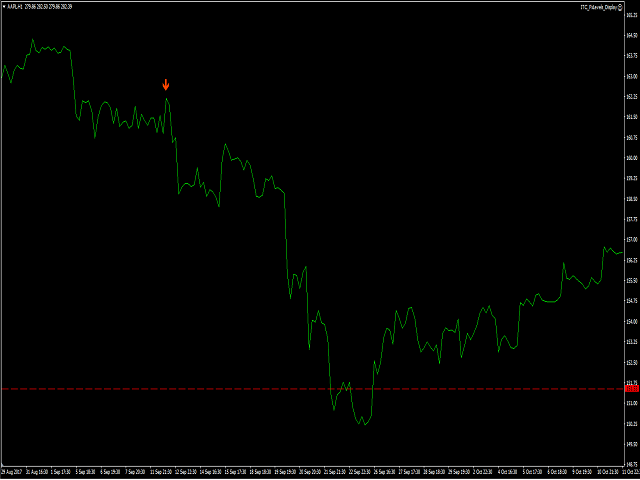
Sqn Max is an exclusive indicator to trade the market with high effectiveness.
The indicator is based on price action, volatility and trend.
This indicator is as simple as possible but not too simple.
The indicator can generate alerts to ease the trading process. You don't have to stay all day in front of your screen.
The indicator can be used with any class of assets and with any time frame.
It is possible to achieve better results trading our list of selected assets.
We achieved best results using the H1 time frame, trading stocks, cfds, options, and ETFs from the American Market but of course this is not limited to this class of assets.
We are sure you can test yourself and discover other opportunities like Forex, Cryptos, Commodities, Indices.
But to start with the indicator, we recommend you to use the indicator with the assets that we know it is working fine.
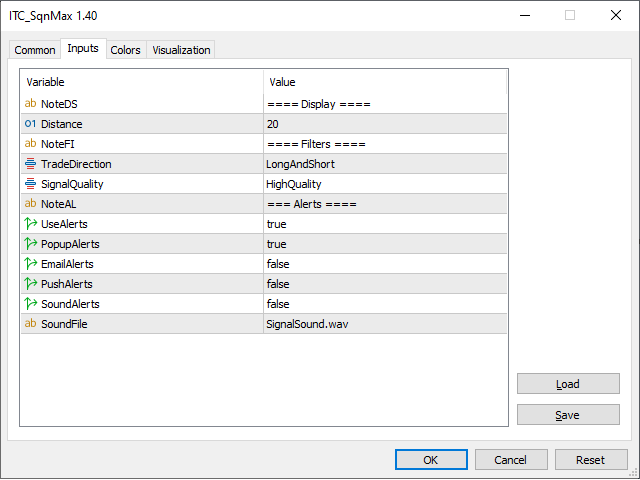
Inputs of the indicator are:
- Distance - distance in pixel relative to top or bottom of candle to display the arrow symbol
- TradeDirection (shortandlong/shortonly/longonly): used to filter signal and eventually go with the main trend
- SignalQuality (high/medium): use to select the accuracy of signals. Medium quality will generate more signals.
- UsePreAlerts (true/false): to enable pre-alerts. Alert is generated before the close of the bar (not confirmed signal).
- PreAlertsSeconds: time in seconds before the close of the bar when pre-alerts can be generated.
- UseConfirmedSignals (true/false): to enable confirmed signals. Alert is generated after the close of the bar.
- PopAlerts (true/false): to enable alerts of type Popup window
- EmailAlerts (true/false): to enable alerts of type Email
- PushAlerts (true/false): to enable alerts of type Push Notification
- SoundAlerts (true/false): to enable alerts of type Sound
- SoundFile: file to be used for sound alerts
Trading rules:
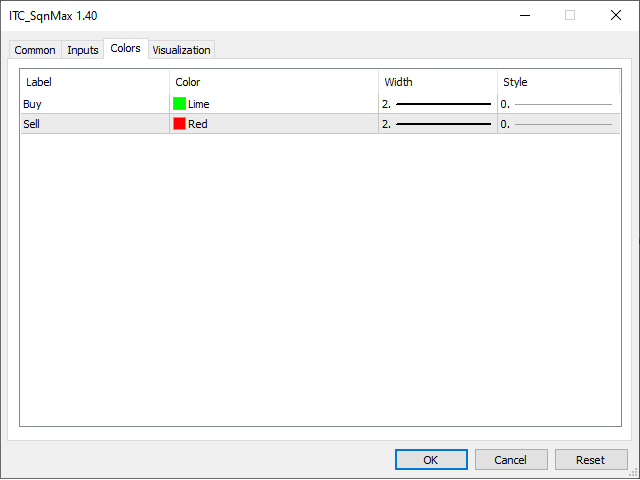
- Entry: enter in a trade in the direction of the signal (look at the direction of the arrow) as soon as the signal is confirmed (confirmation at the close of the candle).
- Exit: you can exit the trade with a stop loss and take profit. The distance of the stop can be calculated based on the ATR (Average True Range). Stop Loss distance = 3.0 ATR. Take profit distance = 3.0 ATR.
- Time stop: you can also use a time stop to not stay in a trade that is not moving in your favor. You can use a time stop of 30 to 70 bars.
Other indicators for MT4 and MT5:
We developed more than 60 indicators and utilities for Metatrader 4 and Metatrader 5.
All our indicator are developed both for MT4 and MT5.
List of all our indicators:
You can get the complete list of our indicators visiting our profile page.