Mega Spikes Max
- インディケータ
- バージョン: 4.2
- アップデート済み: 24 4月 2026
- アクティベーション: 6

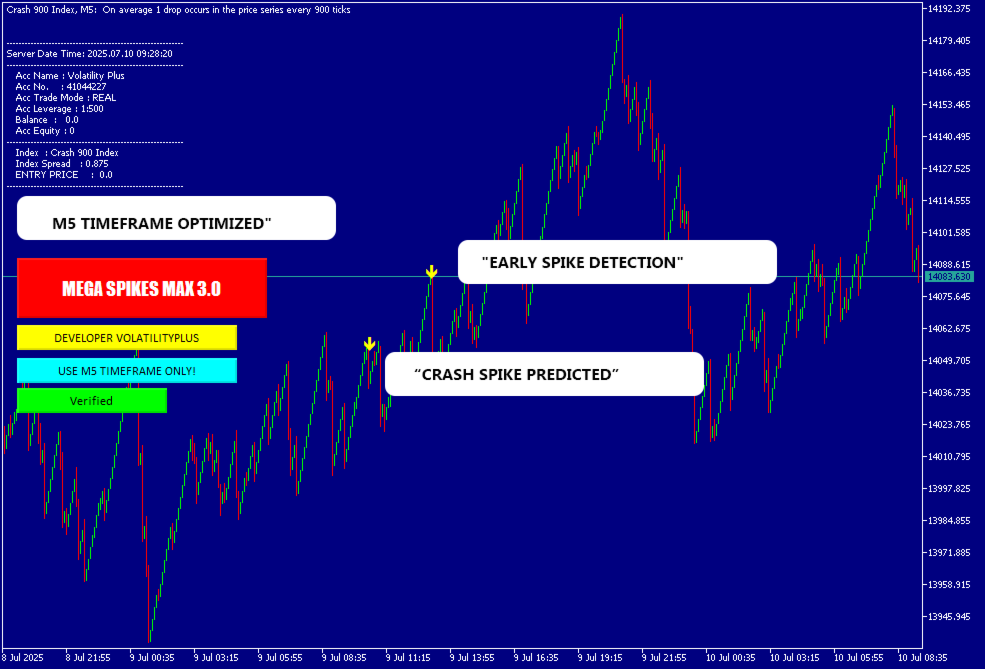
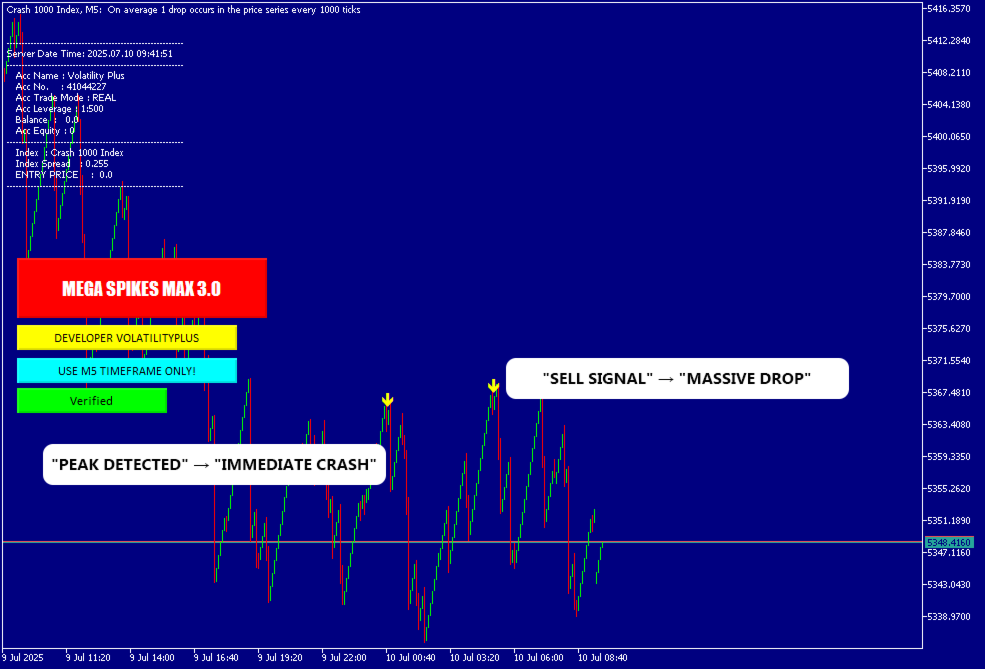
Mega Spikes Max is a specialized indicator for Boom and Crash synthetic indices that generates trading signals with automatic alert notifications.
Features
The indicator analyzes market conditions using proprietary algorithms and displays buy/sell arrows directly on the chart. It works specifically with Boom and Crash indices on M5 timeframe.
Signal generation combines multiple technical analysis methods to identify potential trading opportunities. The system provides two TP levels and SL calculations for each signal.
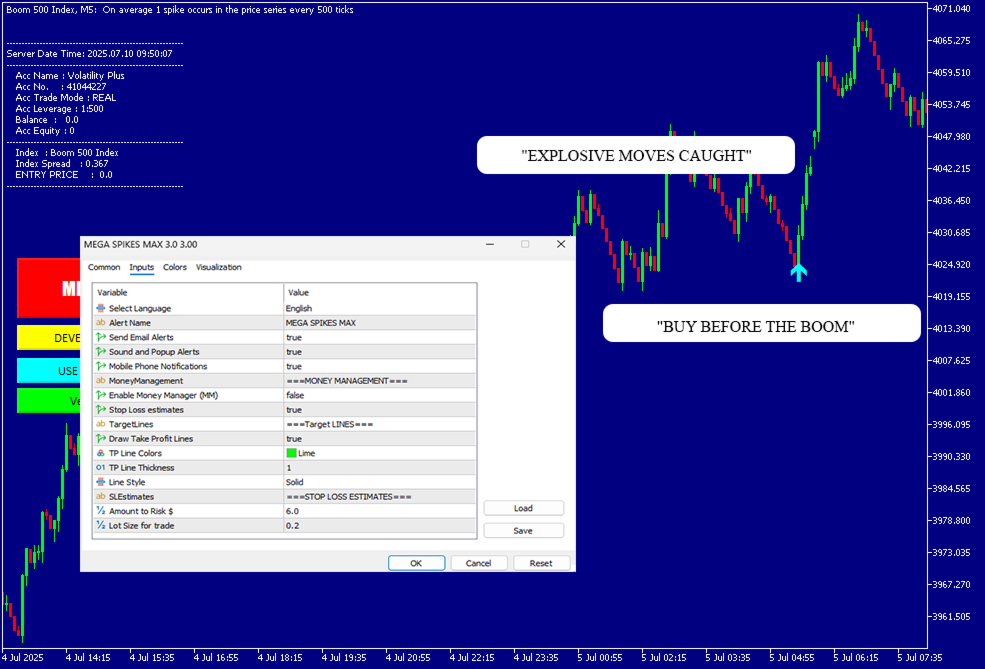
Alert system sends notifications via push messages, email, sound alerts, and on-screen displays. Multi-language support available in English, French, Spanish, Portuguese, and Malay.
Supported Symbols
Boom 500 Index, Crash 1000 and Crash 500 Index SPIKE TRADING ONLY
Input Parameters
Alert Settings:
- Language selection (English, French, Spanish, Portuguese, Malay)
- Alert name customization
- Enable/disable email alerts
- Enable/disable sound and popup alerts
- Enable/disable push notifications
Money Management:
- Enable money manager
- Lot size 1, 2, 3 for profit estimates
- Include stop loss in estimates
Stop Loss Settings:
- Risk amount in dollars
- Lot size for trade calculations
Indicator Properties
- Indicator type: Chart window
- Arrow indicators for buy/sell signals
- Non-repainting arrows
- Customizable colors and sizes
Installation
Load the indicator on any supported chart. Configure notification preferences in the input panel. The system will automatically monitor market conditions and generate alerts when conditions are met.
Requirements
MetaTrader 5 platform M5 timeframe recommended Works on demo and live accounts
Important Notice
This is a technical analysis tool. Trading involves risk and past performance does not guarantee future results. Users should understand synthetic indices characteristics before trading.
- This is historical log performance, not a promise of future profit. “Make money” depends on execution, size, fees, and discipline.
- These are Deriv synthetic indices — gaps, sessions, and risk differ from FX.
mega spikes max the best 👍👍👍👍❤️