FX Levels Premium indicator for MT5
- インディケータ
-
Renaud Herve Francois Candel
 ITC SOFTWARE is a technology company based in the United States since 2010.
🟠🔴 The company develops financial software and indicators for different trading platforms:
-Metatrader 4 and Metatrader 5
-TradingView
-NinjaTrader - バージョン: 3.10
- アップデート済み: 5 7月 2023
- アクティベーション: 5
Fx Levels Premium Indicator
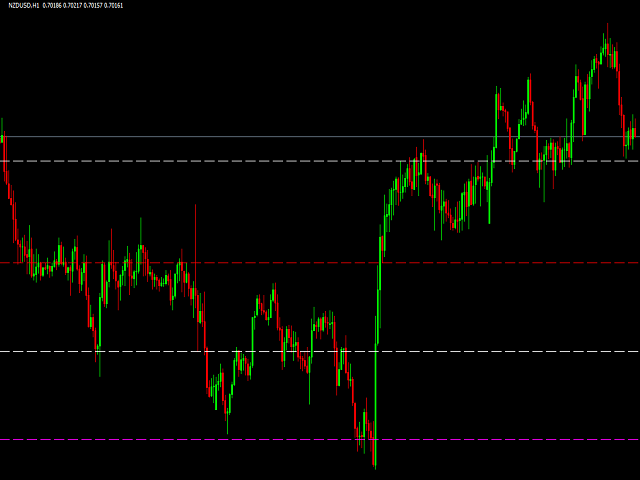
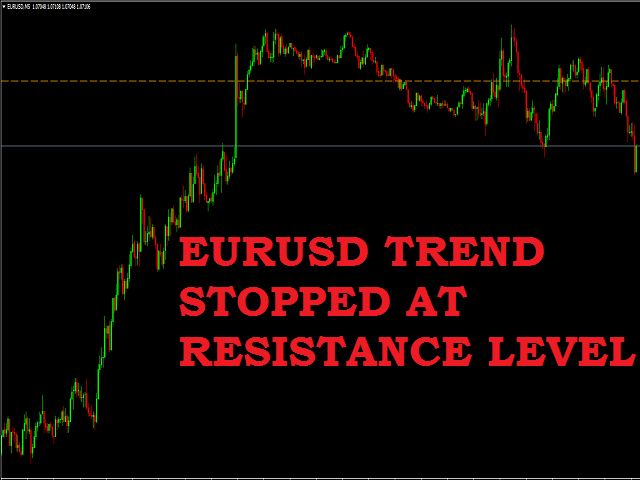
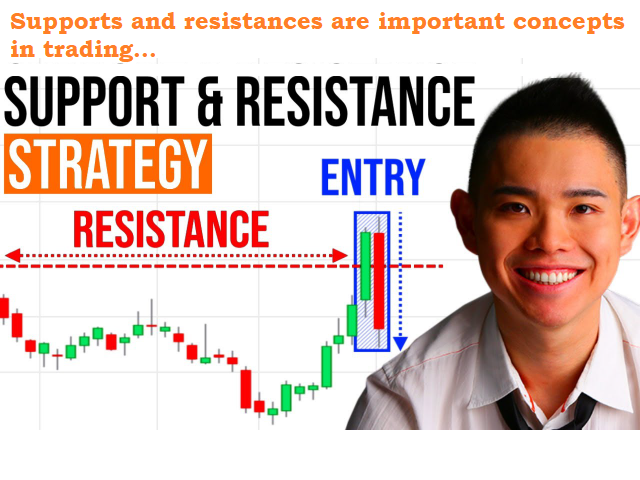
Support and Resistance are important concepts in trading. Fx Levels Premium was created to easily draw important levels of support and resistance for the active trader.The indicator will give you all important levels (support/resistance) to watch for a wide range of assets.
Trading without these levels on your chart is like driving a car for a long journey without a roadmap. You would be confused and blind.
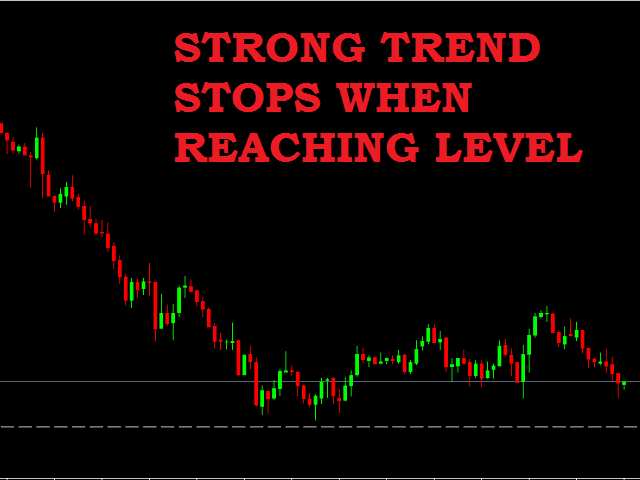
Support and resistance levels should be used as guideline to figure out possible turning points and targets.
The levels are entry and exit points for your trades.
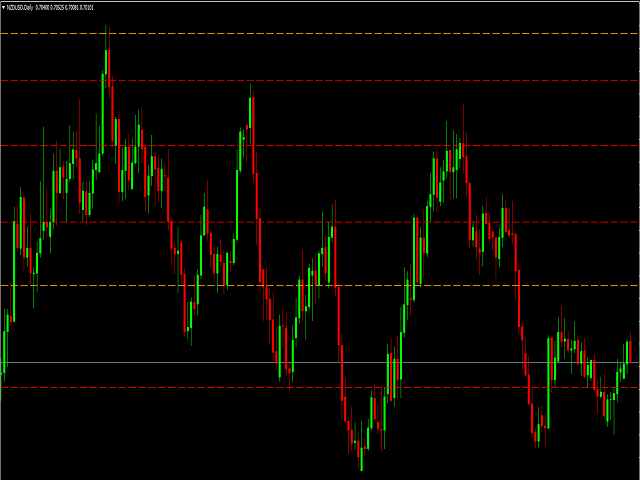
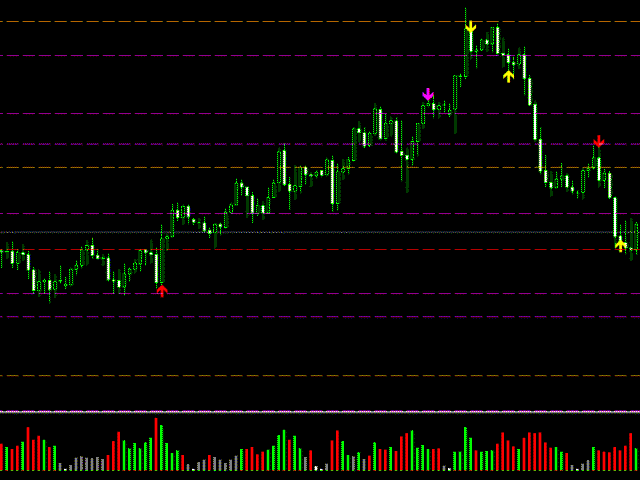
The indicator draws these levels analyzing the H1, H4, D1 and W1 timeframes.
Levels can be customized (color, style, line width).
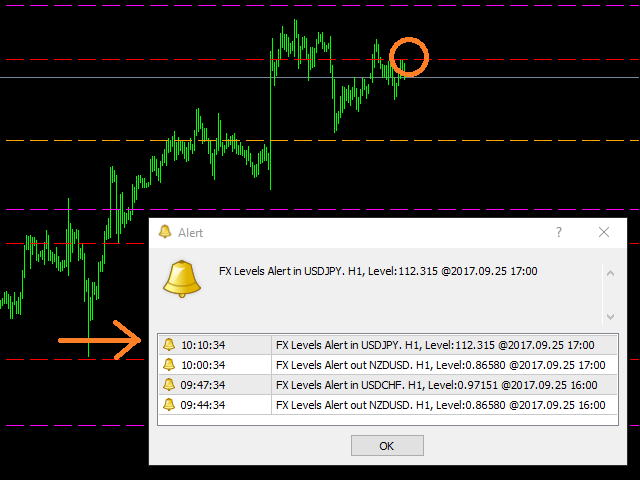
Furthermore the indicator can send alerts when price is approaching (or going away from) a price level so that you can take action to enter in a trade or close a trade.
The indicator can be used for scalping, swing trading or daily trading.
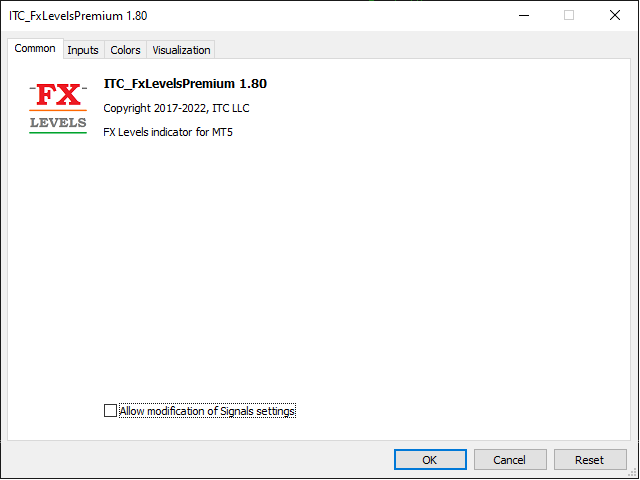
Inputs
- Prefix - prefix used by broker (for instance if symbol is called xGBPUSD then Prefix is x).
- Suffix - suffix used by broker (for instance if symbol is called GBPUSDfx then Suffix is fx).
- Show W1 - show levels identified in the W1 time frame.
- Show D1 - show levels identified in the D1 time frame.
- Show H4 - show levels identified in the H4 time frame.
- LineColor_ - define color of level to be drawn for the given time frame (W1, D1, H4, H1).
- LineStyle_ - define style of level to be drawn for the given time frame (W1, D1, H4, H1).
- LineWidth_ - define width of level to be drawn for the given time frame (W1, D1, H4, H1).
- RefreshSeconds - refresh delay to update alerts.
- CheckFxLevels - check specific levels designed in the software and generate alert when required.
- CheckRoundNumber - check round number levels and generate alert when required.
- UseAlerts (true/false) - set to true to enable alerts management.
- SoundAlerts (true/false) - set to true to receive alerts of type sound.
- SoundFile - name of wav file to be used to play sound alerts.
- PopupAlerts (true/false) - set to true to receive alerts of type pop-up box window.
- EmailAlerts (true/false) - set to true to receive alerts over email.
- NotificationAlerts (true/false) - set to true to receive alerts to your mobile using MetaTrader notifications.
- LogAlerts (true/false) - set to true to display alerts in the MetaTrader Experts tab log.
- DistancePointsOut - distance in points to generate alert when price is going away from price level.
- DistancePointsIn - distance in points to generate alert when price is approaching price level.
- Gold EUR - name of symbol (for instance XAUEUR) used by your broker platform.
- Gold USD - name of symbol (for instance XAUUSD) used by your broker platform.
- Silver EUR - symbol name.
- Silver USD - symbol name.
- WTI USD - symbol name.
- Brent USD - symbol name.
- Natural Gas USD - symbol name.
- Platinium USD - symbol name.
- Australia 200 - symbol name.
- China A50 - symbol name.
- Eurostock 50 - symbol name.
- Cac 40 - symbol name.
- Dax 30 - symbol name.
- Italia 40 - symbol name.
- Nikkei 225 - symbol name.
- Hang Seng 50 - symbol name.
- FTSE 100 - symbol name.
- Nasdaq 100 - symbol name.
- Spain 35 - symbol name.
- Wall Street 30 - symbol name.
- SP 500 - symbol name.
- Russel 2000 - symbol name.
- Dollar Index - symbol name.
Indicator works for a large range of assets:
- all crosses for major currencies: EUR, USD, GBP, AUD, NZD, CAD, JPY, CHF
- exotic crosses: AUDSGD, CHFSGD, EURCZK, EURNOK, EURPLN, EURSEK, EURSGD, EURTRY, EURZAR, GBPNOK, GBPSEK, GBPSGD, GBPTRY, NOKJPY, NOKSEK, SEKJPY, SGDJPY, USDCNH, USDCZK, USDHKD, USDMXN, USDNOK, USDPLN, USDRUB, USDSEK, USDRUB, USDSGD, USDTHB, USDTRY, USDZAR, ZARJPY
- commodities: Gold EUR, Gold USD, Silver EUR, Silver USD, WTI USD, Brent USD, Natural Gas USD, Platinum USD
- indices: Australia 200, China A50, Eurostock 50, Cac 40, Dax 30, Italia 40, Nikkei 225, Hang Seng 50, FTSE 100, Nasdaq 100, Spain 35, Wall Street 30, SP 500, Russel 2000, Dollar Index
You can draw the levels in any time frame. For instance you can draw W1 levels in a M5 chart.
The indicator can be used to trade Spot Forex, Stocks, Options, Commodities, Indices and Futures.
List of all our indicators:
You can see the complete list of our indicators visiting our profile page. Do not hesitate to contact us over MQL5 messaging for any question.