Join our fan page
- Views:
- 58243
- Rating:
- Published:
- Updated:
-
Need a robot or indicator based on this code? Order it on Freelance Go to Freelance
Spearman's Rank Correlation is a non-parametric method used in order to make statistical studies of relationship between variables. In this case, the factual degree of parallelism between two numeric sequences will be detected.
The practical calculation of Spearman's Rank Correlation includes the following stages:
1) pair each indication with its number (rank) and rank them from the highest to the lowest or vice versa;
When employing the rank correlation, one conditionally estimates the correlation ratio between indications considering the values being equal to or below 0.3 to be the indications of low correlation ratio, whereas the values between 0.4 and 0.7 are considered to indicate a moderate correlation ratio, values above 0.7 - to indicate a high correlation ratio.
Spearman's Rank Correlation is a little less powerful than the Parametric Correlation.
It is reasonable to use the rank correlation when there is just a small amount of observations. This method can be used for both numerical data and in the cases, when the registered values are detected by attributes of various intensity. The source of the above description was found here.

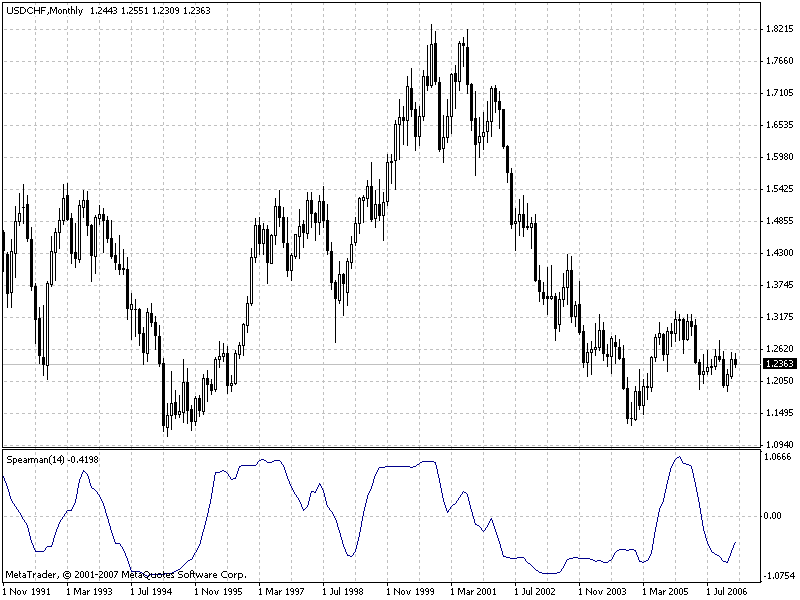
This indicator is one of oscillators. However, being compared to stochastic oscillator, it is smoother. Moreover, it does not delay in pivot points.
The only external parameter that influences the calculation algorithms is rangeN. It sets the amount of bars, for which we are trying to find regularities. If rangeN = 14, then we take the close price sequence Close[i], Close[i+1], ... Close[i+rangeN-1], and construct a rank sequence for them, i.e., we find the location of each close price when the sequence is sorted. In this case, one real chart turns to be compared to another, monotone increasing chart.
The parameter of direction means sorting from the highest to the lowest value (true) or from the lowest to the highest value (false). The value of true shows a more usual picture, whereas false produces an inverted image. Parameter CalculatedBars is introduced in order to limit the amount of bars under calculation, to save CPU resources (though that wasn't needed). Zero value of this parameter means that calculations will be performed for all history available. Parameter Maxrange = 30 sets the maximum calculation period. This parameter was introduced in order to save resources, as well, so maybe somebody will need it.
Translated from Russian by MetaQuotes Ltd.
Original code: https://www.mql5.com/ru/code/7065
 Smoothed ADX by John Ehlers
There are many algorithms of smoothing. This given indicator is for smoothing of standard indicator ADX. The code was translated from Easy Language.
 DT_ZZ_optimized
Optimized variant of the indicator DT_ZZ by klot.
 Center of Gravity by J. F. Ehlers
Center of Gravity is an oscillator developed by John F. Ehlers and presented in his article in Stocks & Commodities magazine (May 2002).
 NRTR GATOR
It is NRTR indicator, in which candlesticks are painted in accordance with the mutual positions of Alligator lines.