Market Sessions Times

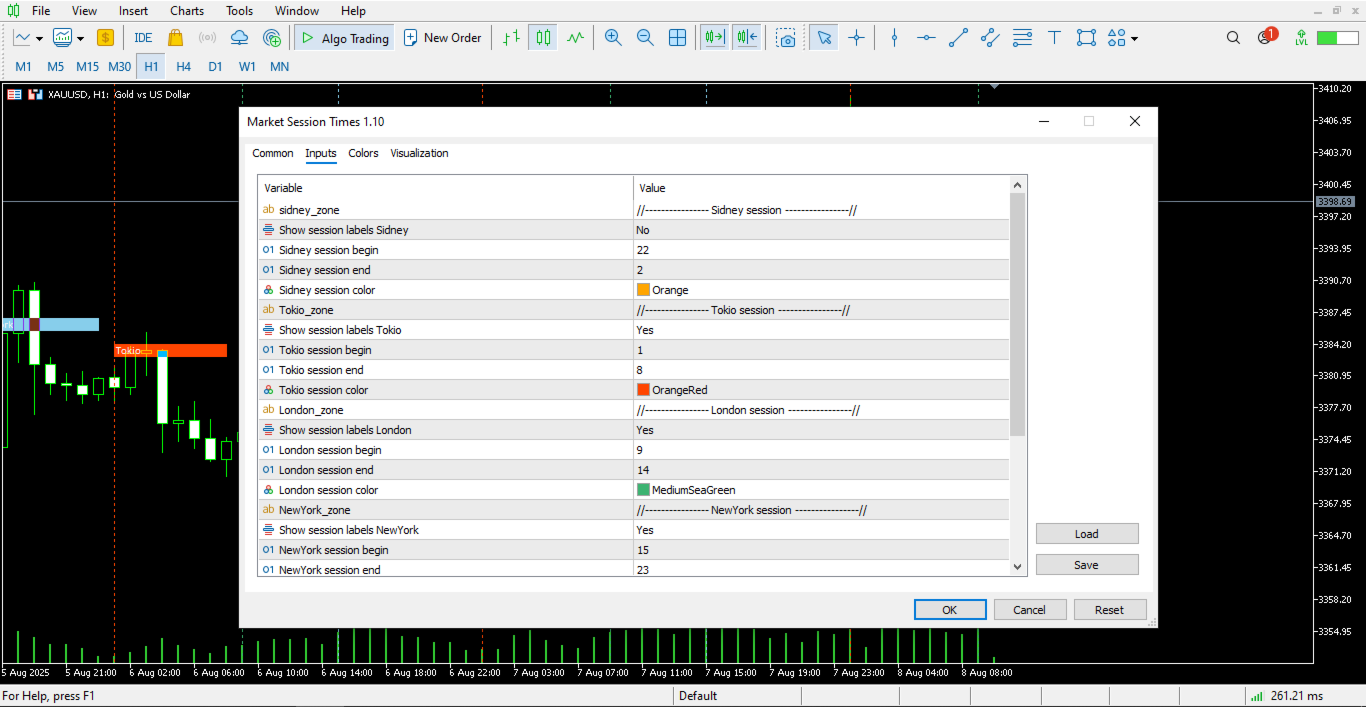
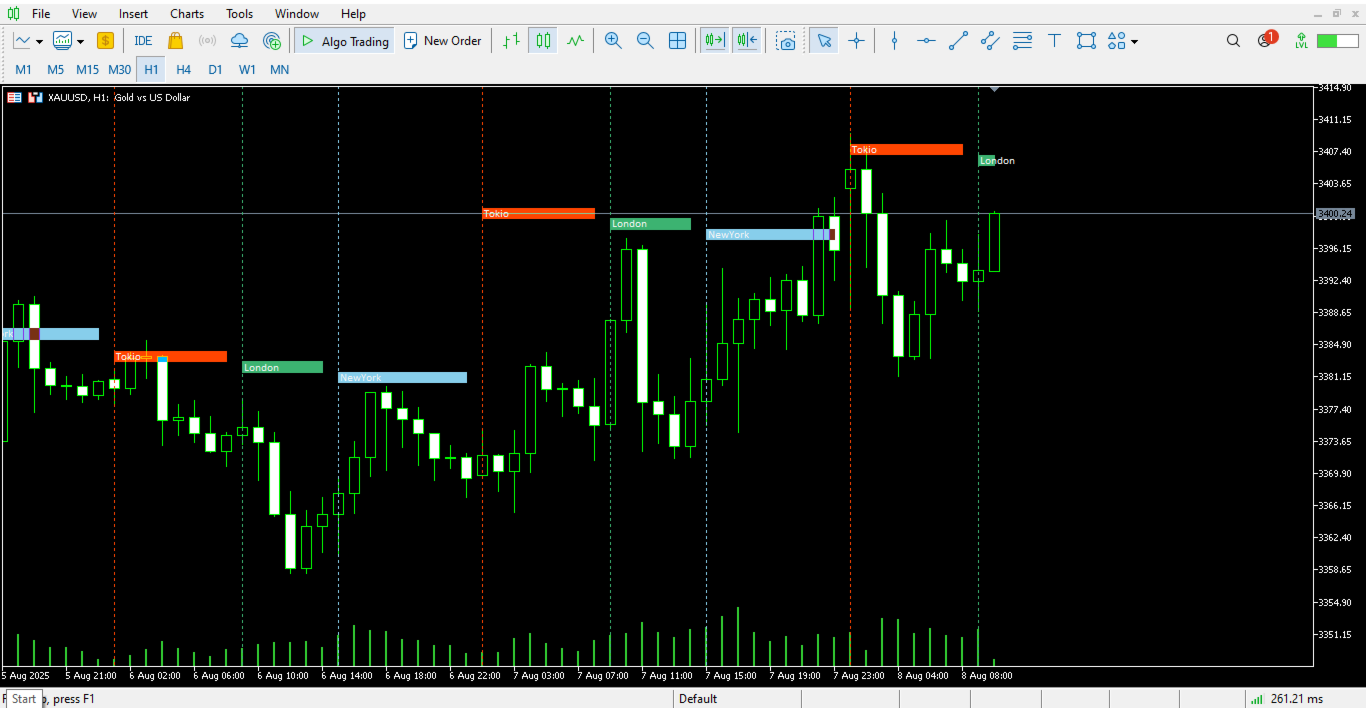
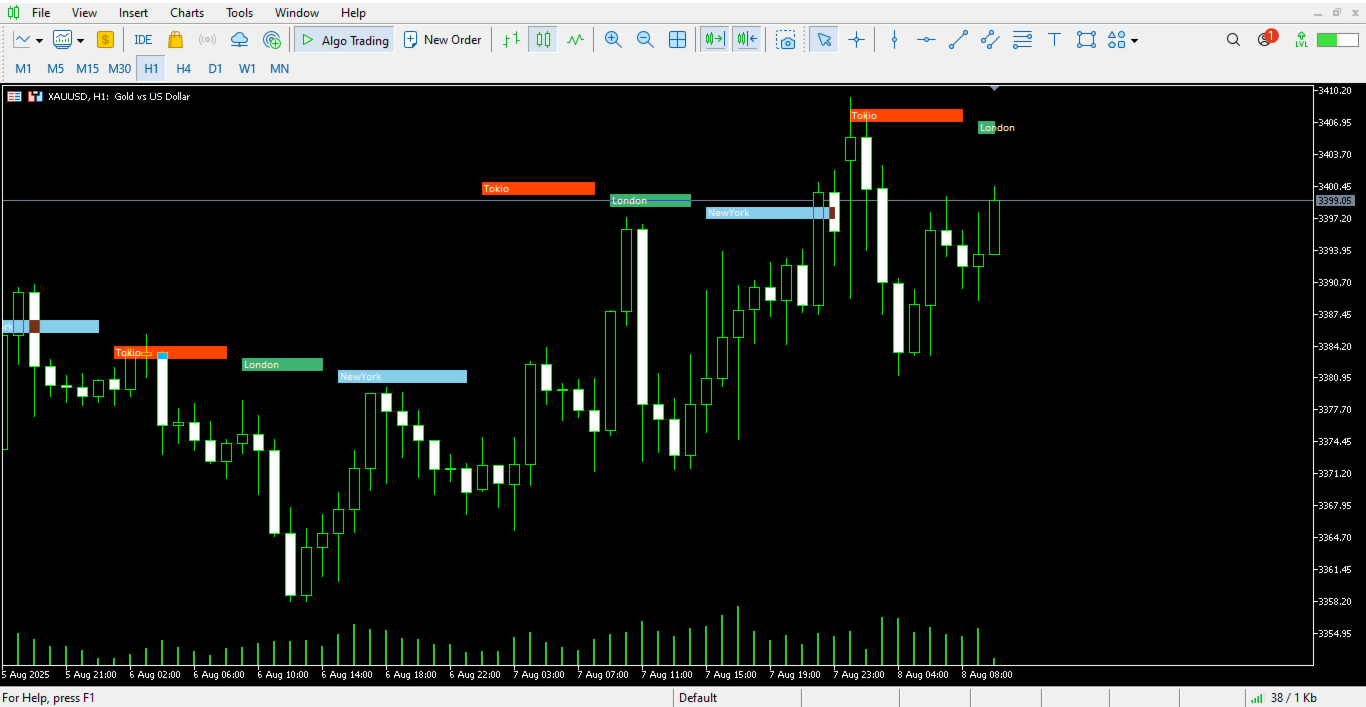
Overview of the Market Sessions Indicator

The Market Sessions Indicator is a tool designed to help traders visualize the active trading hours of major global financial markets—specifically the Tokyo, London, and New York sessions. By clearly marking these time zones on the chart, the indicator allows users to identify the partitioning of major trading sessions.

There are 3 regular trading sessions:

- Tokyo Session

- London Session

- New York Session

The indicator works from the H1 timeframe and below, with some customization options for personalization.

おすすめのプロダクト
VFI Quantum
Nikita Berdnikov
5 (1)
Introducing VFI (Volume Flow Indicator) – a trading indicator that analyzes the relationship between volume and price movement to identify key trading opportunities. The indicator displays the strength and direction of volume flow, providing clear signals about potential entry and exit points. Signals are formed based on zero line crossovers, crossovers between the VFI line and its exponential moving average (EMA), and when the indicator exits overbought and oversold zones. Attention! This stra
FREE
AZ session scalper A small but useful session indicator, designed primarily for scalping. Enable the session you plan to trade, watch the reaction of the M5/M15 candlesticks to the level of the previous trading session, and enter. We always look at the reaction of the current session to the previous one. For example, if you trade the Americas, enable the European session, and watch how one session takes away liquidity from another. Important: adjust the time to your broker's time zone in the i
FREE
The Multi-Frame MACD Indicator is a robust MetaTrader 5 (MT5) indicator that utilizes the Moving Average Convergence Divergence (MACD) to analyze trends across multiple timeframes. This indicator synchronizes MACD-based trend signals from up to nine timeframes (M1, M5, M15, M30, H1, H4, D1, W1, MN1) and presents them with clear visual cues, including a colored MACD line, signal arrows, and a customizable dashboard. Perfect for traders seeking momentum and trend reversal insights. Features Multi-
FREE
説明: NR4 & NR7 インサイドバー・ハイライターは、NR4 または NR7 パターンとインサイドバーの組み合わせによる 価格の圧縮局面 を自動的に検出するインジケーターです。 NR4(ナロー・レンジ4)は直近4本のローソク足の中で最も値幅が狭い足を、NR7は直近7本の中で最も狭い足を特定します。これらがインサイドバー(前のローソク足の高値と安値の間に完全に収まる足)と一致する場合、市場の ボラティリティが収縮 していることを示し、その後に 強いブレイクアウト が起こる可能性が高まります。 インジケーターは該当するローソク足を以下のようにチャート上で視覚的に表示します: NR4 + インサイドバー:白(カスタマイズ可能) NR7 + インサイドバー:オレンジ(カスタマイズ可能) 各シグナルにはテキストラベルが自動で表示されます。アラートやプッシュ通知など他のトレーディングロジックとも簡単に統合可能です。全ての銘柄・時間足に対応しています。 ブレイクアウト戦略やボラティリティの拡大を狙うトレーダーに最適な軽量インジケーターです。
FREE
Trading Sessions by Mahefa R is an indicator for MetaTrader 5 that visually identifies the four main trading sessions: New York, London, Tokyo, and Sydney . Designed to provide a clean, intuitive, and professional market view, it highlights the most active periods of the Forex market using smart visualization of session ranges , session-specific candle colors , and daily separators . Main Features: Automatic detection of the 4 major sessions New York London Tokyo Sydney Each session is fully c
FREE
Description The Institutional Cycle Filter (ICF) is a sophisticated trend-following tool that replaces standard moving averages with a "Signal Dot" system. It is designed to minimize lag while maintaining smoothness, making it highly effective for identifying trend reversals in volatile markets like Gold. How It Works (The Logic) Cosine Weighting: Unlike a Simple Moving Average (SMA) or Exponential Moving Average (EMA), this algorithm uses a Cosine function to calculate weights. This allows the
FREE
この情報インジケーターは、アカウントの現在の状況を常に把握したい人にとって役立ちます。 VERSION MT 4 -   More useful indicators このインジケーターには、ポイント、パーセンテージ、通貨での利益、現在のペアのスプレッド、現在の時間枠でバーが閉じるまでの時間などのデータが表示されます。 チャート上に情報線を配置するには、いくつかのオプションがあります。 価格の右側 (価格の後ろにあります)。 コメントとして (グラフの左上隅に); 画面の選択した隅。 情報区切り記号を選択することもできます。 | / \ # このインジケーターは使いやすく、非常に有益です。設定で不要な情報項目を無効にすることも可能です。 設定 外観の種類     - 情報行の表示タイプ。次の 3 つのオプションがあります。 価格に従ってください     - 価格に従う。 コメントとして     - コメントとして; 画面の選択した隅に     - 画面の選択した隅にあります。 添付用グラフコーナー     - 表示タイプを選択した場合 画面の選択されたコーナーでは、この項目を使用して
FREE
LT Force
Thiago Duarte
5 (5)
For those who like trend the Force will be a very useful indicator. This is because it is based on the famouse ADX, which measure the strenght of a trend, but without its 3 confusing lines. Force has its very simple interpretation: if the histogram is above zero level the trend is up, otherwise it is down. You can use it to find divergences too, which is very profitable. Thanks to Andre Sens for the version 1.1 idea. If you have any doubt or suggestion, please, contact me. Enjoy! MT4 version: 
FREE
The Market Sessions indicator is a popular tool among forex and stock traders for visually representing global trading sessions on a price chart. It highlights the time periods for major trading sessions — such as the Asian (Tokyo) , European (London) , and American (New York) sessions — directly on the chart. This helps traders identify when markets open and close, allowing for better decision-making based on session-specific trading behavior. - Asian Session (Default: 00:00-09:00) - London Se
FREE
Pivot Points Indicator – a fast, reliable, and fully customizable pivot detection for MetaTrader 5. This indicator uses MetaTrader’s native iHighest and iLowest functions to identify pivot highs and lows by scanning for the highest and lowest prices within a user-defined window of bars. A pivot is confirmed only when the current bar is the absolute maximum or minimum within the selected range, ensuring accurate and timely signals based on robust built-in logic. Key Features No Repainting : Onc
FREE
Schemes 2.0 - MT5チャートを瞬時に変身させよう Meta Trader 5の究極のビジュアル強化ツール、Schemes 2.0で、トレーディング体験をアップグレードしましょう。 プロがデザインした9種類のカラーテーマとスマートトグルインターフェースにより、シンプルなミニマリズムから鮮やかなハイコントラストまで、チャートスタイルをワンクリックで瞬時に切り替えられます。 トレーダーに愛されるSchemes 2.0 1. 9種類のプレミアムテーマ - ライトからダーク、クラシックからモダンまで、あらゆるトレーディングスタイルに合わせてカスタマイズできます。 2. ワンクリックスタイル設定 - チャート設定の調整に時間を無駄にすることなく、瞬時にチャートを変身させます。 3. スマートトグル - いつでもコントロールの表示/非表示を切り替えて、作業効率を向上できます。 4. プロフェッショナルな外観 - スクリーンショット、シグナル、ライブトレーディングプレゼンテーションに最適です。 5. 軽量&簡単 - インストールが簡単で直感的に操作でき、無駄な作業は一切ありません。
This indicator is based on Bollinger Bands and moving averages, and uses ADX to get the turning point of the market trend and display a sign. It is basically intended for use with currency pairs and futures with high volatility. In our tests we use it on XAUUSD, 5m and 15m. Win rate is more than 80% with 50 pips stop loss and 50 pips gain or more. The indicator is also a simple indicator that allows you to enable or disable alerts and change the color of the arrows from the indicator settings
FREE
This Mt5 Indicator Signals when there is two opposite direction bars engulfed by current bar.  has a recent Exponential Moving Average Cross and past bar was oversold/bought Expert Advisor Available in Comments  Free Version Here : https://www.mql5.com/en/market/product/110114?source=Site&nbsp ; Full Alerts for mt5 terminal , phone , email, print to file, print to journal  Buy Signal ( blue line ) Past ema cross ( set at 30 bars back ) Past bar rsi is oversold ( level 40  ) Engulfing bar closes
FREE
Dynamic Supply and Demand indicator automatically identifies and displays Supply and Demand Zones on your chart based on price action patterns and market structure.  These zones represent areas where institutional buying or selling pressure has historically occurred, making them key levels for potential price reactions. This form of indicator takes inspiration from ICT as well as traditional Support & Resistance formation. **For the first 50 candles (number depends on LookBackCandles) when indic
FREE
# Super Trend Indicator - User Guide *** Group support:  https://www.mql5.com/en/channels/vuongphamtrading **Version:** 1.04 | **Platform:** MetaTrader 5 | **Release:** January 2025 ## OVERVIEW The **Grid Trend Indicator** combines Supertrend with Dual EMA filters to identify high-probability trading opportunities. Unlike standard indicators showing only bullish/bearish signals, this adds a crucial third state: **NO TREND**. ### Key Features **Triple-State System**: UPTREND (Green) / DO
FREE
A buy signal can be seen on the dashboard when the previous signal is red and the next signal is green, then the SAR is green and the RSI is green. A Sell Signal can be seen on the dashboard when the previous Signal is green and the Signal after it is red, then the SAR is red and the RSI is red. Line function - shows on the chart the lines of Opening, Stop Loss, Take Profit. With this function, it is easy to create a new order and see its additional characteristics before opening.   TP and SL
FREE
SUPERTREND; It is a trend following indicator based on the SuperTrend ATR created by Olivier Seban. It can be used to detect changes in trend direction and locate stops. When the price falls below the indicator curve, it turns red and indicates a downtrend. Conversely, when the price moves above the curve, the indicator turns green, indicating an uptrend. Like other indicators, it works well on SuperTrend when used in conjunction with other indicators such as MACD, parabolik SAR, Bollinger Band
FREE
Mae Pla Green Pen Analysis Framework The Mae Pla Green Pen Analysis Framework is a multi-timeframe price action scanner for XAUUSD (Gold Spot) . It monitors all 9 timeframes simultaneously — M1, M5, M15, M30, H1, H4, D1, W1, and MN — and displays pattern detection results on a real-time dashboard drawn directly on the chart. The indicator is based on the Mae Pla Green Pen trading methodology, which uses structured price action patterns to identify potential trade setups. Pattern Detection Three
FREE
Smart Trend Suite Pro – Advanced Trend Indicator with Dashboard & Alerts Overview: Smart Trend Suite Pro is a powerful trend-detection indicator that offers traders a complete set of tools for accurate trend analysis and actionable insights. Designed for versatility and precision, Smart Trend Suite Pro adapts seamlessly to multiple timeframes and market conditions, making it suitable for various trading styles, including scalping and swing trading. Key Features: Real-Time Trend Detection: Identi
FREE
Bollibang!! master  最強のインジケーター・ボリンジャーバンド -  バンドウォークは強力なトレンドです Bollibang!! master は、ボリンジャーバンド widthを収録してあります。 別途Bollibang!! master Percent b をダウンロードしBB%bをインストールしてください。 概要 サブウィンドウ 1 — Bollinger BandWidth(BBW) ミドルバンドに対するボラティリティの大きさ
FREE
AI Gold Asia Signal v1.6 Professional Indicator - Asia/London Session Breakout for Gold (XAUUSD) OVERVIEW AI Gold Asia Signal automatically detects the Asian session price range on XAUUSD and generates breakout entry signals for the London and New York trading windows. All key levels are drawn directly on the chart - no manual calculation needed. HOW IT WORKS 1. During the Asian session (03:00-10:00 broker time) the indicator scans M15 candles and records the High and Low of the session. 2
This indicator finds Three Drives patterns. The Three Drives pattern is a 6-point reversal pattern characterised by a series of higher highs or lower lows that complete at a 127% or 161.8% Fibonacci extension. It signals that the market is exhausted and a reversal can happen. [ Installation Guide | Update Guide | Troubleshooting | FAQ | All Products ] Customizable pattern sizes Customizable colors and sizes Customizable breakout periods Customizable 1-2-3 and 0-A-B ratios It implements visual/s
FREE
Indicator and Expert Adviser  EA Available in the comments section of this product. Download with Indicator must have indicator installed for EA to work. Mt5 indicator alerts for bollinger band and envelope extremes occurring at the same time. Buy signal alerts occur when A bullish candle has formed below both the lower bollinger band and the lower envelope  Bar must open and close below both these indicators. Sell signal occur when A bear bar is formed above the upper bollinger band and upper
FREE
RSI Chart Levels
Nikolay Mitrofanov
4.83 (6)
The indicator draws levels based on the overbought and oversold values ​​of the RSI indicator. The maximum values ​​are taken into account, which are equal to or exceeded certain limits. That is, for example, when the price has gone into the overbought zone, the highest price is selected from all prices in this zone for this period of time, and as soon as the indicator value returns to a value below the overbought value, the level is fixed and the calculation of new values ​​begins. The same
FREE
フェニックス移動平均メーター (MT5) MetaTrader 5向けプロフェッショナルな移動平均トレンド分析・可視化ツール。インテリジェントな傾き分析、雲幅測定、相場状態分類を洗練されたリアルタイムダッシュボードに統合。 概要 フェニックス移動平均メーターは、速い移動平均と遅い移動平均の関係を分析し、トレンドの方向性、強さ、成熟度を判定します。本指標は移動平均の傾き角度、雲幅の拡大・縮小、クロスオーバー発生からの経過時間を継続的に監視し、現在の市場レジームをリアルタイムで分類します。 システムは二つの馬蹄形メーター表示を採用。傾き位置メーターは短期移動平均の角度を「下降→横ばい→上昇」まで可視化し、雲幅メーターはトレンドの圧縮・拡大を過去平均値と比較して測定します。両メーターが連動することで、勢いの質とトレンド持続性に関する即時的な洞察を提供します。 トレンド状態は強気・弱気双方において「弱」「中」「強」「延長」に自動分類されます。雲のカラーリングはトレンド状態に直接連動し、チャートとダッシュボード間の視覚的整合性を確保。ノイズを低減し、生指標値ではなく実用的なトレンド状態
FREE
This indicator is a straight port of a well known MetaTrader 4 indicator that is freely available on the Internet. It does not redraw at all. It implements a type of breakout strategy. The arrows indicate market direction. Use the indicator on M15 charts and higher. The indicator draws two bands near price action and generates signals when the price closes below the lower band and also above the upper band. The indicator uses periodic highs and lows to calculate upper and lower threshold bands.
FREE
Boom And Crash Live Arrow 100% Non-repaint trading indicator which appears on current candle stick Boom and crash LiveArrow comes with real time alerts  this trading indicator is Multi-timeframe and non-repaint on multi timeframe mode can be used on the 1 minute timeframe to the 4 hour timeframe important rules to know is that this is not a spike detector for crash 1000 look for blue buy arrows only and for boom 1000 look for red sell arrows only. do not hold trades exit once in profits. all the
FREE
EPo-CreW Forex Super ORB-H4 インジケーターへようこそ! 本ガイドでは、市場の最初の4時間のオープニングレンジに基づいて、高確率のトレード機会を特定するためのこの強力なツールの使い方を解説します。 初心者の方から経験豊富なトレーダーまで、このシステムはより高い自信と一貫性を持って取引する手助けとなります。 これはデモ製品です。インストール日から30日後に有効期限が切れます。フルバージョンはこちら: https://www.mql5.com/en/market/product/160926?source=Site OR https://t.me/Fundamental_fx 取引:すべての通貨、金(GOLD)とBTCUSD NB: M5 タイムフレームに切り替えることを確認してください。このインジケーターを使うのに最適なタイムフレームです。 トレーディング戦略 戦略1:ブレイクアウト & リトレースメント(メイン) SELL(売り)セットアップ: 価格が青いラインを上にブレイクする(高値ブレイク) ゴールドの BREAKOUT 矢印が表示される 価格が再び青い
FREE
Sometimes swaps are hidden for certain financial instruments , hence incurring unprecedented costs over night. The need to uncover hidden swap costs is vital for profitable trading. With that being said, this expert indicator helps the trader to uncover the hidden swap costs. Features chart objects with text short and long trade swap plug and play Advantages uncover hidden swaps plug and play, no other configurations are needed to use it. usable on all charts and symbols swaps can be easily s
FREE
Trend Range Indicator
Claudius Marius Walter
5 (1)
Introduction Poppsir is a trend-range indicator for metatrader 5 (for now), which distinguishes sideways phases from trend phases. With this tool it is possible to design a trend following-, meanreversion-, as well as a breakout strategy. This indicator does not repaint! The signal of the Poppsir indicator is quite easy to determine. As soon as the RSI and Popsir change their respective color to gray, a breakout takes place or in other words, the sideways phase has ended. Interpretation
FREE
このプロダクトを購入した人は以下も購入しています
SuperScalp Pro — 高度なマルチフィルター対応スキャルピングインジケーターシステム SuperScalp Pro は、クラシックな Supertrend と複数のインテリジェントな確認フィルターを組み合わせた高度なスキャルピング用インジケーターシステムです。M1〜H4 のすべての時間足で効率的に機能し、特に XAUUSD、BTCUSD、および主要なFX通貨ペアに適しています。単体のシステムとして、また既存の取引戦略へ柔軟に統合して使用できます。 本インジケーターは 11 以上のフィルターを統合しており、短期・長期の EMA、トレンド判定に用いる 3 本の EMA、EMA スロープ(EMA slope)、RSI、ADX、出来高、VWAP、ボリンジャーバンドのブレイクアウト、MACD ダイバージェンスフィルターなどを含みます。スマートキャンドルフィルターはローソク足の終値を確認して弱いシグナルを排除し、3 本の EMA と MACD ダイバージェンスを組み合わせたトレンド認識メカニズムにより勝率の高いシグナルの選別を支援します。 SuperScalp Pro は ATR に基
Azimuth Pro
Ottaviano De Cicco
5 (6)
発売プロモーション Azimuth Proは先着100名様限定で 299ドル でご提供します。最終価格は 499ドル となります。 リテールとインスティテューショナルのエントリーの違いはインジケーターではなく、ロケーションにあります。 多くのトレーダーは、モメンタムを追いかけたり、遅行シグナルに反応して、任意の価格レベルでエントリーします。機関投資家は、需給が実際にシフトする構造的なレベルに価格が到達するのを待ちます。 Azimuth Proはこれらのレベルを自動的にマッピングします:スイングアンカーVWAP、マルチタイムフレーム構造ライン、高確率ロケーションにのみ出現するABCパターン。 Azimuth Proは、構造分析とインテリジェントな自動化の両方を求めるプロフェッショナルトレーダー向けに構築されています。 Azimuthが外科的精度で市場構造をマッピングする一方、Azimuth Proはインテリジェンスレイヤーを追加します:トレーディングスタイルの自動検出、スマート設定された移動平均線、20年のデータでバックテストされた最適化パラメータ。その結果、お使いの銘柄と
Entry In The Zone and SMC Multi Timeframe is a real-time market analysis tool developed based on Smart Money Concepts (SMC). It is designed to analyze market structure, price direction, reversal points, and key zones across multiple timeframes in a systematic way. The system displays Points of Interest (POI) and real-time No Repaint signals, with instant alerts when price reaches key zones or when signals occur within those zones. It functions as both an Indicator and a Signal System (2-in-1), c
このインジケーターを購入された方には、以下の特典を 無料 で提供しています: 各トレードを自動で管理し、ストップロスとテイクプロフィットを設定し、戦略ルールに基づいてポジションを決済する補助ツール 「Bomber Utility」 様々な銘柄に合わせたインジケーターの設定ファイル(セットファイル) 「最小リスク」、「バランスリスク」、「待機戦略」 の3つのモードで使用できる Bomber Utility 用の設定ファイル このトレーディング戦略をすぐに導入・設定・開始できる ステップバイステップのビデオマニュアル ご注意: 上記の特典を受け取るには、MQL5のプライベートメッセージシステムを通じて販売者にご連絡ください。 オリジナルのカスタムインジケーター 「Divergence Bomber(ダイバージェンス・ボンバー)」 をご紹介します。これは、MACDのダイバージェンス(乖離)戦略に基づいた 「オールインワン」型のトレーディングシステム です。 このテクニカルインジケーターの主な目的は、価格とMACDインジケーターの間に発生するダイバージェンスを検出 し、将来の価格の動きを示す
ARICoin is a powerful trading companion designed to generate high-probability entry signals with dynamic TP/SL/DP levels based on volatility. Built-in performance tracking shows win/loss stats, PP1/PP2 hits, and success rates all updated live. Key Features: Buy/Sell signals with adaptive volatility bands Real-time TP/SL/DP levels based on ATR Built-in MA Filter with optional ATR/StdDev volatility Performance stats panel (Success, Profit/Loss, PP1/PP2) Alerts via popup, sound, push, or email Cust
CGE Trading Suite
Carl Gustav Johan Ekstrom
5 (1)
CGE Trading Suite delivers the analytical edge typically reserved for professional trading desks. The platform integrates a full suite of analytical tools into one seamless workflow: dynamic grid mapping, liquidity behavior analysis, ECM, trend lines, MIDAS, trade cycles, and directional channel projections. Together, these provide a unified view of market structure and momentum. Directional clarity is further enhanced by the capital flow index, which measures currency basket strength to identif
このインジケーターを購入すると、プロ仕様のトレードマネージャーを無料で差し上げます。 まず第一に、このトレーディングシステムがノンリペイント、ノンリドロー、ノンラグのインジケーターであることを強調する価値がある。これにより、手動取引とロボット取引の両方に理想的なものになっています。 オンラインコース、マニュアル、プリセットのダウンロード。 「スマートトレンドトレーディングシステム MT5」は、新規および経験豊富なトレーダー向けにカスタマイズされた包括的なトレーディングソリューションです。10以上のプレミアムインジケーターを組み合わせ、7つ以上の堅実なトレーディング戦略を備えており、多様な市場状況に対応する多目的な選択肢となっています。 トレンドフォロー戦略:トレンドを効果的に乗り越えるための正確なエントリーとストップロス管理を提供します。 リバーサル戦略:潜在的なトレンドの反転を特定し、トレーダーがレンジ相場を活用できるようにします。 スキャルピング戦略:高速で正確なデイトレードおよび短期取引のために設計されています。 安定性:すべてのインジケーターはノンリペイント、ノンリドロー、ノ
Meridian Pro
Ottaviano De Cicco
5 (1)
Meridian Pro:MT5用プロフェッショナル・マルチタイムフレーム・トレンドマトリックス 概要 Meridian Pro は Merkava Labs が開発したマルチタイムフレーム・トレンドマトリックスで、方向性の状態、強度、モメンタムの状況、マトリックスの合意をひとつのコンパクトなパネルに集約します。ひとつのアダプティブエンジンがM1からW1まで一貫して適用されます。シンボルごとの調整は不要。インジケーターの積み重ねも不要。すべてのアセットとすべてのタイムフレームをカバーするひとつの構造化された読み取りです。 発売キャンペーン — Meridian Proを USD 99 (導入価格)で入手。通常価格:USD 149 。 1. Meridian Proが他と異なる理由 ひとつのエンジン、バラバラなインジケーターのダッシュボードではない 多くのMTFダッシュボードは、タイムフレームごとに生のインジケーター値を繰り返すだけです。Meridian Proはマトリックス全体でひとつのアダプティブ・トレンドエンジンを使用するため、パネルの各行が同じ構造化フレームワークから導出されます
Gold Entry Sniper – ゴールドスキャルピング&スイングトレード用プロフェッショナル多時間足ATRダッシュボード Gold Entry Sniper は、XAUUSDや他の銘柄向けに正確な 売買シグナル を提供する、MetaTrader 5用の高度なインジケーターです。 ATRトレーリングストップロジック と 多時間足分析ダッシュボード を搭載し、スキャルピングからスイングトレードまで対応します。 主な特徴と利点 多時間足シグナル分析 – M1、M5、M15 のトレンドを同時表示。 ATRベースのトレーリングストップ – ボラティリティに応じて動的に調整。 プロ仕様のチャートダッシュボード – シグナル状況、ATRレベル、回帰線、売買方向を表示。 明確な売買マーカー – 自動矢印とテキストラベル。 エグジットアラートとトレード管理 – 利益確定のための自動検出。 完全カスタマイズ可能 – パネル位置、色、フォント、ATR/回帰設定を調整可能。 ゴールド(XAUUSD)に最適化 – M1〜M15のスキャルピングに最適、FXや指数、暗号資産にも対応。 Gold Entry
RelicusRoad Pro: 定量的市場オペレーティングシステム 【期間限定】無制限アクセス 70% OFF - 2,000人超のトレーダーと共に なぜ多くのトレーダーは「完璧な」インジケーターを使っても失敗するのでしょうか? それは、文脈を無視して 単一の概念 だけでトレードしているからです。文脈のないシグナルは単なるギャンブルです。勝ち続けるには、 根拠の重なり(コンフルエンス) が必要です。 RelicusRoad Proは単なる矢印インジケーターではありません。完全な 定量的市場エコシステム です。独自のボラティリティモデリングを用いて、価格が推移する「適正価値の道(Fair Value Road)」をマッピングし、ノイズと真の構造的ブレイクを判別します。 推測はやめましょう。機関投資家レベルの「ロード・ロジック」でトレードを。 コアエンジン:「Road」アルゴリズム システムの中心となる Road Algo は、市場環境にリアルタイムで適応するダイナミックなボラティリティチャネルです。 安全ライン(平衡点) と、価格が数学的に反転しやすい 拡張レベル を投影します。 Si
FX Trend NG:次世代マルチマーケット・トレンドインテリジェンス 概要 FX Trend NG は、複数の時間足に対応したプロフェッショナル向けトレンド分析およびマーケット監視ツールです。 市場全体の構造を数秒で把握することができます。 複数のチャートを切り替える必要はありません。どの銘柄がトレンド中なのか、どこでモメンタムが弱まっているのか、そしてどの時間足で強い整合性があるのかを瞬時に確認できます。 ローンチ特別オファー – FX Trend NG を $30(6ヶ月) または $80 永久ライセンス でご利用いただけます。 すでに Stein Investments のユーザーですか? -> メッセージを送信 して、プライベートグループへアクセスしてください。 セットアップや詳細情報が必要ですか? -> Stein Investments 公式ページ をご覧ください。 1. FX Trend NG が他と異なる理由 3ステート・トレンドロジック ― Buy と Sell だけではない • 多くのインジケーターは Buy または Sell の2状態のみを表示します。
AriX
Temirlan Kdyrkhan
1 (4)
AriX Indicator for MT5 A powerful trend-following and signal-evaluation tool AriX is a custom MT5 indicator that combines Moving Averages and ATR-based risk/reward logic to generate clear buy/sell signals. It visualizes dynamic SL/TP levels, evaluates past trade outcomes, and displays win/loss statistics in a clean on-chart panel. Key features include: Buy/Sell signals based on MA crossovers ATR-based SL/TP1/TP2/TP3 levels with visual lines and labels Signal outcome tracking with real-time stat
Power Candles – あらゆる市場に対応した強度ベースのエントリーシグナル Power Candles は、Stein Investments が長年培ってきた強度分析を価格チャート上に直接反映します。価格だけに反応するのではなく、各ローソク足は実際の市場の強さに基づいて色分けされ、モメンタムの蓄積、強度の加速、明確なトレンド転換を瞬時に把握できます。 すべての市場に共通する単一ロジック Power Candles は すべての取引シンボル で自動的に動作します。現在のシンボルが Forex か非 Forex 市場かを自動判別し、内部で適切な強度モデルを適用します。 Forex および Gold :FX Power のデルタ値を使用(絶対値レンジ最大 100) 指数、暗号資産、CFD :IX Power の強度値を使用(絶対値レンジ最大 50) 必要な強度計算は Power Candles に直接組み込まれています。ローソク足のカラーリングやシグナルロジックに、追加のインジケーターは不要です。 価格ノイズではなく「強度状態」 各ローソク足は、以下の 9 つの明確に定義された強
Quantum TrendPulse を ご紹介します。これは、   SuperTrend   、   RSI   、および Stochastic のパワーを 1 つの包括的なインジケーターに組み合わせて、取引の可能性を最大限に引き出す究極の取引ツールです。精度と効率を求めるトレーダー向けに設計されたこのインジケーターは、市場のトレンド、勢いの変化、最適なエントリー ポイントとエグジット ポイントを自信を持って特定するのに役立ちます。 主な特徴: SuperTrend 統合: 現在の市場動向に簡単に追従し、収益性の波に乗ることができます。 RSI精度: 買われすぎと売られすぎのレベルを検出し、市場の反転のタイミングに最適で、SuperTrendのフィルターとして使用されます。 確率的精度: 確率的振動を活用して、変動の激しい市場で隠れたチャンスを見つけます。SuperTrend のフィルターとして使用されます。 マルチタイムフレーム分析:   M5 から H1 または H4 まで、さまざまなタイムフレームで市場を常に把握します。 カスタマイズ可能なアラート: カスタム取引条件が満たされ
トレンド スクリーナー インジケーターでトレンド取引の力を解き放ちます。ファジー ロジックと複数通貨システムを活用した究極のトレンド取引ソリューションです。 ファジー ロジックを活用した革新的なトレンド インジケーターである Trend Screener を使用して、トレンド取引を向上させます。 これは、13 を超えるプレミアム ツールと機能、および 3 つの取引戦略を組み合わせた強力なトレンド追跡インジケーターであり、Metatrader をトレンド アナライザーにする多用途の選択肢となります。 期間限定オファー : トレンド スクリーナー インジケーターは、わずか 100 ドルで生涯ご利用いただけます。 (元の価格 50$ ) (オファー延長) Trend Screener の 100% 非再描画精度の揺るぎない精度を体験して、取引の決定が過去の価格変動の影響を受けないようにしてください。 マルチタイムフレームおよびマルチ通貨機能の多用途性を解放し、比類のない自信を持って外国為替、商品、暗号通貨、インデックスの世界を取引できるようにします。 Trend Screener の包括的な
[ My Products ] , [ My Channel ]   ,  [ LIVE SIGNAL ] HFT Spike Detector HFT Spike Detector は、高頻度取引(HFT)による急激な価格変動をリアルタイムで分析・測定するために開発されたプロフェッショナルなティック監視ツールです。 目的は、ブローカーによって引き起こされる異常なスリッページ、流動性のギャップ、ミリ秒単位の価格スパイクを数値データで検出できるようにすることです。 リアルタイムのティックフローと約定条件を分析するため、バックテストで正確に評価することはできません。 このEAは、自動化のために用意されたセットファイルと一緒に使用するために購入できます: VolumeHedger EA 動作原理 この Expert Advisor は、受信するすべてのティックをリアルタイムで分析し、以下を行います: 価格変動速度 1秒あたりのティック密度 スリッページの大きさ 同方向のマイクロフロー 測定し、チャート上のパネルに表示します。 これにより、スプレッドを除いた実際の執行品質を確認できま
まず第一に、この取引インジケーターは再描画されず、再描画されず、遅延しないことを強調する価値があります。これにより、手動取引とロボット取引の両方に理想的なものになります。 ユーザーマニュアル:設定、入力、戦略。 アトミックアナリストは、価格の強さとモメンタムを利用して市場でより良いエッジを見つけるためのPA価格アクションインジケーターです。ノイズや誤ったシグナルを除去し、取引ポテンシャルを高めるための高度なフィルターを備えています。複雑なインジケーターの複数のレイヤーを使用して、アトミックアナリストはチャートをスキャンし、複雑な数学的計算をシンプルなシグナルと色に変換します。これにより、どのような初心者トレーダーでも理解して使用し、一貫した取引の決定を行うことができます。 「アトミックアナリスト」は、新規および経験豊富なトレーダー向けにカスタマイズされた包括的な取引ソリューションです。プレミアムインジケーターとトップノッチの機能を1つの取引戦略に組み合わせ、すべてのタイプのトレーダーにとって汎用性のある選択肢にします。 デイリートレーディングとスキャルピング戦略:高速で正確なデイ
マーケットメーカーのためのツール。 Meravith は次の機能を提供します: すべての時間足を分析し、現在有効なトレンドを表示します。 強気と弱気の出来高が等しくなる流動性ゾーン(出来高均衡)を強調表示します。 異なる時間足のすべての流動性レベルをチャート上に直接表示します。 テキスト形式の市場分析を生成し、参考情報として表示します。 現在のトレンドに基づいて目標値、サポートレベル、ストップロスを計算します。 取引のリスクリワード比を算出します。 口座残高に基づいてポジションサイズを計算し、潜在的な利益を推定します。 また、市場に大きな変化があった場合には警告を表示します。 インジケーターの主要ライン: 強気/弱気の出来高エグゾーストライン ― 目標値として機能します。 市場のトレンドを示すライン。市場が強気か弱気かによって色が変わり、トレンドのサポートとして機能します。主にその色が市場センチメントを示します。 出来高均衡ライン(Eq)。Eq(Volume Equilibrium)ラインはシステムの中核です。これは買い手と売り手の出来高のバランスポイントを表します。市場の流動性を示し
OmniSync Projection
Antonio-alin Teculescu
5 (1)
Chronos Fractal Engine is an innovative price projection indicator for MetaTrader 5, designed to transform your technical analysis by intelligently identifying and projecting historical price patterns. Built upon an advanced correlation algorithm and the fractal principles of the market, this powerful tool visualizes potential future price movements, giving you a unique edge in your trading decisions. What is Chronos Fractal Engine? At its core, the Chronos Fractal Engine employs a sophisticat
優れたテクニカルインジケーター「Grabber」をご紹介します。これは、すぐに使える「オールインワン」トレーディング戦略として機能します。 ひとつのコードに、市場のテクニカル分析ツール、取引シグナル(矢印)、アラート機能、プッシュ通知が強力に統合されています。 このインジケーターを購入された方には、以下の特典を無料で提供します: Grabberユーティリティ:オープンポジションを自動で管理するツール ステップバイステップのビデオマニュアル:インジケーターのインストール、設定、取引方法を解説 カスタムセットファイル:インジケーターをすばやく自動設定し、最大限の成果を出すための設定ファイル 他の戦略はもう忘れてください!Grabberだけが、あなたを新たなトレードの高みへと導いてくれるのです。 Grabber戦略の主な特徴: 推奨タイムフレーム:M5〜H4 対応通貨ペア・資産:どれでも使用可能ですが、私が実際に検証した以下を推奨します(GBPUSD、GBPCAD、GBPCHF、AUDCAD、AUDUSD、AUDSGD、AUDCHF、NZDUSD、NZDCAD、EURCAD、EURUSD、E
Bill Williams Advanced is designed for automatic chart analysis using Bill Williams' "Profitunity" system. The indicator analyzes four timeframes at once. Manual (Be sure to read before purchasing) Advantages 1. Analyzes the chart using Bill Williams' "Profitunity" system. Signals are displayed in a table in the corner of the screen and on the price chart. 2. Finds all known AO and AC signals, as well as zone signals. Equipped with a trend filter based on the Alligator. 3. Finds "Divergence Bar
Currency Strength Dashboard Pro MetaTrader 5 用の リアルタイム通貨強度分析プロフェッショナルダッシュボード 。 このインジケーターは、 8つの主要通貨 (EUR、USD、GBP、JPY、CHF、AUD、CAD、NZD)の強さを計算し、 28の通貨ペア を同時に複数の時間足で分析・表示します。 ダッシュボードにより、トレーダーは 市場全体の状況を一目で把握 でき、余計な計算や複数のチャートを切り替える必要がありません。 計算方法 このインジケーターは、 高度な数学的通貨強度分析手法 に基づいています。 これは、類似インジケーターで一般的に使用されている RSIベースの手法 と比較して、より正確で客観的です。 この方法は 28の通貨ペアすべての相互関係を同時に分析 し、市場における実際の力関係をよりクリーンで偏りのない形で表示します。 リアルタイムダッシュボード メインテーブルには 8つの通貨 の完全なデータが表示されます。 Rank(順位) — 通貨の総合強度による順位。 1(最も強い)〜8(最も弱い) 。 Strength(強度) — 現在
FX Power: 通貨の強弱を分析して、より賢い取引を実現 概要 FX Power は主要通貨と金の実際の強弱をあらゆる市場状況で理解するための必須ツールです。強い通貨を買い、弱い通貨を売ることで、 FX Power は取引の意思決定を簡素化し、高い確率の取引機会を見出します。トレンドを追従する場合でも、極端なデルタ値を使用して反転を予測する場合でも、このツールはあなたの取引スタイルに完全に適応します。ただ取引するだけではなく、 FX Power で賢く取引をしましょう。 1. なぜ FX Power がトレーダーにとって非常に有益なのか 通貨と金のリアルタイム強弱分析 • FX Power は主要通貨と金の相対的な強弱を計算し、マーケットダイナミクスに関する明確な洞察を提供します。 • どの資産がリードしているか、または後れを取っているかを監視して、取引するペアを賢く選びましょう。 マルチタイムフレームの包括的なビュー • 短期、中期、長期のタイムフレームで通貨と金の強弱を追跡し、マーケットトレンドに基づいて取引戦略を調整できます。 • スキャルピングからスイングトレード
ご紹介     Quantum Breakout PRO は 、ブレイクアウト ゾーンの取引方法を変革する画期的な MQL5 インジケーターです。 13年以上の取引経験を持つ経験豊富なトレーダーのチームによって開発されました。     クォンタム ブレイクアウト プロ   は、革新的でダイナミックなブレイクアウト ゾーン戦略により、あなたのトレーディングの旅を新たな高みに押し上げるように設計されています。 クォンタム ブレイクアウト インジケーターは、5 つの利益ターゲット ゾーンを備えたブレイクアウト ゾーン上のシグナル矢印と、ブレイクアウト ボックスに基づいたストップロスの提案を提供します。 初心者トレーダーにもプロのトレーダーにも適しています。 量子EAチャネル:       ここをクリック 重要!購入後、インストールマニュアルを受け取るためにプライベートメッセージを送ってください。 推奨事項: 時間枠: M15 通貨ペア: GBPJPY、EURJPY、USDJPY、NZDUSD、XAUUSD アカウントの種類: ECN、Raw、またはスプレッドが非常に低い R
Market Structure Order Block Dashboard MT5 は、 MT5(MetaTrader 5)用インジケーター です。 市場構造 と ICT / Smart Money Concepts に基づき、 HH/HL/LH/LL 、 BOS 、 ChoCH に加えて、 Order Blocks 、 Fair Value Gaps (FVG) 、 流動性 (EQH/EQL、sweeps)、 セッション / Kill Zones 、 Volume Profile を表示し、コンパクトなコンフルエンス・ダッシュボードを提供します。 重要: これは 分析ツール です。自動売買は行いません(EAではありません)。 購入者特典(ボーナス) 購入後、私のストアから 2つのボーナスインジケーター を(選択して)受け取ることができます。 ボーナスの受け取り方法: 1) 本商品のページに正直なレビューを投稿してください。 2) MQL5のメッセージで、 BONUS MSOB + 選んだ 2つのインジケーター名 を送ってください。 主な機能 市場構造: HH/HL/LH/LL
このインジケーターは、反転ポイントと価格戻りゾーンを正確に表示します。     主要プレーヤー 。新たなトレンドが形成される場所を把握し、最大限の精度で意思決定を行い、すべての取引をコントロールします。 TREND LINES PRO インジケーターと組み合わせることで、その潜在能力を最大限に発揮します。 VERSION MT4 インジケーターが示す内容: 新しいトレンドの始まりに活性化する反転構造と反転レベル。 リスクと報酬の比率を最小限に抑えた利益 確定 と 損失停止の レベルの表示     RR 1:2   。 インテリジェントな削減ロジックによるストップロス。 指定されたインジケーターから 2 つのトレンド タイプの反転パターンを表示します。 指標: トレンドを追う   TREND LINES PRO   (世界的なトレンドの変化) TREND PRO   (クイックトレンド変更) シンプルで効果的   スキャナー   リアルタイムトレンド(新機能)。 マルチタイムフレームのインストゥルメント フィルタリング。 画面   利益     LOGIC AI信号の後。 当日プラス方
現在33%オフ 初心者にもエキスパートトレーダーにも最適なソリューション このインジケーターは独自の機能と新しい公式を多数内蔵しており、ユニークで高品質かつ手頃な取引ツールです。このアップデートでは、2つの時間枠ゾーンを表示できるようになります。より長いTFだけでなく、チャートTFとより長いTF(ネストゾーンを表示)の両方を表示できます。すべてのSupply Demandトレーダーの皆さんのお気に召すはずです。:) 重要情報の公開 Advanced Supply Demandの可能性を最大化するには、 https://www.mql5.com/ja/blogs/post/720245 にアクセスしてください。   エントリーまたはターゲットの正確なトリガーポイントを正確に特定できれば取引がどのように改善されるか想像してみてください。新しい基盤となるアルゴリズムに基づいて構築されているため、買い手と売り手の間の潜在的な不均衡をさらに簡単に特定できます。これは、最も強い需要と供給のゾーンと、過去のパフォーマンス(古いゾーンを表示)がグラフィカルに表現されるためです。これらの機能は、最適な
The Trend Forecaster indicator utilizes a unique proprietary algorithm to determine entry points for a breakout trading strategy. The indicator identifies price clusters, analyzes price movement near levels, and provides a signal when the price breaks through a level. The Trend Forecaster indicator is suitable for all financial assets, including currencies (Forex), metals, stocks, indices, and cryptocurrencies. You can also adjust the indicator to work on any time frames, although it is recommen
Crystal Heikin Ashi Signals - Professional Trend & Signal Detection Indicator Advanced Heikin Ashi Visualization with Intelligent Signal System for Manual & Automated Trading Final Price: $149 ---------> Price goes up $10 after every 10 sales . Limited slots available — act fast . Overview Crystal Heikin Ashi Signals is a professional-grade MetaTrader 5 indicator that combines pure Heikin Ashi candle visualization with an advanced momentum-shift detection system. Designed for both manual traders
Smart Stop Indicator – チャート上で実現するインテリジェントなストップロス精度 概要 Smart Stop Indicator は、ストップロスを勘や感情ではなく、明確で体系的に設定したいトレーダーのために設計されています。本ツールは、クラシックなプライスアクション(高値更新・安値切り下げ)と最新のブレイクアウト認識ロジックを組み合わせ、次に来るべき論理的なストップレベルを正確に特定します。トレンド相場、レンジ、急速なブレイクアウト局面のいずれであっても、最適な SL ゾーンとその状態(“new”、“broken”、“valid”)をチャート上に直接表示します。さらに今回、SL 距離の %ADR 表示も新たに追加されています。 主な特徴 マーケット構造に基づく自動ストップ配置 • 市場構造とリアルタイムの値動きに基づき、意味のあるストップロスレベルを自動検出します。 スマートなブレイクアウト感知 • 急激な方向転換やブレイクアウトにも柔軟に対応し、早すぎるストップ調整を避けます。 SL %ADR の表示 • ストップロスまでの距離を ADR(Averag
作者のその他のプロダクト
The Volume Delta Indicator is a technical analysis tool that combines volume analysis with price action to identify potential trading opportunities. This indicator analyzes the difference between buying and selling pressure through candle structure analysis. Key Features Volume Delta Calculation : Measures buy/sell volume difference using candle structure analysis EMA Smoothing : Applies exponential moving average to smooth volume data Breakout Detection : Identifies price breakouts with volume
FREE
The VSA (Volume Spread Analysis) Volume Indicator is a powerful technical tool used by traders to analyze the relationship between price movement and trading volume. Rooted in the Wyckoff methodology, VSA helps identify imbalances between supply and demand, revealing the hidden actions of institutional players—often referred to as “smart money.” This indicator evaluates three key elements: volume, price spread (the difference between high and low), and closing price. By interpreting these facto
FREE
Timeframe Simulator Indicator This indicator redraws candlestick structures from a higher timeframe onto your current chart. It helps visualize higher-period price action without switching timeframes, making it easier to analyze trends and key levels while trading on lower timeframes. Main features: Customizable Candles   – Adjust the appearance of higher timeframe candles (bull/bear colors, wick style, gaps, and history length). Higher Timeframe Lines   – Optionally display dynamic high, low,
FREE
Chỉ báo Watermark là một công cụ trực quan thường được sử dụng để lưu trữ các ký hiệu giao dịch và khung thời gian. Các tính năng chính trên chỉ báo: Tạo nhãn dán ký hiệu giao dịch tạo nhãn dán khung thời gian giao dịch Cố định vị trí theo chart giá Chỉ báo không tác động đến các tín hiệu giao dịch của nhà đầu tư. Nếu có bất kỳ vấn đề vui lòng phản hồi lại để chúng tôi có thể cải thiện sản phẩm.
FREE
TM Assistant Trade is a trading assistant tool designed for MetaTrader 5 (MT5). It helps users configure, monitor and manage trades directly on the chart through an interactive interface, minimizing manual operations and improving trading consistency. Introduction to TM Assistant Trade 1. Trading Interface Line Function - Display on the trading screen (Entry price - Take profit - Stop loss) through icons and lines to help traders perform operations more conveniently. Main area with screens displ
フィルタ:
Orion Andrews
18
Orion Andrews 2025.08.30 04:01 
 

ユーザーは評価に対して何もコメントを残しませんでした

レビューに返信