Control Points MT5
- インディケータ
- バージョン: 1.2
- アップデート済み: 11 3月 2026

ControlPoints インジケーター
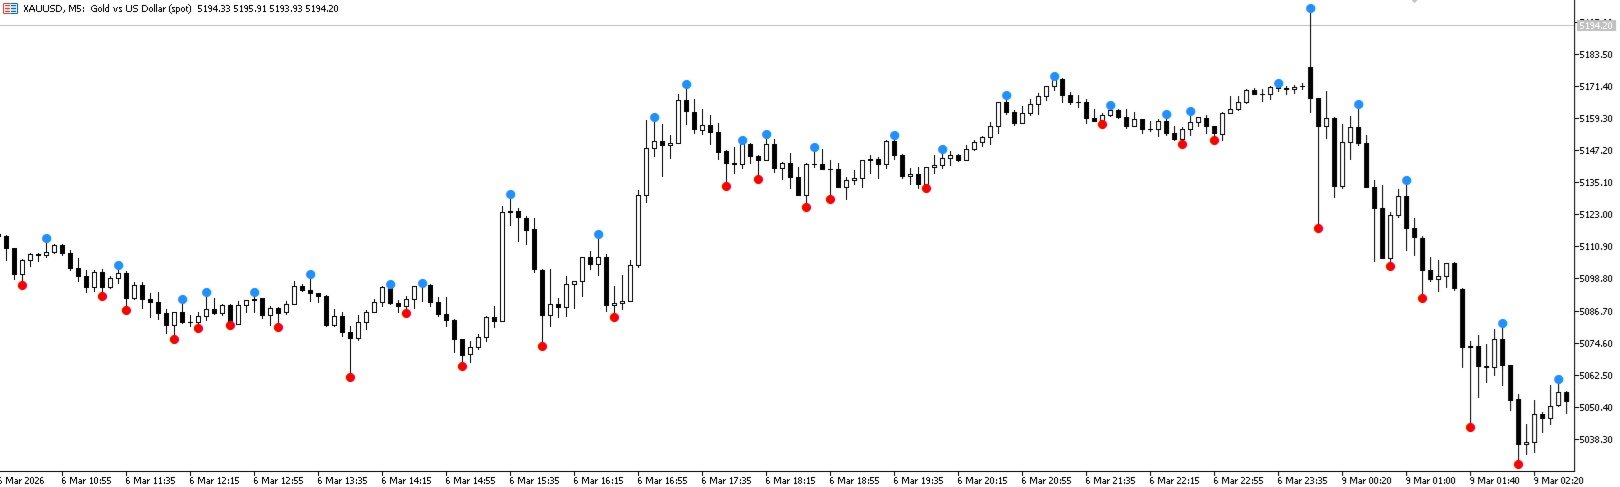
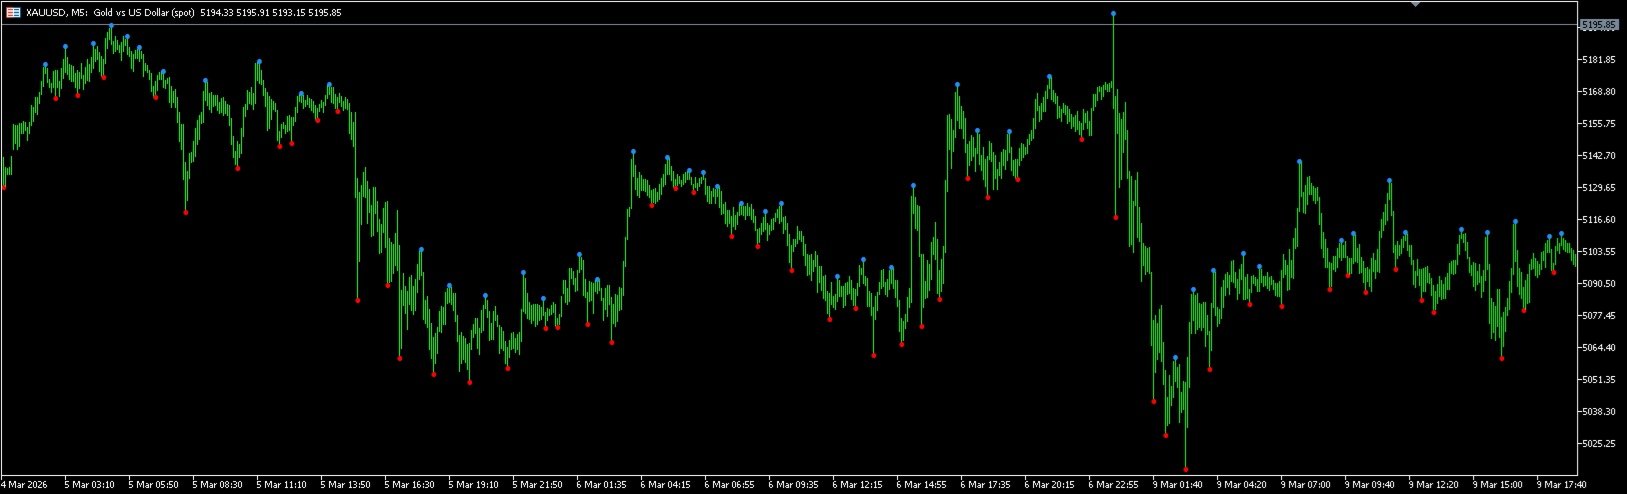
目的: コントロールポイント(CP)— チャート上の局所的極値(フラクタル)を特定します。上側 CP は局所的高値(high による)、下側 CP は局所的安値(low による)です。チャート上にひし形で表示されます。
No-Repaint: 本インジケーターは再描画しません。バー i の CP は、ウィンドウ [i − 前のバー数, i + 後のバー数] 内のすべてのバーが確定したときにのみ確定します。形成中の(現在の)バーは決して評価されません。確定後、その値は再計算されません。
CP 判定ロジック
上側 CP: 範囲 [i − 前のバー数 .. i + 後のバー数](ただし j ≠ i)内のすべての high[j] よりも high[i] が厳密に大きい。
下側 CP: 同じ範囲内(ただし j ≠ i)のすべての low[j] よりも low[i] が厳密に小さい。
同一のバーが上側 CP と下側 CP を同時に兼ねることがあります。
パラメーター
| № | パラメーター | 型 | 既定 | 説明 |
|---|---|---|---|---|
| 1 | 前のバー数 | int | 2 | 候補バーの左側で、high がより低い(上側 CP の場合)または low がより高い(下側 CP の場合)必要のある確定済みバーの数。最小 1。 |
| 2 | 後のバー数 | int | 2 | 候補バーの右側で極値を確認する必要のある確定済みバーの数。CP 出現の遅延を決定します:バー i 上の点は、バー i + 後のバー数 が確定して初めて出現します。最小 1。 |
| 3 | 上側 CP の色 | color | clrDodgerBlue | 上側 CP のひし形の色。 |
| 4 | 下側 CP の色 | color | clrRed | 下側 CP のひし形の色。 |
| 5 | ひし形のサイズ | int | 2 | 表示されるひし形のサイズ(ピクセル単位の太さ)。最小 1。 |
バッファ
| インデックス | 名前 | 内容 |
|---|---|---|
| 0 | Upper CT | バー i が上側 CP の場合は high[i]、そうでなければ EMPTY_VALUE |
| 1 | Lower CT | バー i が下側 CP の場合は low[i]、そうでなければ EMPTY_VALUE |
注記
等しい場合 ( high[i] == high[j] または low[i] == low[j] ) CP は形成されません — 厳密に上回る(下回る)必要があります。
「前のバー数」/「後のバー数」パラメーターを大きくすると CP の重要度が増します(小さな変動を除外します)が、遅延が増え、ポイントの数が減ります。