Clever Range Predictor
- 지표
-
Carlos Forero
 저는 자본 시장 및 알고리즘 포트폴리오 구축 분야에서 10년 이상의 경험을 가진 전문 개발자이자 트레이더입니다. MetaTrader를 위한 고급 자동화 시스템 및 기술 분석 도구 개발을 전문으로 합니다.
⚙️ 개발 철학
저의 접근 방식은 엄격하게 정량적이고 데이터 기반입니다. 시장 노이즈를 필터링하고 실질적인 통계적 우위를 제공하도록 시스템을 설계합니다. 저는 지름길을 찾지 않으며, 거래에 수학과 논리를 적용합니다.
🔷 저의 도구에서 무엇을 기대할 수 있습니까? - 버전: 1.48
- 업데이트됨: 6 4월 2025
- 활성화: 5
Description:
The indicator predicts, with a specific probability, if the actual candlestick range will expand or contract compared to the range of a previous candle. Furthermore, the indicator shows the possible high or low of the actual candle, based on trend direction. (Recommended for Daily, Weekly, or Monthly timeframes).
KEY LINKS: Indicator Manual – How to Install – Frequent Questions - All Products
How to use the indicator:
- Determines, with a certain probability, if there will be a volatile candle range expansion or contraction for the actual candlestick.
- Give alerts when the Price breakout any of the drawn levels.
- You will know which price levels could be the high or low for the actual candlestick.
- You can combine different timeframes' volatility expansion/contraction probability, and with it, determine a possible price direction.
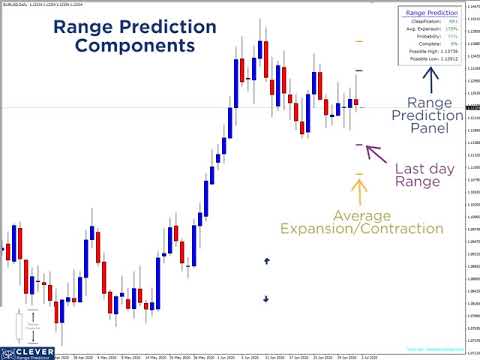
Components:
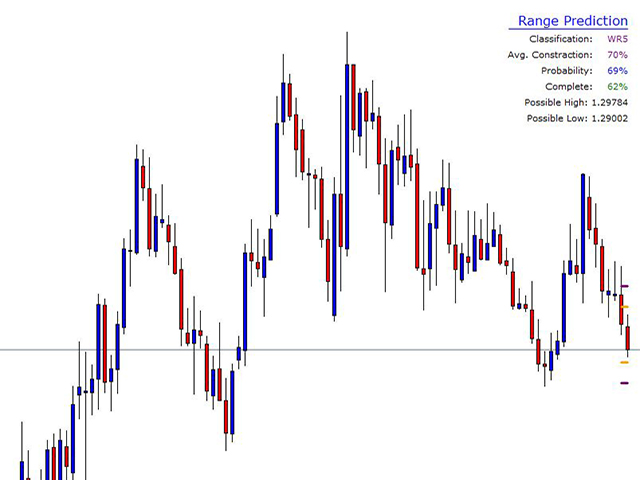
Table
- Classification: Considering the range of a previous candle, which is compared with its previous 7 candles, the indicator will assign a classification between Narrow Range and Wide range (Based Tony Crabbel Book). If the candle range is predicted to be smaller than the previous candle, the indicator will classify it as "NR" (narrow range). On the other hand, if the candle range is predicted to be bigger than the previous candle, then the indicator will classify it as "WR" (wide range). Finally, the number next to the "NR" or "WR" acronym represents the number of previous candle sticks which were used to make the prediction.
- Avg. Expansion or Constraction: It will determine the average percentage of range expansion or contraction, that the actual candle will have compared to the previous one.
- Probability: Average probability for the actual candle range to expand or contract.
- Complete: Level of range completion, as a percentage, of the actual candlestick range based on the previous candle range.
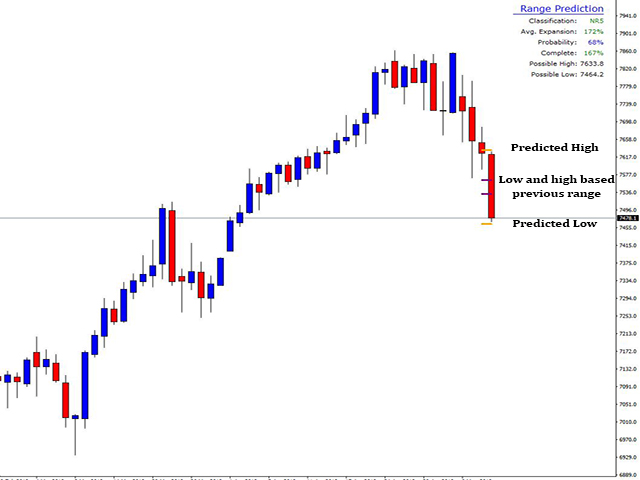
- Possible High or Low: Possible levels that the predicted price could reach, if the actual price candle accomplishes the average percentage of expansion or contraction.
Lines
- Orange Lines: Shows the possible High or Low for the actual candle stick in chart.
- Purple Lines: Shows the previous timeframe price range, in the actual candlestick in chart.
About Author:
Carlos Forero, Member of Clever Trading Club, private organization with the purpose of design clever solutions to generate constant profits with adapted risk.

Very good indicator, I recommend.