Candle Pattern Pro
- インディケータ
-
Komang Putra Riswanjaya
 I am a freelance developer specializing in MQL4, MQL5, and Pine Script, focused on building custom trading solutions for MetaTrader and TradingView platforms.
My services include:
* Expert Advisors (EA)
* Custom Indicators
* Trading Tools & Utilities
* Strategy Automation - バージョン: 2.0
- アップデート済み: 15 3月 2026
- アクティベーション: 5
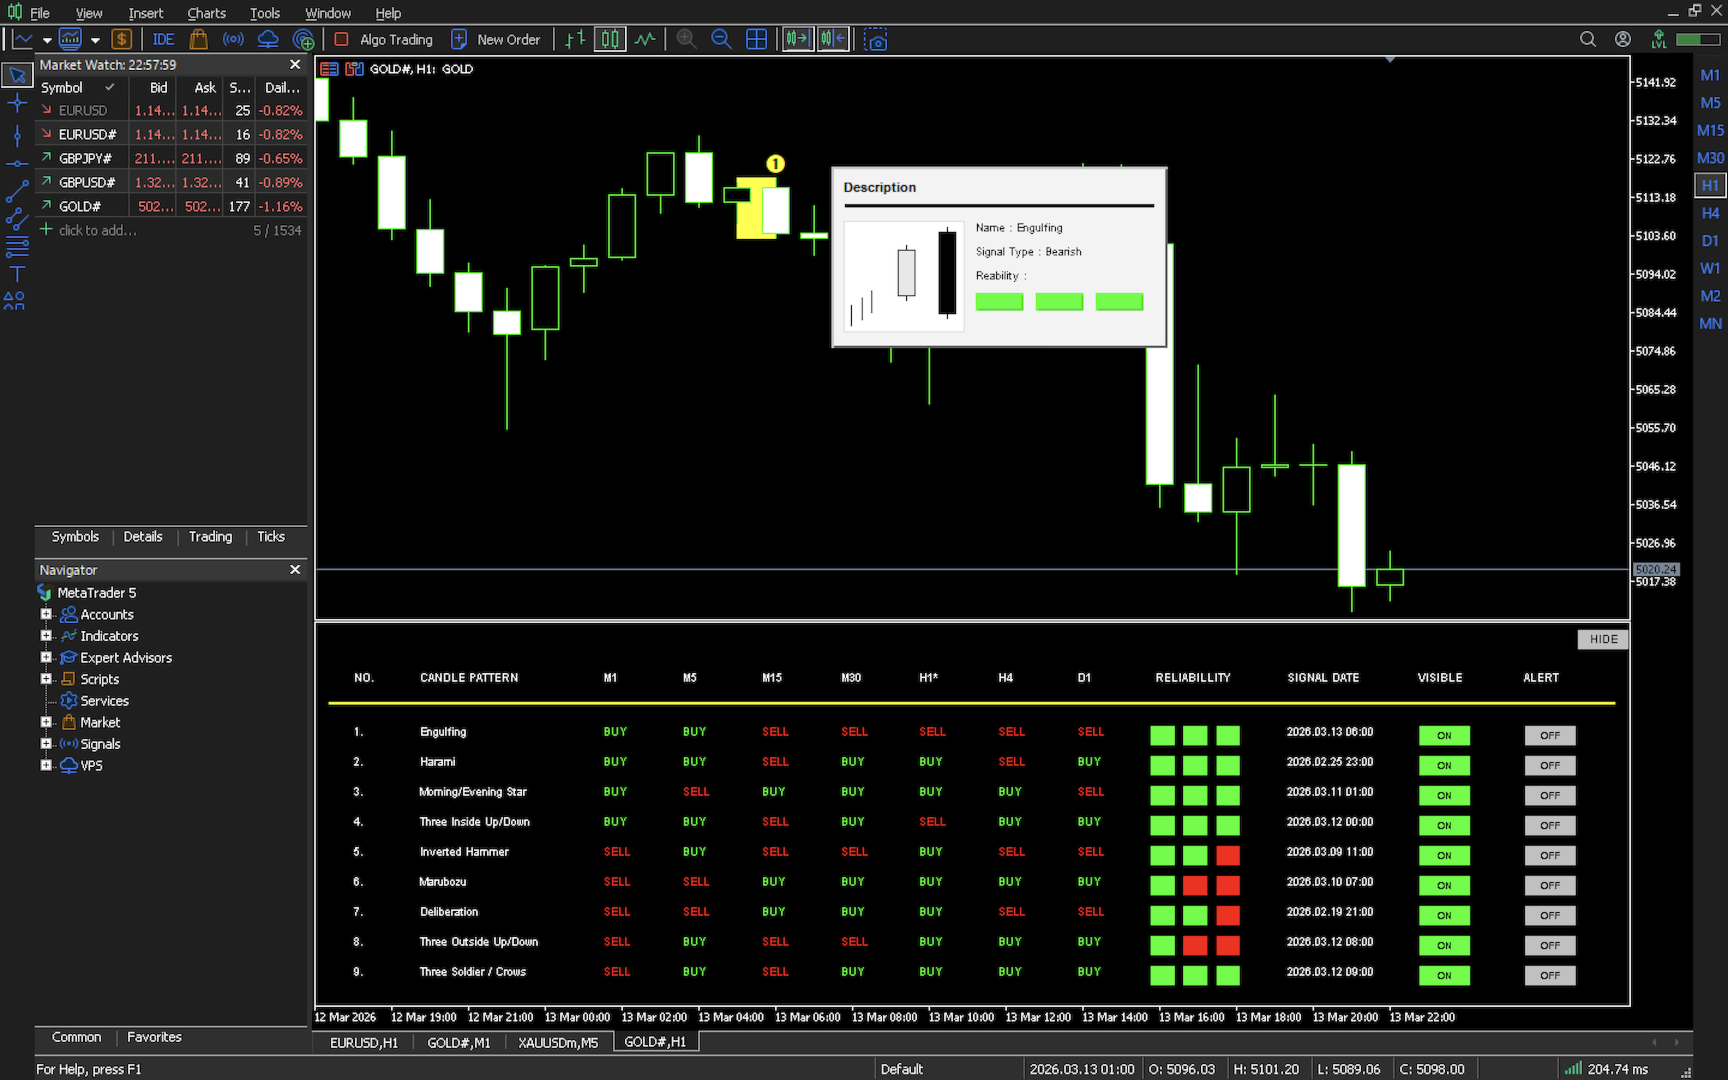
Description:
In the world of trading, candlestick patterns are a popular technical analysis tool used by many traders. There are numerous candlestick patterns, ranging from reversal patterns to continuation patterns. However, remembering all these patterns can be challenging, especially for novice traders. This often leads to traders having to manually memorize and identify candlestick patterns, which can be time-consuming and prone to errors.
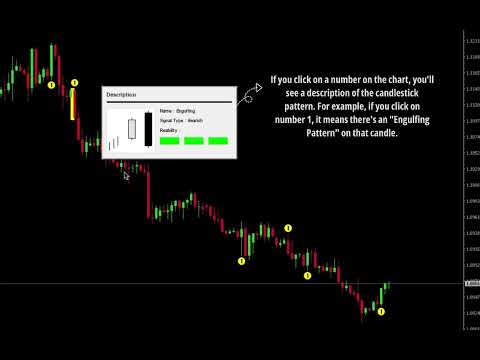
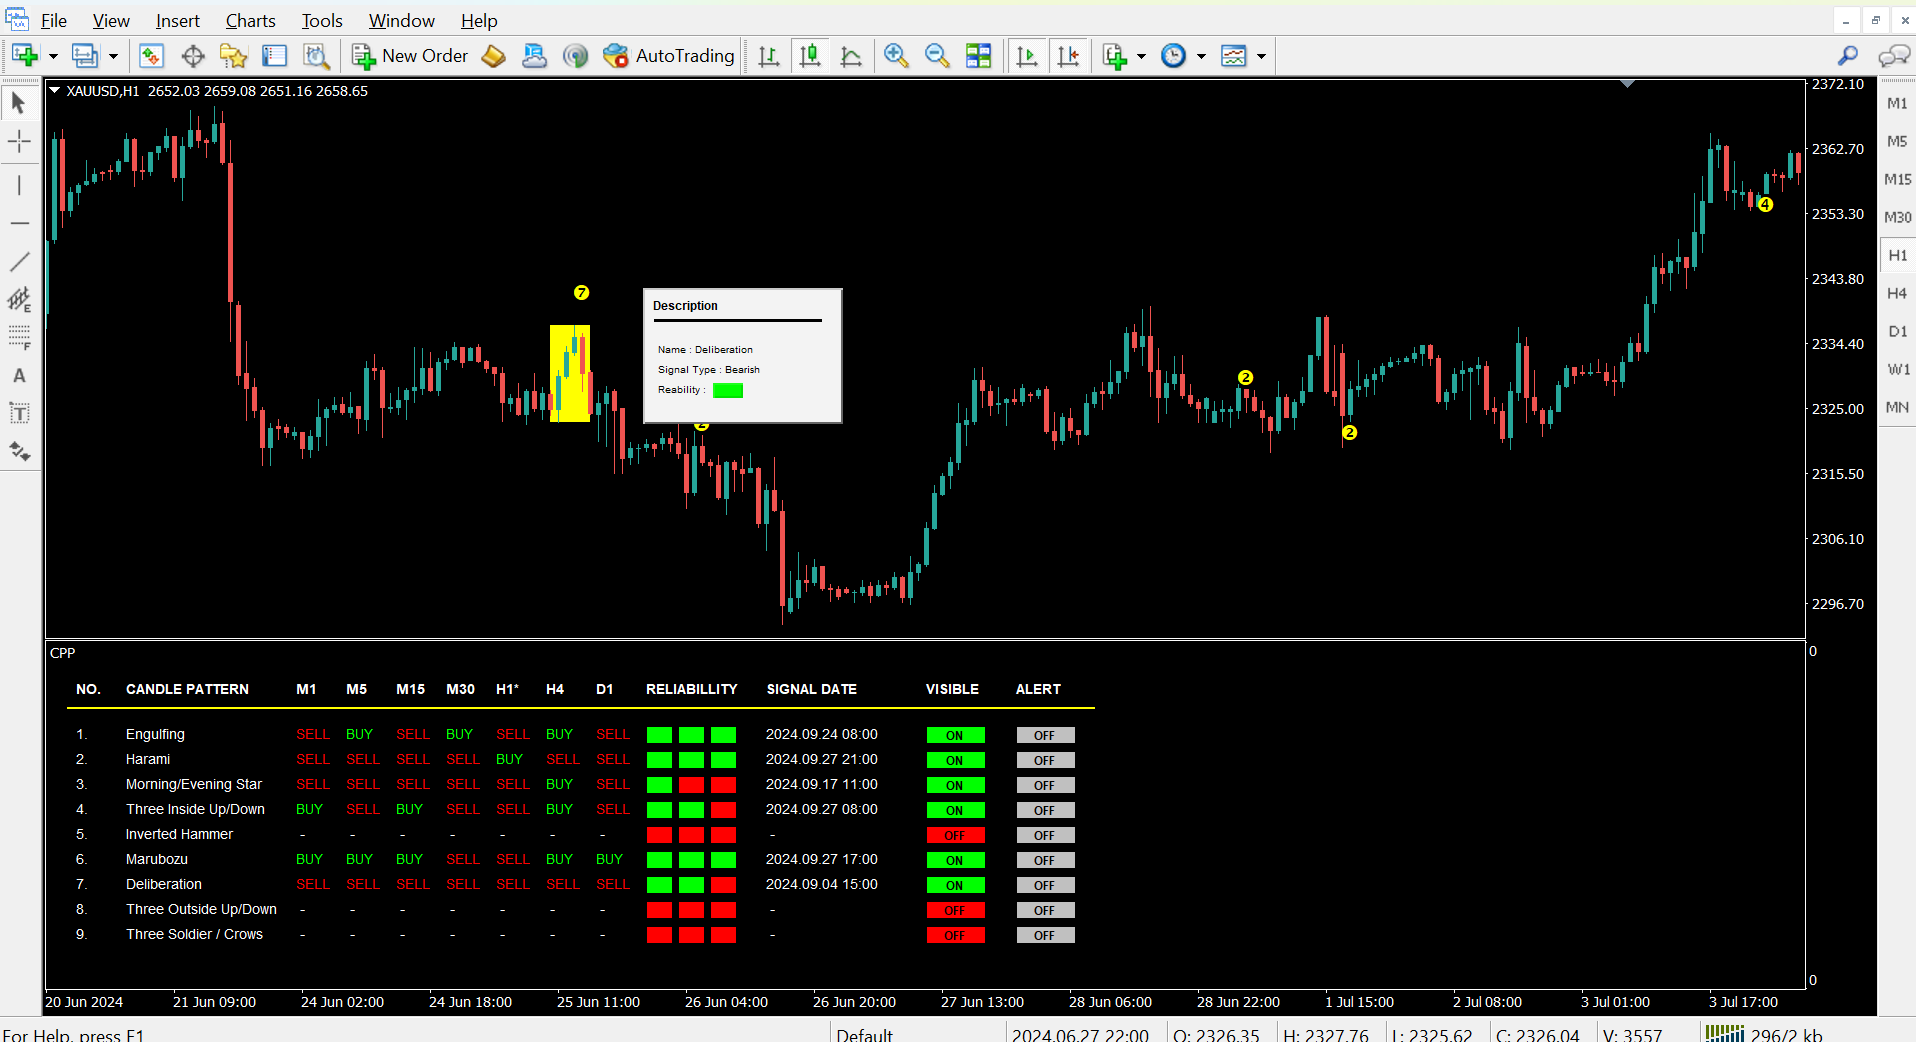
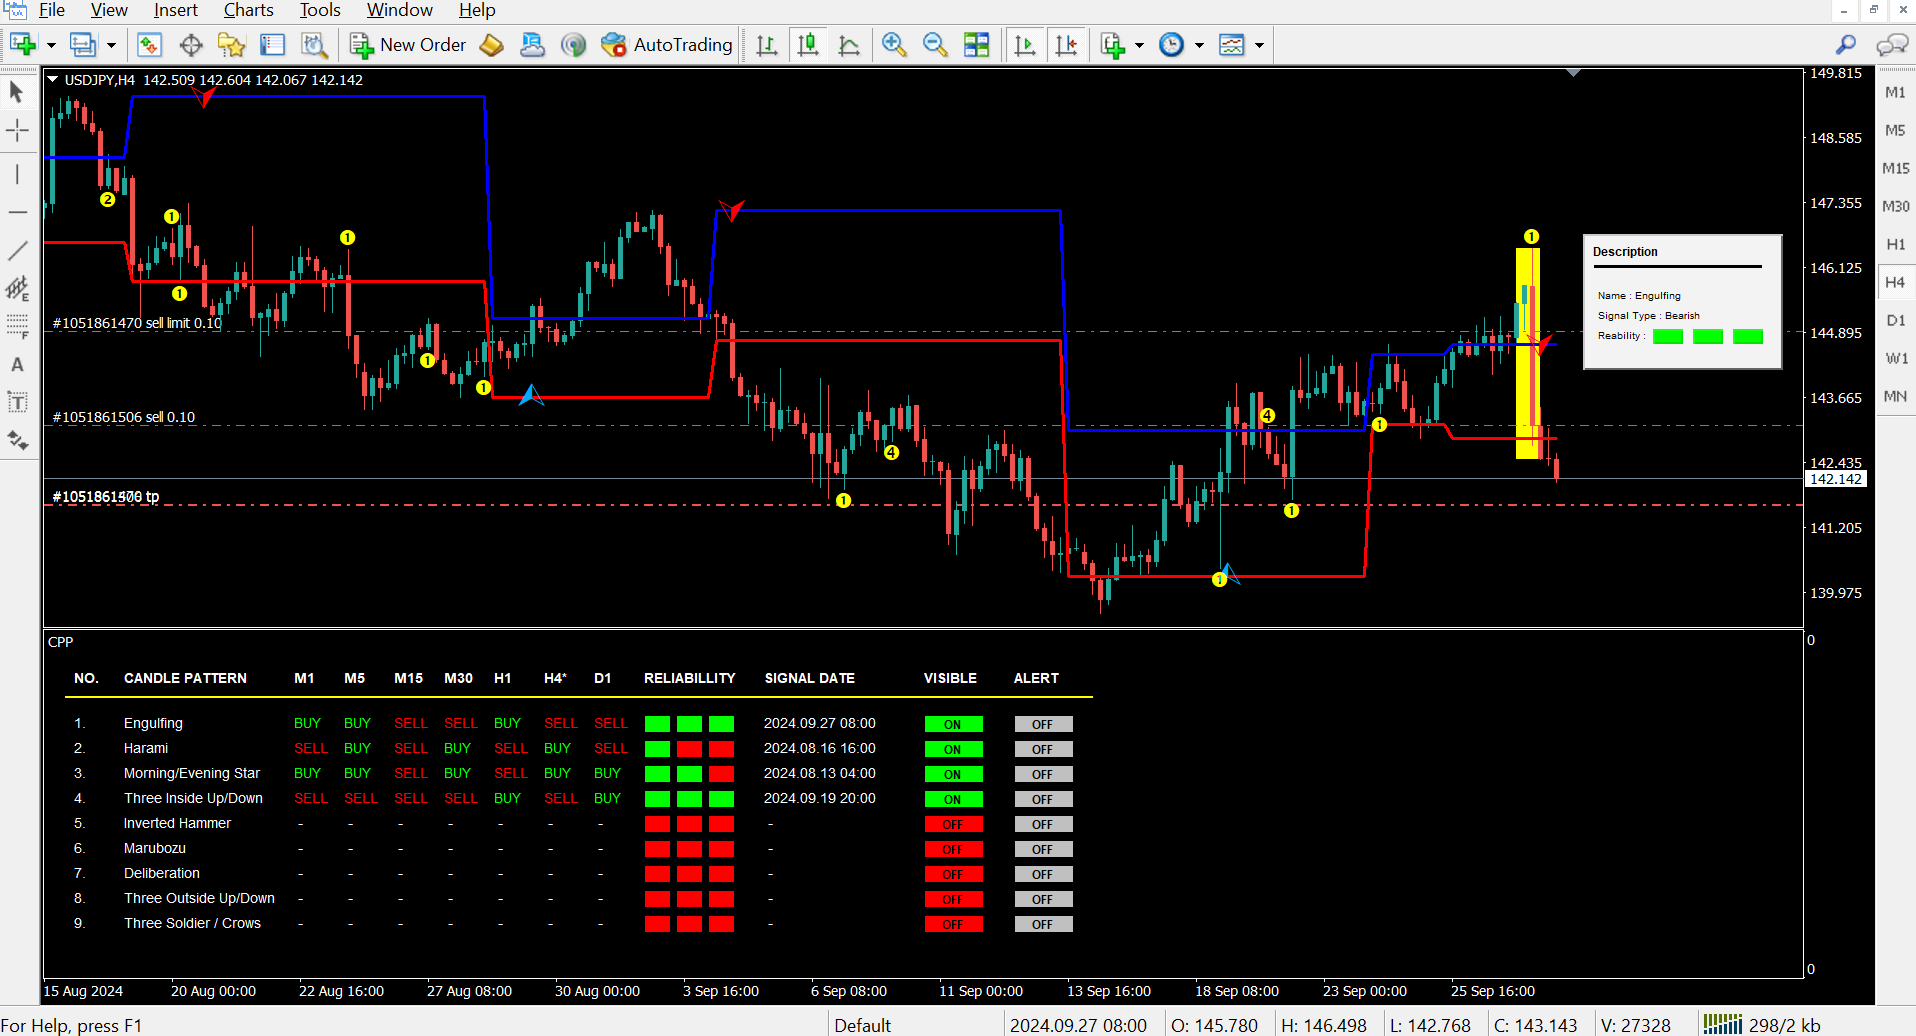
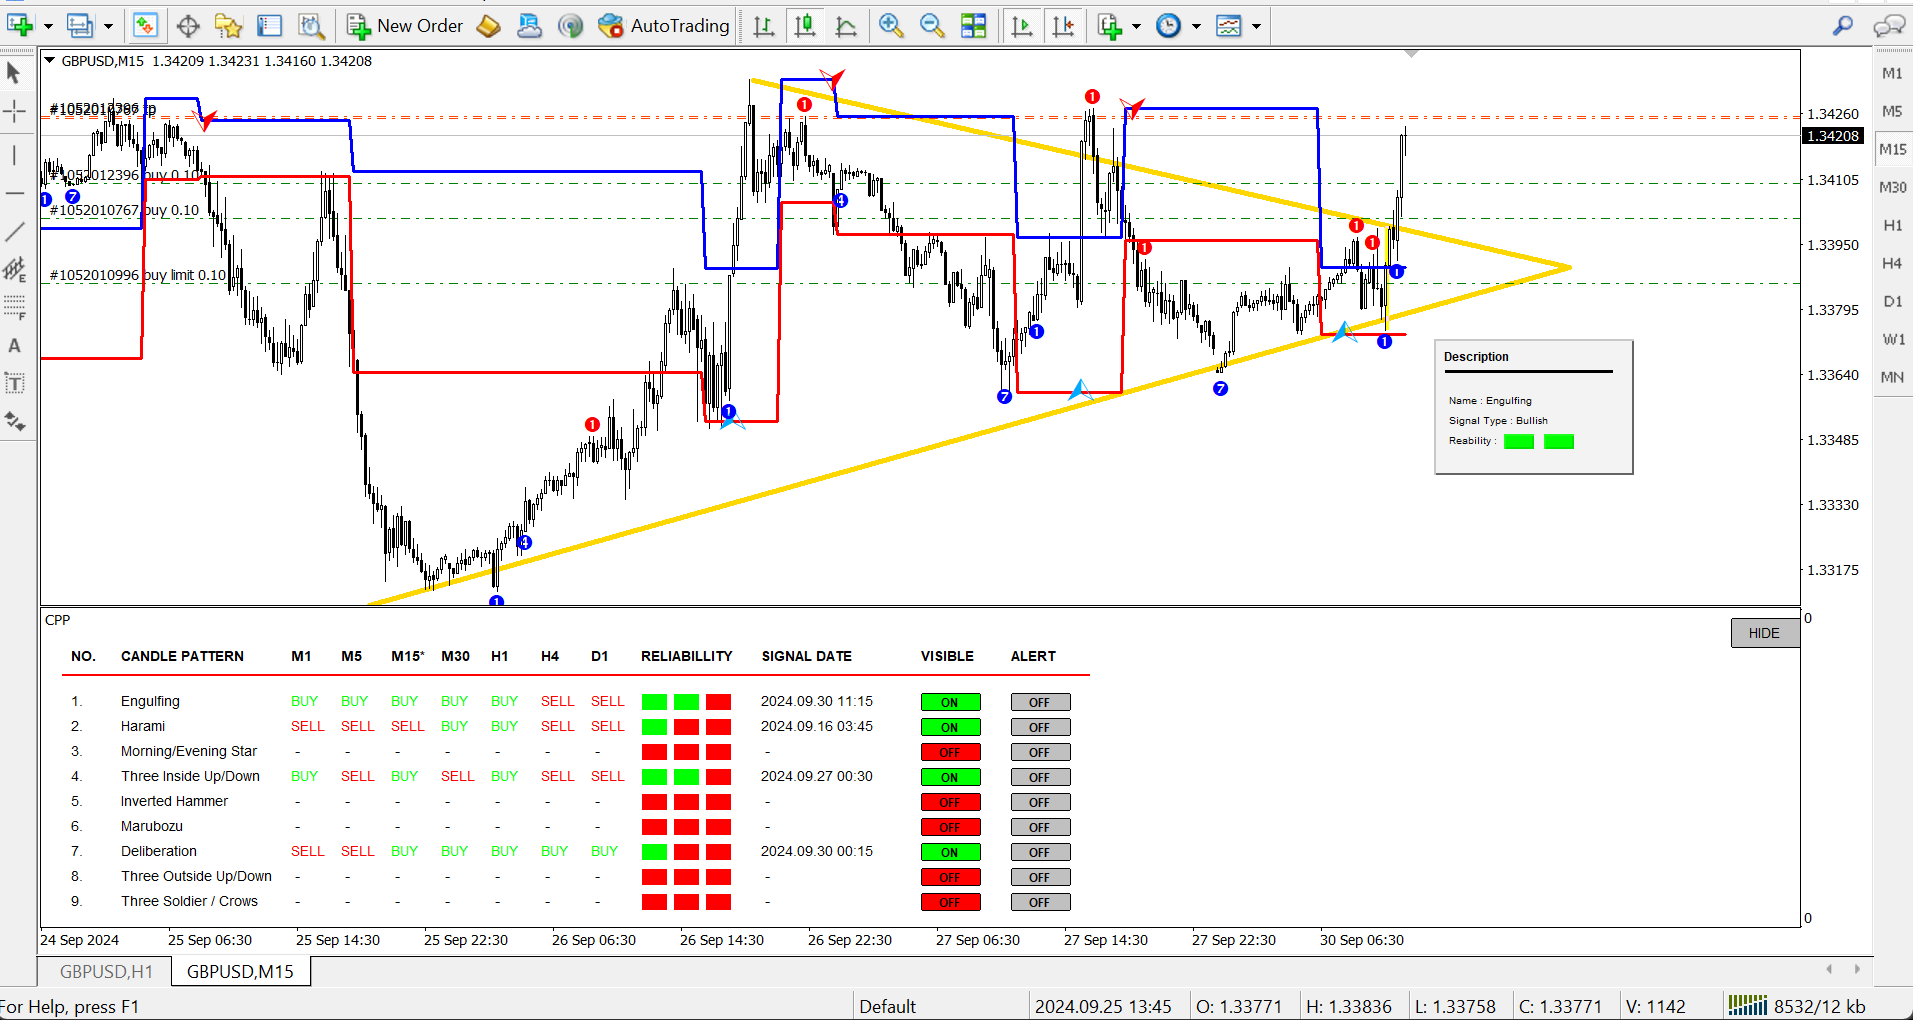
Candle Pattern Pro is a powerful indicator designed to detect candle patterns on your chart with precision and ease. It features an attractive and user-friendly interface, providing real-time notifications to keep you informed of key patterns as they form. Currently, it recognizes 9 candle patterns, with more to be added in future updates to enhance its capabilities. Whether you're a beginner or an experienced trader, Candle Pattern Pro is the perfect tool to help you spot trading opportunities based on reliable candle patterns.
Key Features:
- Detects 9 different candle patterns (with more coming soon)
- Clean and intuitive interface
- Real-time notifications for quick action
- Suitable for all types of traders
Benefits:
- Enhanced trading efficiency: Spend less time analyzing charts and more time executing trades.
- Increased accuracy: Reduce the risk of human error in pattern recognition.
- Better decision-making: Make more informed trading decisions based on reliable data.
- Continuous Improvement: Benefit from ongoing development as we regularly update the indicator with new patterns and enhancements, ensuring you always have access to the latest advancements in candlestick analysis.
Why Choose Candle Pattern Pro?
- Developed by Trading Experts: Our indicator is the product of years of experience and research in the field of technical analysis.
- User-Centric Design: We've designed the indicator with simplicity and ease of use in mind, making it accessible to traders of all levels.
- Affordable Excellence: Enjoy the power of advanced pattern recognition without breaking the bank.
Upgrade your trading strategy with Candle Pattern Pro!