Magic Balance

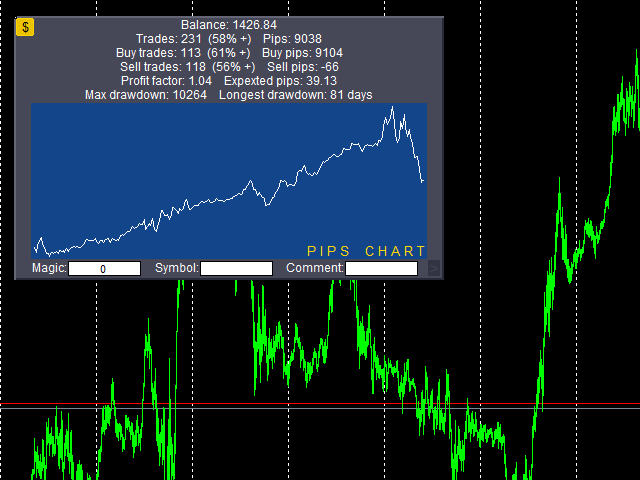
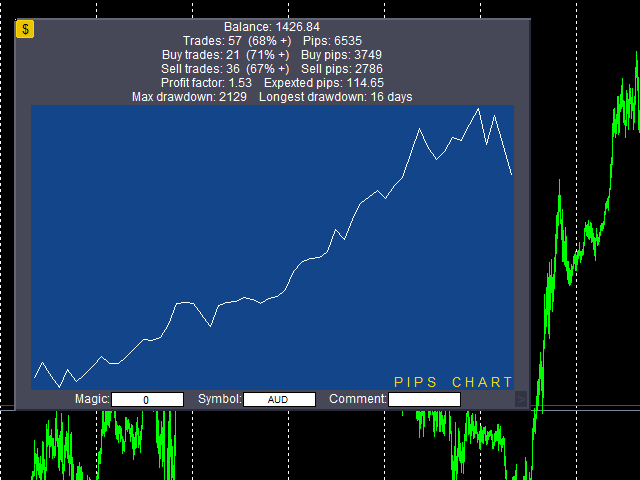
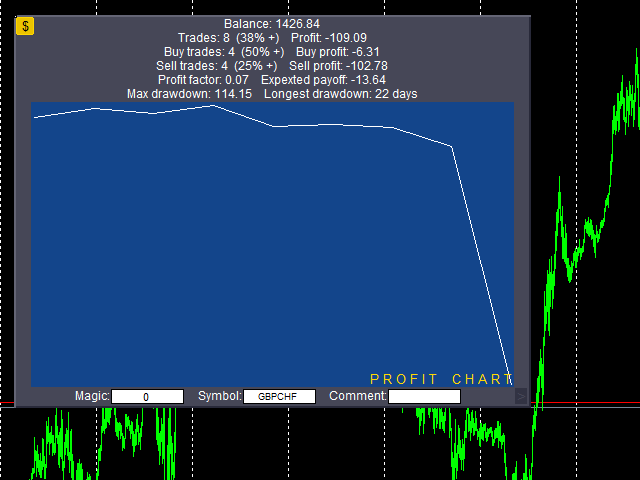
The indicator shows which trading pairs, strategies, robots and signals that you use are profitable and which are not.

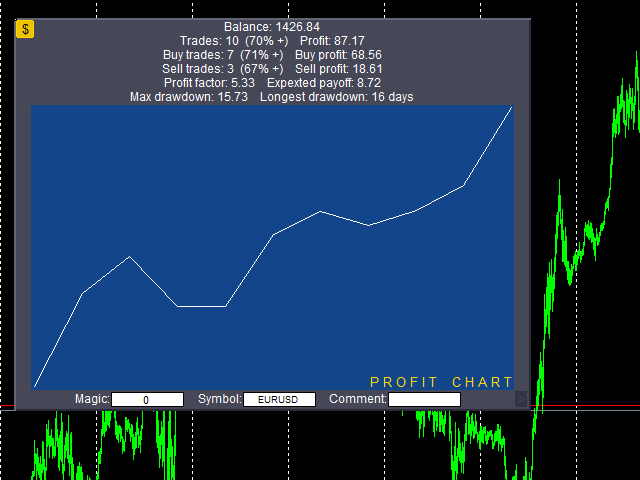
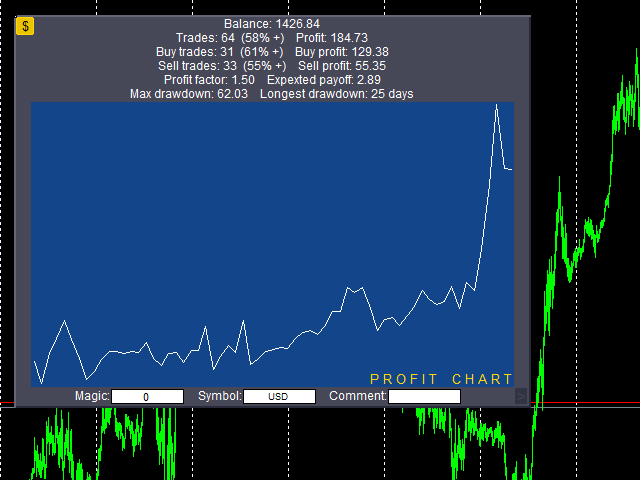
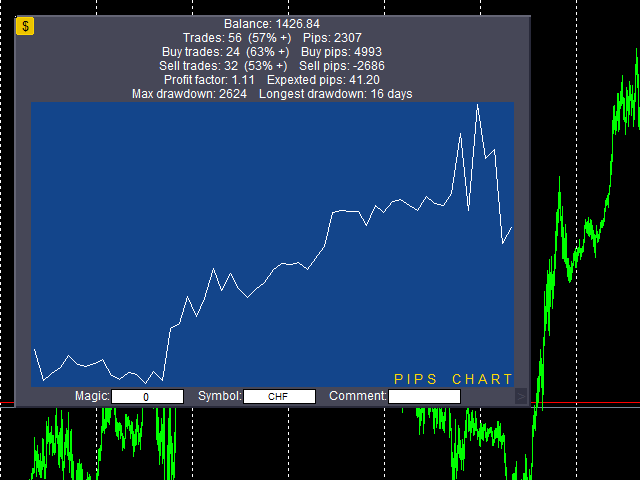
The statistic of trades and balance graph are displayed in the account currency and pips - to switch simply click on the graph.

  • button "$"(top left) - minimize/expand and move the indicator panel
  • button ">"(bottom right) - stretching and resetting to the original size


Statistic of trades

  • 1 line - account balance, current profit and lot of open trades;
  • 2 line - the number of all closed trades, the percentage of profitable trades and the total profit;
  • 3 line - the number of closed "BUY" trades, the percentage of profitable trades and the profit;
  • 4 line - the number of closed "SELL" trades, the percentage of profitable trades and the profit;
  • 5 line - the profit factor and expected payoff;
  • 6 line - the maximum balance drawdown and the maximum time to go out from drawdown in days


Filters of trades

  • Magic - enter a magic number or several through the space, for example "0" for manual trading
  • Symbol - enter trading pairs through the space or a part of the pairs name, for example "EURUSD GBPUSD" or "USD"
  • Comment - filter by a part of the comment, monitor trades received from signal providers
おすすめのプロダクト
The indicator shows the potential trend direction by cyclical-wave dependence. Thus, all the rays of the intersection will be optimal rays, in the direction of which the price is expected to move, taking into account the indicator period. Rays can be used as a direction for potential market movement. But we must not forget that the approach must be comprehensive, the indicator signals require additional information to enter the market.
Price Magnet — Price Density and Attraction Levels Indicator Price Magnet is a professional analytical tool designed to identify key support and resistance levels based on statistical Price Density. The indicator analyzes a specified historical period and detects price levels where the market spent the most time. These zones act as “magnets,” attracting price action or forming a structural base for potential reversals. Unlike traditional Volume Profile tools, Price Magnet focuses on price-time d
「Auto FIBO Pro」Crypto_Forex インジケーターは、取引の補助ツールとして最適です。 - インジケーターは、フィボナッチ レベルとローカル トレンド ライン (赤色) を自動的に計算してチャート上に配置します。 - フィボナッチ レベルは、価格が反転する可能性のある重要な領域を示します。 - 最も重要なレベルは、23.6%、38.2%、50%、61.8% です。 - リバーサル スキャルピングやゾーン グリッド取引に使用できます。 - Auto FIBO Pro インジケーターを使用して、現在のシステムを改善する機会も多数あります。 - Info Spread Swap Display があり、接続されている外国為替ペアの現在のスプレッドとスワップを表示します。 - ディスプレイには、アカウントの残高、エクイティ、マージンも表示されます。 - Info Spread Swap Display は、チャートのどのコーナーにも配置できます。 0 - 左上コーナー、1 - 右上、2 - 左下、3 - 右下。 高品質のトレーディングロボットとインジケーターをご覧にな
Trend PA
Mikhail Nazarenko
5 (3)
The Trend PA indicator uses   Price Action   and its own filtering algorithm to determine the trend. This approach helps to accurately determine entry points and the current trend on any timeframe. The indicator uses its own algorithm for analyzing price changes and Price Action. Which gives you the advantage of recognizing, without delay, a new nascent trend with fewer false positives. Trend filtering conditions can be selected in the settings individually for your trading style. The indicator
Scalper RS - ​​ は、価格チャート上で最も可能性の高い反転ポイントを識別するように設計された取引および分析インジケーターです。 価格構造化を実行するインジケーター アルゴリズムにより、さまざまな取引商品と時間枠での価格反転の組み合わせを決定できます。 可変パラメータ「 Structuring 」を使用すると、希望する取引チャートと時間枠に最適な設定を選択できます。 当初、このインジケーターは M1 - M5 - M15 の時間枠でシグナルを受信するために作成されましたが、必要なパラメータを選択することで、H1 - H4 - D1 の時間枠で長期トレンドを識別するように構成できます。 スキャルピングや短期取引に適しています。 信号矢印は、再描画なしでも、再描画ありでも動作できます (切り替え可能なパラメータ)。 すべてのシグナルはローソク足の終値に表示されます。 通知にはいくつかの種類があります。 インジケーターシグナルはトレンドの方向にも、それに逆らう方向にも使用できます。 このインジケーターは、独立したシステムとして使用することも、既存のトレンド取引システムへの追加
VR Cub
Vladimir Pastushak
VR Cub は、質の高いエントリーポイントを獲得するためのインジケーターです。このインジケーターは、数学的計算を容易にし、ポジションへのエントリーポイントの検索を簡素化するために開発されました。このインジケーターが作成されたトレーディング戦略は、長年にわたってその有効性が証明されてきました。取引戦略のシンプルさはその大きな利点であり、初心者のトレーダーでもうまく取引することができます。 VR Cub はポジション開始ポイントとテイクプロフィットとストップロスのターゲットレベルを計算し、効率と使いやすさを大幅に向上させます。取引の簡単なルールを理解するには、以下の戦略を使用した取引のスクリーンショットを見てください。 設定、設定ファイル、デモ版、説明書、問題解決方法は、以下から入手できます。 [ブログ] レビューを読んだり書いたりすることができます。 [リンク] のバージョン [MetaTrader 5] エントリーポイントの計算ルール ポジションをオープンする エントリーポイントを計算するには、VR Cub ツールを最後の高値から最後の安値までストレッチする必要があります。 最初
The indicator detects and displays М. Gartley's Butterfly pattern. The pattern is plotted by the extreme values of the ZigZag indicator (included in the resources, no need to install). After detecting the pattern, the indicator notifies of that by the pop-up window, a mobile notification and an email. The pattern and wave parameters are displayed on the screenshots. The default parameters are used for demonstration purposes only in order to increase the amount of detected patterns. Parameters z
Introducing Order Blocks Breaker , a brand-new way to identify and leverage order blocks in your trading strategy. After developing multiple order block tools with unique concepts, I’m proud to present this tool that takes things to the next level. Unlike previous tools, Order Blocks Breaker not only identifies order blocks but also highlights Breaker Order Blocks —key areas where the price is likely to retest after a breakout. MT5 -  https://www.mql5.com/en/market/product/124102/ This tool inco
The main idea of this indicator is rates analysis and prediction by Fourier transform. Indicator decomposes exchange rates into main harmonics and calculates their product in future. You may use the indicator as a standalone product, but for better prediction accuracy there is another related indicator - FreqoMaster - which uses FreqoMeterForecast as a backend engine and combines several instances of FreqoMeterForecast for different frequency bands. Parameters: iPeriod - number of bars in the ma
The   Trendlines Oscillator   helps traders identify trends and momentum based on the normalized distances between the current price and the most recently detected bullish and bearish trend lines. The indicator features bullish and bearish momentum, a signal line with crossings, and multiple smoothing options. USAGE The   Trendlines Oscillator   works by systematically: Identifying pivot highs and lows. Connecting pivots to form bullish (support) and bearish (resistance) trendlines. Measuring
Noize Absorption Index - is the manual trading system that measures the difference of pressure between bears forces and bulls forces. Green line - is a noize free index that showing curent situation. Zero value of index shows totally choppy/flat market.Values above zero level shows how powerfull bullish wave is and values below zero measures bearish forces.Up arrow appears on bearish market when it's ready to reverse, dn arrow appears on weak bullish market, as a result of reverse expectation. S
標準パラメーターを使用したMACDインジケーター波に基づく 最後と最後の2つのMACDウェーブで、それぞれ正と負のフィボナッチレベルを扱います。 現時点でMACDインジケーターで負の波が終了している場合、色は緑です。 現時点でMACDインジケーターの正の波が終了している場合、色は赤です。 Waveの終了基準は、MACDの符号が異なる2ティックです。 最後の4つのMACDウェーブのトレンドラインをプロットします。 専門家とうまく働く  その他のスクリーンショット: Figures MACD   https://www.mql5.com/ru/market/product/42031 https://www.mql5.com/en/charts/10581596/audusd-h1-alpari-international https://www.mql5.com/en/charts/10631979/usdjpy-m1-alpari-international https://www.mql5.com/en/charts/10628704/gbpusd-m15-alpa
LordChannel is an indicator for META TRADER 4 for all forex pairs and financial market metals. The indicator is used to make detections of high/low channels, implementing a technical analysis on possible breakouts and making correct order entries. LordChannel sends signals such as buy and sell in the graphical analysis, it is important to emphasize that the importance of these signals are safe in TIME FRAMES M30, H1, H4. The indicator was created for using bullish/downtrend channels to compl
Owl smart levels
Sergey Ermolov
4.26 (38)
MT5版  |   FAQ Owl Smart Levels Indicator   は、 Bill Williams   の高度なフラクタル、市場の正しい波構造を構築する Valable ZigZag、エントリの正確なレベルをマークする Fibonacci レベルなどの一般的な市場分析ツールを含む 1 つのインジケーター内の完全な取引システムです。 利益を得るために市場と場所に。 戦略の詳細な説明 インジケータを操作するための指示 顧問-取引助手 プライベートユーザーチャット ->購入後に私に書いて、私はプライベートチャットにあなたを追加し、あなたはそこにすべてのボーナスをダウンロードすることができます 力はシンプルさにあります! Owl Smart Levels   取引システムは非常に使いやすいので、専門家にも、市場を勉強し始めて自分で取引戦略を選択し始めたばかりの人にも適しています。 戦略と指標に秘密の数式や計算方法が隠されているわけではなく、すべての戦略指標は公開されています。 Owl Smart Levels を使用すると、取引を開始するためのシグナルをすばやく確認し、注
インディケータは現在のクオートを作成し、これを過去のものと比較して、これに基づいて価格変動予測を行います。インジケータには、目的の日付にすばやく移動するためのテキスト フィールドがあります。 オプション: シンボル - インジケーターが表示するシンボルの選択; SymbolPeriod - 指標がデータを取る期間の選択; IndicatorColor - インジケータの色; HorisontalShift - 指定されたバー数だけインディケータによって描画されたクオートのシフト; Inverse - true は引用符を逆にします。false - 元のビュー。 ChartVerticalShiftStep - チャートを垂直方向にシフトします (キーボードの上下矢印)。 次は日付を入力できるテキストフィールドの設定で、「Enter」を押すとすぐにジャンプできます。
The indicator detects and displays Shark harmonic pattern (see the screenshot). The pattern is plotted by the extreme values of the ZigZag indicator (included in the resources, no need to install). After detecting the pattern, the indicator notifies of that by a pop-up window, a mobile notification and an email. The indicator highlights the process of the pattern formation and not just the complete pattern. In the former case, it is displayed in the contour triangles. After the pattern is comple
"The trend is your friend" is one of the best known sayings in investing, because capturing large trendy price movements can be extremely profitable. However, trading with the trend is often easier said than done, because many indicators are based on price reversals not trends. These aren't very effective at identifying trendy periods, or predicting whether trends will continue. We developed the Trendiness Index to help address this problem by indicating the strength and direction of price trend
The indicator displays the data of the Stochastic oscillator from a higher timeframe on the chart. The main and signal lines are displayed in a separate window. The stepped response is not smoothed. The indicator is useful for practicing "manual" forex trading strategies, which use the data from several screens with different timeframes of a single symbol. The indicator uses the settings that are identical to the standard ones, and a drop-down list for selecting the timeframe. Indicator Paramet
Introduction It is common practice for professional trades to hide their stop loss / take profit from their brokers. Either from keeping their strategy to the themselves or from the fear that their broker works against them. Using this indicator, the stop loss / take profit points will be drawn on the product chart using the bid price. So, you can see exactly when the price is hit and close it manually.  Usage Once attached to the chart, the indicator scans the open orders to attach lines for t
Alpha Trend signは私たちの取引システムを検証し、取引信号を明確に提示し、信号がドリフトすることはありません。 主な機能: •市場が活況を示している地域に応じて、指標に基づいて現在の相場がトレンド相場に属しているか、それとも揺れ相場に属しているかを直感的に判断することができる。 そして、指標の指示矢印に基づいて市場に切り込み、緑の矢印は購入を提示し、赤の矢印は販売を提示する。 •小周期変動による頻繁な取引信号の発生を回避するために、5分以上の時間周期で取引を行うことを推奨します。 •最適な取引タイミングを逃さないために、シグナルプロンプトをオンにすることもできます。 •本指標はトレンド相場をよく予測するだけでなく、幅広振動相場でも利益を得ることができる。 •本指標は大道至簡の原則に基づいており、異なる段階のトレーダーが使用するのに適している。 注意事項: •Alpha Trend signには明確な入退場信号があり、損失を与えないように逆位相操作を提案しない。 •Alpha Trend signは特に成熟した指標であり、デルのチー
VSA - P (Volume Spread Analysis) Period-Based Histogram is a tool that visually represents market volume dynamics using Volume Spread Analysis principles, with a focus on highlighting key volume changes over specific time periods. The histogram captures changes in volume and price spread relationships in real-time, enabling traders to detect early signals of accumulation, distribution, and shifts in buying or selling pressure. Indicator is non repainting and working with real-time on tick data.
Power Renko is an indicator which plots Renko bricks underneath the chart using a histogram. You can select the brick size and the timeframe of the Renko bricks as well as whether or not to use the close price or the high/low price of the candles. Renko bricks are based on price alone, not time, therefor the Renko bricks will not be aligned with the chart's time. They are extremely useful for trend trading and many different strategies can be formed from them. Buffers are provided allowing you t
インジケーターは、古典的なガンの角度と同様に、(特定のキャンドルをクリックした後)トレンドラインのファンを構築します。インジケーターの特徴は、固定スケールで角度を作成するだけでなく、特定の数のバーの平均価格を使用することです(オプション)。 インジケーターの角度の平均価格を計算する方法は2つあります(オプション)。 1)高値から安値への(特定の数のバーの)平均価格の動きの計算。 2)平均価格の計算はオープンからクローズに移動します。 オプション: 1.Method -コーナーを構築する方法。 2. FixedScale-固定スケール(メソッドでFixed_Scaleが選択されている場合)。 3.SecondaryAngles-二次角度を描画するための許可を制御します。 4.RayRight-トレンドラインの光線を設定します。 5.DrawBackground-背景として線を描画します。 6.AnglesQuantity-角度の数。 7. Bars_To_Process-期間、バーの数、これに基づいて平均価格が決定され、角度の「速度」。ゼロ以下の場合、すべての履歴
Max LotSize
Luis Alberto Atuncar Sanchez
5 (2)
LotSize Indicator Discover the appropriate lot size to use in your trades based on the available margin. This indicator provides valuable information for risk management. If the indicator shows a value of 0, it means that your balance or available margin is insufficient for trading. It is important to maintain adequate margin levels for safe trading practices. This indicator is exclusively designed for the MT4 platform, a popular and reliable trading platform in the market. With the LotSize Indi
FREE
The Divergent Accuracy indicator is designed to identify discrepancies on the price chart of a currency pair. The Divergent Accuracy indicator recognizes bullish and bearish divergences, and can also output a signal that a divergence has been detected... In addition to identifying divergences, the indicator works with overbought and oversold levels, and also shows arrows to enter the market...
Rainbow Price Visualizer v1.21 See where the market really breathes. Turns your MT4 chart into an ultra-precise heatmap that highlights price zones favored by big players. Why it matters 300 price levels at 0.2‑pip resolution — microscopic detail. 8 visual themes (Rainbow, Fire, Ocean…) for instant readibility. Smart opacity: low noise fades, real zones pop. Lightweight rendering with automatic cleanup. Fully customizable: saturation, opacity, resolution, history depth. Bands project into the f
VR Grid
Vladimir Pastushak
5 (3)
VR グリッド インジケーターは、ユーザー定義の設定を使用してグラフィカル グリッドを作成するように 設計 されています。 標準グリッド とは異なり、VR グリッドは 円形レベル を構築するために使用されます。ユーザーの選択に応じて、ラウンド レベル間のステップは任意に設定できます。さらに、他のインジケーターやユーティリティとは異なり、VR Grid は期間が変更されたり、端末が再起動されたりした場合でも、 グリッドの位置を維持 します。 設定、設定ファイル、デモ版、説明書、問題解決方法は、以下から入手できます。 [ブログ] レビューを読んだり書いたりすることができます。 [リンク] のバージョン [MetaTrader 5] 垂直レベル は実際の時間間隔に基づいており、 欠落している または存在しない期間は無視します。したがって、レベル間のステップは、ユーザーが選択した値に厳密に対応します。 VR グリッド インジケーターを使用すると、トレーダーは任意のレベルで 垂直線と水平線のスタイル 、色、太さを変更できます。これにより、金融商品の ラウンドレベル を制御できます。 ラウンド
FREE
Axiom Point — Precision Structural Breakout Indicator Axiom Point is a high-performance analytical indicator designed to identify high-probability reversal zones using price-action behaviour and adaptive balance filtering. The indicator applies a multi-layer analytical model to detect moments when price transitions beyond its normal equilibrium area, indicating a potential shift in market momentum. Unlike conventional trend-following tools, Axiom Point focuses on so-called points of no return —
Crypto_Forex インジケーター HTF Ichimoku for MT4。 - Ichimoku インジケーターは、最も強力なトレンド インジケーターの 1 つです。HTF は、Higher Time Frame を意味します。 - このインジケーターは、トレンド トレーダーや、プライス アクション エントリとの組み合わせに最適です。 - HTF Ichimoku インジケーターを使用すると、より高い時間枠の Ichimoku を現在のチャートに添付できます。 - 上昇トレンド - 赤い線が青い線より上 (両方の線が雲より上) / 下降トレンド - 赤い線が青い線より下 (両方の線が雲より下)。 - 価格が Ichimoku 雲の上部境界を突破した場合にのみ、買い注文を開きます。 - 価格が Ichimoku 雲の下部境界を突破した場合にのみ、売り注文を開きます。 - HTF Ichimoku インジケーターを使用すると、大きなトレンドを捉える機会が得られます。 高品質のトレーディングロボットとインジケーターをご覧になるにはここをクリックしてください! これは、この M
Easy Trade Indicator – Your Path to Profitable Trades! Work any Time Frame! Maximize your profits with precise and assertive trades! ️ Trade with comfort – the indicator does the analysis and you only open the order in the direction in which the indicator shows you!  Exclusive panel with past trade counter and accuracy tracking! Simplify your analysis, boost your performance, and trade with confidence! Get it now and take your trading to the next level
このプロダクトを購入した人は以下も購入しています
Gann Made Easy は、ミスター・ギャンの理論を使用した取引の最良の原則に基づいた、プロフェッショナルで使いやすい外国為替取引システムです。 W・D・ガン。このインジケーターは、ストップロスとテイクプロフィットレベルを含む正確な買いと売りのシグナルを提供します。 PUSH通知を利用して外出先でも取引可能です。 購入後に私に連絡して、取引のヒント、ボーナス、および「GANN MADE EASY」EA アシスタントを無料で入手してください。 おそらく、ギャンの取引手法についてはすでに何度も聞いたことがあるでしょう。通常、ギャンの理論は初心者のトレーダーだけでなく、すでにある程度の取引経験がある人にとっても非常に複雑なものです。なぜなら、ギャンの取引手法は理論的にはそれほど簡単に適用できるものではないからです。私はその知識を磨き、最良の原則を私の外国為替インジケーターに組み込むために数年を費やしました。 このインジケーターは非常に簡単に適用できます。必要なのは、それをチャートに添付し、簡単な取引推奨事項に従うだけです。このインジケーターは常に市場分析の仕事を行い、取引の機会を探しま
An exclusive indicator that utilizes an innovative algorithm to swiftly and accurately determine the market trend. The indicator automatically calculates opening, closing, and profit levels, providing detailed trading statistics. With these features, you can choose the most appropriate trading instrument for the current market conditions. Additionally, you can easily integrate your own arrow indicators into Scalper Inside Pro to quickly evaluate their statistics and profitability. Scalper Inside
Game Changerは、あらゆる金融商品で使用できる革新的なトレンドインジケーターです。MetaTraderを強力なトレンドアナライザーへと変貌させます。あらゆる時間枠で動作し、トレンドの特定、反転の可能性のシグナル、トレーリングストップ機能、そして迅速な市場反応のためのリアルタイムアラートを提供します。経験豊富なプロでも、優位性を求める初心者でも、このツールは自信と規律、そして根本的なトレンドダイナミクスを明確に理解した上で取引を行うための力となります。このインジケーターはリドロー機能も備えています。 購入後すぐにご連絡いただければ、個人ボーナスを進呈いたします。Strong SupportとTrend Scannerインジケーターの無料コピーを入手できます。[email protected]までプライベートメッセージを送ってください。 私のEAや特別なセットはTelegramでは販売しておりません。MQL5でのみ販売しており、セットファイルは私のブログでのみ公開しています。詐欺師にはご注意ください。他の方からセットを購入しないでください。 設定 トレンド変化時のアラート
Miraculous Indicator – ガン・スクエア・オブ・ナインに基づく100%非リペイントのFXおよびバイナリーツール この動画では、FXおよびバイナリーオプションのトレーダー向けに特別に開発された、非常に正確で強力な取引ツールである Miraculous Indicator を紹介しています。このインジケーターがユニークなのは、伝説的な ガン・スクエア・オブ・ナイン と ガンの振動の法則 に基づいている点で、現代の取引で利用できる最も正確な予測ツールの一つとなっています。 Miraculous Indicatorは 完全に非リペイント であり、ローソク足が確定した後にシグナルが変化したり消えたりすることはありません。つまり、見たものがそのまま利用できます。これにより、トレーダーは自信を持ってエントリーおよびエグジットを行うための信頼性と一貫性のある根拠を得ることができます。 主な特徴: ガン・スクエア・オブ・ナインとガン理論に基づいて構築 100%非リペイントのシグナルシステム すべての時間枠(M1、M5、H1、H4、日足、週足)で機能 FXおよびバイナリーオプション取引
このインジケーターは、反転ポイントと価格戻りゾーンを正確に表示します。     主要プレーヤー 。新たなトレンドが形成される場所を把握し、最大限の精度で意思決定を行い、すべての取引をコントロールします。 TREND LINES PRO インジケーターと組み合わせることで、その潜在能力を最大限に発揮します。 VERSION MT5 インジケーターが示す内容: 新しいトレンドの始まりに活性化する反転構造と反転レベル。 リスクと報酬の比率を最小限に抑えた利益 確定 と 損失停止の レベルの表示     RR 1:2   。 インテリジェントな削減ロジックによるストップロス。 指定されたインジケーターから 2 つのトレンド タイプの反転パターンを表示します。 指標: トレンドを追う   TREND LINES PRO   (世界的なトレンドの変化) TREND PRO   (クイックトレンド変更) シンプルで効果的   スキャナー   リアルタイムトレンド(新機能)。 マルチタイムフレームのインストゥルメント フィルタリング。 画面   利益     LOGIC AI信号の後。 当日プラス方
M1 SNIPER は使いやすいトレーディングインジケーターシステムです。M1時間足向けに設計された矢印インジケーターです。M1時間足でのスキャルピングのためのスタンドアロンシステムとして、また既存のトレーディングシステムの一部としても使用できます。このトレーディングシステムはM1時間足での取引に特化して設計されていますが、他の時間足でも使用できます。元々、この手法はXAUUSDとBTCUSDの取引用に設計しましたが、他の市場においても役立つと考えています。 インジケーターのシグナルは、トレンドの方向と逆方向に取引できます。インジケーターのシグナルを利用して両方向に取引するのに役立つ特別な取引テクニックをご紹介します。この手法は、特別な動的なサポートとレジスタンスの価格帯を利用することに基づいています。 ご購入後、M1 SNIPER矢印インジケーターをすぐにダウンロードできます。さらに、M1 SNIPERツールのすべてのユーザーに、以下のスクリーンショットに表示されているApollo Dynamic SRインジケーターを無料で提供しています。この2つのインジケーターを組み合わせることで
Dynamic Forex28 Navigator - 次世代の Forex 取引ツール。 現在 49% オフ。 Dynamic Forex28 Navigator は、長年人気のインジケーターを進化させたもので、3 つの機能を 1 つにまとめています。 Advanced Currency Strength28 インジケーター (レビュー 695 件)  + Advanced Currency IMPULSE with ALERT (レビュー 520 件) + CS28 コンボ シグナル (ボーナス)。 インジケーターの詳細 https://www.mql5.com/en/blogs/post/758844 次世代の Strength インジケーターが提供するもの  オリジナルで気に入っていたすべての機能が、新機能と精度の向上によって強化されました。 主な機能: 独自の通貨強度計算式。 すべての時間枠でスムーズかつ正確な強度ライン。 トレンドの特定と正確なエントリーに最適です。 ダイナミックマーケットフィボナッチレベル (マーケットフィボナッチ)。 このインジケーターに固有
Precautions for subscribing to indicator This indicator only supports the computer version of MT4 Does not support MT5, mobile phones, tablets The indicator only shows the day's entry arrow The previous history arrow will not be displayed (Live broadcast is for demonstration) The indicator is a trading aid Is not a EA automatic trading No copy trading function The indicator only indicates the entry position No exit (target profit)  The entry stop loss point is set at 30-50 PIPS Or the front hi
通貨強さウィザードは、取引を成功させるためのオールインワン ソリューションを提供する非常に強力な指標です。このインジケーターは、複数の時間枠のすべての通貨のデータを使用して、このまたはその外国為替ペアのパワーを計算します。このデータは、使いやすい通貨インデックスと通貨パワーラインの形式で表され、特定の通貨のパワーを確認するために使用できます。 必要なのは、取引したいチャートにインジケーターを接続することだけです。インジケーターは、取引する通貨の実際の強さを示します。このインジケーターは、トレンドに合わせて取引するときに有利に利用できる売買高の圧力の極値も示します。このインジケーターには、フィボナッチに基づく可能なターゲットも表示されます。 このインジケーターは、PUSH 通知を含むあらゆるタイプのアラートを提供します。 購入後ご連絡下さい。私の取引のヒントをあなたと共有し、素晴らしいボーナスインジケーターを無料で提供します! 幸せで有益な取引をお祈りします。
GOLD Impulse with Alert
Bernhard Schweigert
4.64 (11)
このインディケータは、当社の2つの製品 Advanced Currency IMPULSE with ALERT  +   Currency Strength Exotics . のスーパーコンビネーションです。 このインジケーターは全ての時間枠で作動し、8つの主要通貨と1つのシンボルの強弱のインパルスをグラフで表示します。 このインジケータは、金、エキゾチックペア、商品、インデックス、先物など、あらゆるシンボルの通貨強度の加速度を表示することに特化されています。金、銀、原油、DAX、US30、MXN、TRY、CNHなどの通貨強度の加速度(インパルスまたは速度)を表示するために、任意のシンボルを9行目に追加できる、この種の最初のものです。 新しいアルゴリズムに基づいて構築され、潜在的な取引の特定と確認がさらに容易になりました。これは、通貨の強さや弱さが加速しているかどうかをグラフィカルに表示し、その加速の速度を測定するためです。加速すると物事は明らかに速く進みますが、これはFX市場でも同じです。つまり、反対方向に加速している通貨をペアリングすれば、潜在的に利益を生む取引を特定
トレンドラインプロ   市場の真の方向転換点を理解するのに役立ちます。この指標は、真のトレンド反転と主要プレーヤーが再び参入するポイントを示します。 分かりますか     BOSライン   複雑な設定や不要なノイズなしに、より長い時間足でのトレンドの変化と重要なレベルを把握できます。シグナルは再描画されず、バーが閉じた後もチャート上に残ります。 VERSION MT 5     -     RFI LEVELS PRO インジケーター と組み合わせることで、その潜在能力を最大限に発揮します。 インジケーターが示す内容: 本当の変化   トレンド(BOSライン) 一度シグナルが現れたら、それは有効です!これは、リペイント機能を持つインジケーターとの重要な違いです。リペイント機能を持つインジケーターは、シグナルを発した後、それを変更し、資金の損失につながる可能性があります。これにより、より高い確率と精度で市場に参入できます。また、矢印が現れた後、目標値(利益確定)に達するか、反転シグナルが現れるまで、ローソク足の色を変更する機能もあります。 繰り返しエントリ       主要プレーヤーの
Volatility Trend System - a trading system that gives signals for entries. The volatility system gives linear and point signals in the direction of the trend, as well as signals to exit it, without redrawing and delays. The trend indicator monitors the direction of the medium-term trend, shows the direction and its change. The signal indicator is based on changes in volatility and shows market entries. The indicator is equipped with several types of alerts. Can be applied to various trading ins
Advanced Supply Demand
Bernhard Schweigert
4.91 (299)
現在40%オフ 初心者にもエキスパートトレーダーにも最適なソリューション このインジケーターは独自の機能と新しい公式を多数内蔵しており、ユニークで高品質かつ手頃な取引ツールです。このアップデートでは、2つの時間枠ゾーンを表示できるようになります。より長いTFだけでなく、チャートTFとより長いTF(ネストゾーンを表示)の両方を表示できます。すべてのSupply Demandトレーダーの皆さんのお気に召すはずです。:) 重要情報の公開 Advanced Supply Demandの可能性を最大化するには、 https://www.mql5.com/ja/blogs/post/720245 にアクセスしてください。   エントリーまたはターゲットの正確なトリガーポイントを正確に特定できれば取引がどのように改善されるか想像してみてください。新しい基盤となるアルゴリズムに基づいて構築されているため、買い手と売り手の間の潜在的な不均衡をさらに簡単に特定できます。これは、最も強い需要と供給のゾーンと、過去のパフォーマンス(古いゾーンを表示)がグラフィカルに表現されるためです。これらの機能は、最適な
現在20%OFF! 初心者やエキスパートトレーダーに最適なソリューションです。 このインディケータは、エキゾチックペア・コモディティ・インデックス・先物など、あらゆるシンボルの通貨の強さを表示することに特化したインディケータです。金、銀、原油、DAX、US30、MXN、TRY、CNHなどの通貨の強さを表示するために、9行目にどのシンボルでも追加することができます。独自の機能を多数搭載し、新しい計算式を採用したため、ユニークで高品質、かつ手頃な価格のトレーディングツールとなっています。新しいトレンドやスキャルピングチャンスのトリガーポイントを正確に把握することができるため、あなたのトレードがどのように改善されるか想像してみてください。 ユーザーマニュアル:ここをクリック   https://www.mql5.com/en/blogs/post/708876 すべての時間枠に対応します。あなたはすぐにトレンドを見ることができるようになります! 新しいアルゴリズムに基づいて設計されているため、潜在的な取引の特定と確認がより簡単になります。これは、8つの主要通貨と1つのシンボルの強弱
Looking for a powerful yet lightweight swing detector that accurately identifies market structure turning points? Want clear, reliable buy and sell signals that work across any timeframe and any instrument? Buy Sell Arrow MT Swing is built exactly for that — precision swing detection made simple and effective. This indicator identifies Higher Highs (HH) , Higher Lows (HL) , Lower Highs (LH) , and Lower Lows (LL) with remarkable clarity. It is designed to help traders easily visualize market stru
現在40%OFF! 初心者やエキスパートトレーダーのためのベストソリューション! このダッシュボードソフトウェアは、28の通貨ペアで動作しています。それは私達の主要な指標(高度な通貨の強さ28と高度な通貨インパルス)の2に基づいています。それは全体の外国為替市場の大きい概観を与えます。それは、すべての(9)時間枠で28の外国為替ペアのための高度な通貨の強さの値、通貨の動きの速度と信号を示しています。チャート上で1つのインディケータを使用して市場全体を観察し、トレンドやスキャルピングの機会をピンポイントで見つけることができたら、あなたのトレードがどのように改善されるか想像してみてください。 このインディケータには、強い通貨と弱い通貨の識別、潜在的な取引の識別と確認がより簡単になるような機能が搭載されています。このインディケータは、通貨の強さや弱さが増加しているか減少しているか、また、すべての時間枠でどのように機能しているかをグラフィカルに表示します。 新機能として、現在の市場環境の変化に適応するダイナミックなマーケットフィボナッチレベルが追加され、すでに当社のAdvanced
FX Volume
Daniel Stein
4.63 (38)
FX Volume:ブローカー視点で捉える本物の市場センチメント クイック概要 トレード手法をさらに高めたいとお考えですか? FX Volume は、リテールトレーダーやブローカーのポジション状況をリアルタイムで提供します。これは、COTのような遅延レポートよりもはるかに早く知ることができます。安定した利益を目指す方も、さらなる優位性を求める方も、 FX Volume は大きな不均衡を見極め、ブレイクアウトを確認し、リスク管理を洗練させるのに役立ちます。今すぐ始めて、実際の出来高データがどのように意思決定を変革するかを体感してください! 1. FX Volume がトレーダーにとって非常に有益な理由 高精度の早期警戒シグナル • 各通貨ペアを売買しているトレーダー数を、他者よりも早く、ほぼリアルタイムで把握できます。 • FX Volume は、複数のリテールブローカーから得られる本物の出来高データを収集し、分かりやすい形式で提供する 唯一 のツールです。 強力なリスク管理 • ロングやショートの大きな偏り(インバランス)を特定し、潜在的なトレンド転換を見逃しません。ストップ
Presenting one-of-a-kind Gann Indicator for XAUUSD IQ Gold Gann Levels is a non-repainting, precision tool designed exclusively for XAUUSD/Gold intraday trading. It uses W.D. Gann’s square root method to plot real-time support and resistance levels, helping traders spot high-probability entries with confidence and clarity. William Delbert Gann (W.D. Gann) was an exceptional market analyst whose trading technique was based on a complex blend of mathematics, geometry, astrology, and ancient calcul
Smart Sweep Sniper MT4
Vincent Georges David Ferrier
# Smart Sweep Sniper MT4 Version MT4 Midnight Pro Edition , specialized for scalping and day trading in Prop Firm, Available here MT5 Version available here ## The Institutional Edge — Detect Where Smart Money Acts, Enter When It Matters If you like it, leave a positive review to support its development. If you encounter a bug, let us know before posting a review. When you complete your challenge, share your certificate in the comments. Happy trading! Smart Sweep Sniper is a precision-engine
PRO Renko Systemは、特別にRENKOチャートを取引するために設計された高精度の取引システムです。 これは、様々な取引商品に適用することができる普遍的なシステムです。 システムは効果的に正確な逆転信号へのアクセスを与えるいわゆる市場の騒音を中和する。 表示器は非常に使いやすく、信号の生成に責任がある1つの変数だけがあります。 あなたは簡単にお好みの任意の取引ツールとレンコバーのサイズにツールを適応させることができます。 私はいつもあなたが私のソフトウェアで収益性の高い取引を支援するために余分なサポートを提供する準備ができています! 私はあなたに幸せで収益性の高い取引をしたいです! ご購入後にご連絡ください! 私はあなたに私のレンコチャートジェネレータを送信します。 私はまた、私の個人的な推奨事項やシステムの他のモジュールを無料で共有します!
まず第一に、この取引インジケーターは再描画されず、再描画されず、遅延しないことを強調する価値があります。これにより、手動取引とロボット取引の両方に理想的なものになります。 ユーザーマニュアル:設定、入力、戦略。 アトミックアナリストは、価格の強さとモメンタムを利用して市場でより良いエッジを見つけるためのPA価格アクションインジケーターです。ノイズや誤ったシグナルを除去し、取引ポテンシャルを高めるための高度なフィルターを備えています。複雑なインジケーターの複数のレイヤーを使用して、アトミックアナリストはチャートをスキャンし、複雑な数学的計算をシンプルなシグナルと色に変換します。これにより、どのような初心者トレーダーでも理解して使用し、一貫した取引の決定を行うことができます。 「アトミックアナリスト」は、新規および経験豊富なトレーダー向けにカスタマイズされた包括的な取引ソリューションです。プレミアムインジケーターとトップノッチの機能を1つの取引戦略に組み合わせ、すべてのタイプのトレーダーにとって汎用性のある選択肢にします。 デイリートレーディングとスキャルピング戦略:高速で正確な
El indicador "MR BEAST ALERTAS DE LIQUIDEZ" es una herramienta avanzada diseñada para proporcionar señales y alertas sobre la liquidez del mercado basándose en una serie de indicadores técnicos y análisis de tendencias. Ideal para traders que buscan oportunidades de trading en función de la dinámica de precios y los niveles de volatilidad, este indicador ofrece una visualización clara y detallada en la ventana del gráfico de MetaTrader. Características Principales: Canal ATR Adaptativo: Calcula
Gold Scalper Super is an easy-to-use trading system. The indicator can be used as a standalone scalping system on the M1 time frame, as well as part of your existing trading system. Bonus: when purchasing an indicator, Trend Arrow Super is provided free of charge, write to us after purchase. The indicator 100% does not repaint!!! If a signal appears, it does not disappear! Unlike indicators with redrawing, which lead to the loss of a deposit, because they can show a signal and then remove it.
IQ FX Gann Levels a precision trading indicator based on W.D. Gann’s square root methods . It plots real-time, non-repainting support and resistance levels to help traders confidently spot intraday and scalping opportunities with high accuracy. William Delbert Gann (W.D. Gann) was an exceptional market analyst, whose trading technique was based on a complex blend of mathematics, geometry, astrology, and ancient mathematics which proved to be extremely accurate. Setup & Guide:  Download  MT5 Ver
FX Power: 通貨の強弱を分析して、より賢い取引を実現 概要 FX Power は主要通貨と金の実際の強弱をあらゆる市場状況で理解するための必須ツールです。強い通貨を買い、弱い通貨を売ることで、 FX Power は取引の意思決定を簡素化し、高い確率の取引機会を見出します。トレンドを追従する場合でも、極端なデルタ値を使用して反転を予測する場合でも、このツールはあなたの取引スタイルに完全に適応します。ただ取引するだけではなく、 FX Power で賢く取引をしましょう。 1. なぜ FX Power がトレーダーにとって非常に有益なのか 通貨と金のリアルタイム強弱分析 • FX Power は主要通貨と金の相対的な強弱を計算し、マーケットダイナミクスに関する明確な洞察を提供します。 • どの資産がリードしているか、または後れを取っているかを監視して、取引するペアを賢く選びましょう。 マルチタイムフレームの包括的なビュー • 短期、中期、長期のタイムフレームで通貨と金の強弱を追跡し、マーケットトレンドに基づいて取引戦略を調整できます。 • スキャルピングからスイングトレード
Step into the world of Forex trading with confidence, clarity, and precision using   Gold Indicator   a next-generation tool engineered to take your trading performance to the next level. Whether you’re a seasoned professional or just beginning your journey in the currency markets, Gold Indicator equips you with powerful insights and help you trade smarter, not harder. Built on the proven synergy of three advanced indicators, Gold Indicator focuses exclusively on medium and long-term trends eli
Introduction Harmonic Patterns are best used to predict potential turning point. Traditionally, Harmonic Pattern was identified manually connecting peaks and troughs points in the chart. Manual harmonic pattern detection is painfully tedious and not suitable for everyone. You are often exposed under subjective pattern identification with manual pattern detection. To avoid these limitations, Harmonic Pattern Plus was designed to automate your harmonic pattern detection process. The functionality
Pips Stalker
Abdulkarim Karazon
5 (2)
Pips Stalkerはロングショートアロータイプのインジケーターで、あらゆるレベルのトレーダーがより良い意思決定を行えるようにサポートします。インジケーターはリペイントされず、RSIを主なシグナルロジックとして用い、一度矢印が出されるとリペイントやバックペイントはなく、矢印の遅延もありません。 PIPS STALKER ARROWの特徴 : スタッツパネル は、全体の勝率%や連続の最大勝敗トレード数などの有用な統計、その他有用な情報を表示するユニークな情報ダッシュボードです。 TPとSL、組み込みのマネーマネジメント 指標は各矢印でTPとSLのオブジェクトを示し、トレーダーはマネーとリスク管理を組み込み、SLはATRに基づいて、TPは現在のATR SL価値に基づくリスク対リターン比率に基づいています。 再塗装不要、高い調整可能性 インジケーターはシグナル品質向上のオプションを豊富に提供しており、わずかな期間調整だけでどのペアでも機能します。パネルはトレーダーに現在の設定や期間が利益を上げているかどうかを示します。推奨期間枠:M1。 再調整開始資本金:100ドル。 推奨アカ
CRT Multi-Timeframe Market Structure & Liquidity Sweep Indicator Non-Repainting | Multi-Asset | MT5 Version Available MT5 Version:   https://www.mql5.com/en/market/product/162075 Full User Guide — explains what each feature does and why:   https://www.mql5.com/en/blogs/post/767525 Quick Start User Guide  — explains how to configure and in what order:  https://www.mql5.com/en/blogs/post/767540 Indicator Overview CRT Ghost Candle HTF Fractal is a complete institutional-grade market structure too
Meravith
Ivan Stefanov
5 (3)
マーケットメーカーのためのツール。 Meravith は次の機能を提供します: すべての時間足を分析し、現在有効なトレンドを表示します。 強気と弱気の出来高が等しくなる流動性ゾーン(出来高均衡)を強調表示します。 異なる時間足のすべての流動性レベルをチャート上に直接表示します。 テキスト形式の市場分析を生成し、参考情報として表示します。 現在のトレンドに基づいて目標値、サポートレベル、ストップロスを計算します。 取引のリスクリワード比を算出します。 口座残高に基づいてポジションサイズを計算し、潜在的な利益を推定します。 また、市場に大きな変化があった場合には警告を表示します。 インジケーターの主要ライン: 強気/弱気の出来高エグゾーストライン ― 目標値として機能します。 市場のトレンドを示すライン。市場が強気か弱気かによって色が変わり、トレンドのサポートとして機能します。主にその色が市場センチメントを示します。 出来高均衡ライン(Eq)。Eq(Volume Equilibrium)ラインはシステムの中核です。これは買い手と売り手の出来高のバランスポイントを表します。市場の流動性を示し
作者のその他のプロダクト
DarkLand
Daniil Evstratenko
The robot is designed for automatic night trading. The strategy is suitable for many currency pairs. You can trade several pairs at the same time. The EA opens trades from 21:00 to 1:00 by EET time (GMT + 3 in summer, + 2 in winter). GMT time of the broker is determined automatically, or you can configure it manually (required in the tester). A special price channel indicator is used for the entry and exit signals. At the bottom of the channel there is a BUY signal, at the top for SELL. Dependin
フィルタ:
レビューなし
レビューに返信