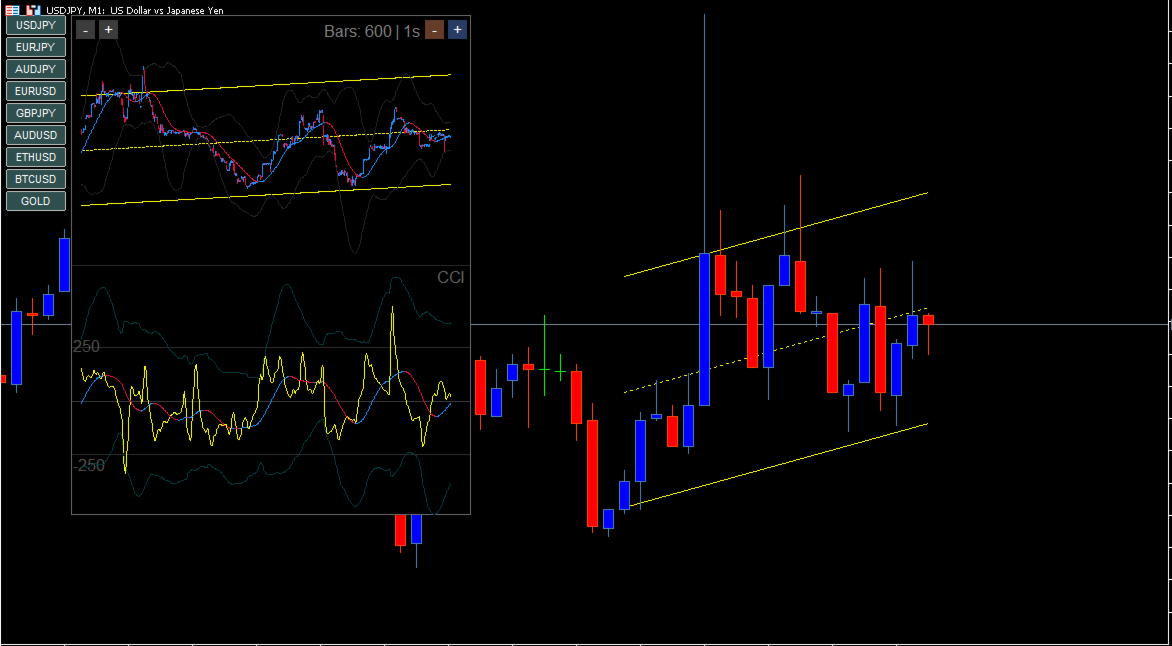
Multi Second Scope Chart Generator
- インディケータ
- バージョン: 1.1
- アップデート済み: 21 4月 2026

「秒足のノイズを、獲るためのシグナルへ。」
本ツールは、通常のMT5では表示できない**「秒足チャート(1秒足)」をサブウィンドウに生成し、その秒足専用に設計された「CCI Engine」**を搭載した超短期決戦用トレーディングツールです。
📊 コンセプト
FXのスキャルピングやバイナリーオプションにおいて、1分足の確定を待っていては「手遅れ」になることが多々あります。本ツールは、1分足よりもさらにミクロな視点を1つのパネルに凝縮。 ノイズになりがちな秒単位の値動きを、**CCI(順張りの勢い)× ALMA(滑らかな移動平均)× ボリンジャーバンド(ボラティリティ)**の多層構造で解析し、明確なエントリーポイントを浮き彫りにします。
🔥 主な機能
1. 高速描画・多機能秒足キャンバス
-
秒足生成: リアルタイムのティックデータから1秒〜任意の秒足チャートを生成。
-
自由な操作: キャンバス上の「+/ー」ボタンで、表示本数(最大1500本)やウィンドウサイズを瞬時に変更可能。
-
ワンクリック銘柄切り替え: 左側に配置されたボタンで、主要通貨ペアやGOLD、BTCを一瞬で切り替え(複数チャート同期機能付き)。
2. 次世代型「CCI Engine」
単なるCCIではありません。2つのテクニカルを秒足用に最適化して統合しました。
-
Trigger ALMA(黄線): 非常に滑らか、かつ遅行性の少ない移動平均でCCIをさらに平滑化。しきい値・ボリンジャーを超えると反発・反落のリスクが高まります。
-
CCI-Bollinger Bands: CCI自体のボラティリティを計測。バンドウォークやスクイーズにより、ブレイクアウトの予兆を察知します。
3. M1 Linear Regression(1分足回帰トレンド同期)
-
秒足を見ていると迷子になりがちな「大局」を、1分足の線形回帰トレンドとして秒足チャート上に直接投影。
-
「1分足のトレンド方向に、秒足のCCIが突き抜けた瞬間」という、勝率の高いポイントを視覚的に逃しません。
🛠 パラメーター設定
-
InpSecInterval: 秒足は1S、5S、15Sから選択。(VerUPしました)
-
Preset Mode: 1秒足用の疑似上位足最適化プリセットを選択可能(ローソク足換算)。
-
Display Flags: CCI、AI予測、MACDなど各パネルの表示/非表示を個別にトグル(今後搭載予定)
-
Color Settings: キャンバス背景から各ラインの色、自由にカスタマイズ可能。
💎 無料配布の経緯
上位モデル「AI予測エンジン付完全版」の操作感と、秒足チャートの有用性をより多くのトレーダーに体感していただくため、秒足作成ロジックと推しのCCIを完全無料で公開することにいたしました。
是非、秒足のリアルタイムな波を体験して頂きたい。
| 機能 | 無料版 | Pro版 |
|---|---|---|
| 秒足HUD | ✔ | ✔ |
| CCIエンジン | ✔ | ✔ |
| シークバー | ✔ | ✔ |
| プリセット | ✔ | ✔ |
| マルチ通貨ボタン | ✔ | ✔ |
| M1回帰バンド | ✔ | ✔ |
| MACD 4色ヒストグラム | ✖ | ✔ |
| AI予測スコア | ✖ | ✔ |
-
148 USD(買い切り)
-
30 USD(1ヶ月)
-
60 USD(6ヶ月)
-
80 USD(1年)
コメントやレビュー、こういう機能があればいいのに!といったご意見もお待ちしております!
ユーザーは評価に対して何もコメントを残しませんでした
Thank you for downloading! Although not yet in the built-in presets, here are the optimized settings and strategies for the 15-second interval. This setup is designed to filter out market noise and capture stable trends. 1. Optimized Settings for 15s
CCI Period: 105 Short-term ALMA (Yellow): 51 Long-term ALMA (Blue/Red): 315 BB Deviation: 2.0 Threshold Level: 160 2. Trading Strategies
A. Reversal Signals (Overbought/Oversold) The 160 & BB Rule: When the Yellow line exceeds the ±160 level AND simultaneously touches or pierces the Bollinger Band (2.0), there is an extremely high probability of a reversal on the very next bar. SELL: Yellow line hits Upper BB above +160. BUY: Yellow line hits Lower BB below -160. Note: While each condition works alone, the win rate is significantly higher when they occur simultaneously. B. Momentum Signals (Crossovers) The Cross Rule: When the Yellow line crosses the Long-term ALMA (Blue/Red), the price tends to follow the direction of the cross. Bullish: Yellow crosses above Blue. Bearish: Yellow crosses below Red. Since noise is filtered in the 15s/30s settings, these crossovers are highly reliable. C. The "Band Walk" Exception Warning: If a BB pierce occurs with strong momentum after a "Squeeze" (low volatility period), it may trigger a Band Walk. In a Band Walk, the trend will continue despite temporary dips. Trend Shift Signal: The trend officially ends when the Yellow line crosses back over the Center line (Long-term ALMA). D. Trend Direction (Win Rate Optimization)
For the best results, always trade in the direction of the Center line color: Center line is BLUE: Focus on BUY entries. Center line is RED: Focus on SELL entries.