Multi Second Scope Chart Generator
- Indicadores
- Versão: 1.1
- Atualizado: 21 abril 2026

“Turn second‑chart noise into actionable signals.” This tool generates a true second‑based chart (1‑second candles) inside a sub‑window—something MT5 cannot display by default—and equips it with a CCI Engine engineered specifically for second‑level price action. It is a high‑precision trading tool built for ultra‑short‑term decision making.
🟨 Differences Between Free and Pro Versions
🟧 Pricing
We welcome comments, reviews, and feature requests. Let us know what you’d like to see next!
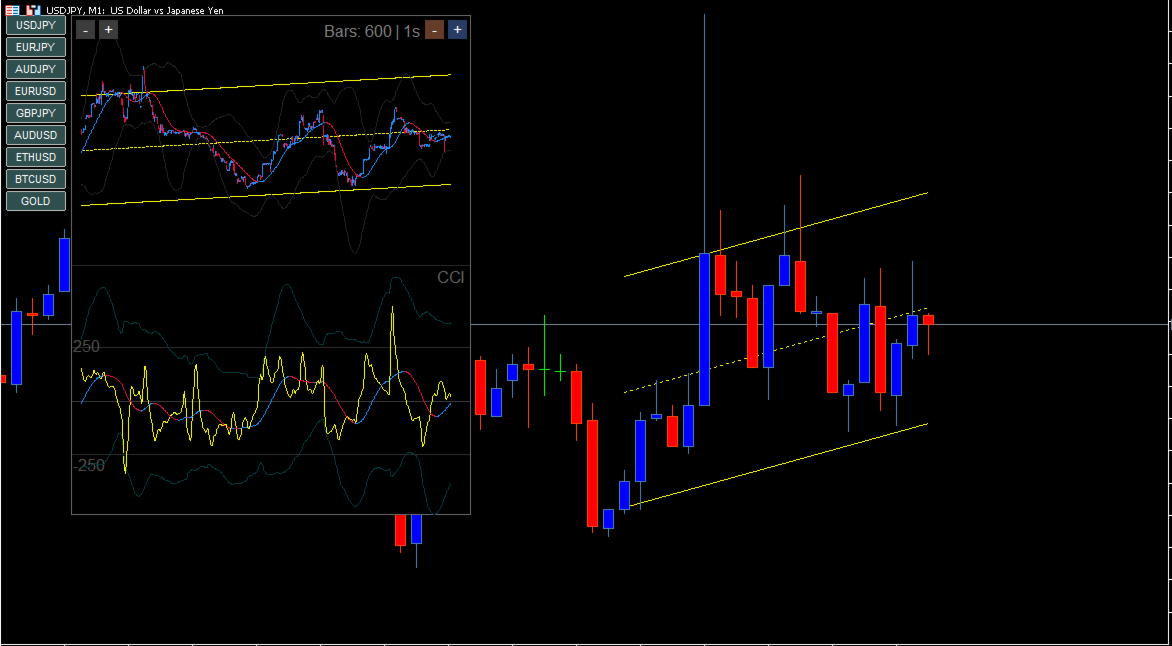
📊 Concept
In FX scalping and binary options, waiting for a 1‑minute candle to close often means you’re already too late. This tool condenses a micro‑level view—far more granular than the 1‑minute chart—into a single panel. What normally appears as random noise at the second level is analyzed through a multi‑layer structure of CCI (momentum) × ALMA (smooth trend) × Bollinger Bands (volatility), revealing clear entry opportunities that standard timeframes cannot show.🔥 Key Features
1. High‑speed, multi‑functional second‑chart canvas
- Second‑chart generation: Builds 1‑second to custom‑second candles directly from real‑time tick data.
- Flexible control: Resize the window or adjust the number of displayed candles (up to 1500) instantly using the “+/–” buttons.
- One‑click symbol switching: Quickly switch between major FX pairs, GOLD, BTC, and more using the left‑side buttons (with multi‑chart sync support).
2. Next‑generation “CCI Engine”
This is far more than a simple CCI. Two technical layers are optimized and integrated specifically for second‑based analysis.- Trigger ALMA (yellow): A highly smooth, low‑lag moving average applied to CCI. When it crosses thresholds or Bollinger Bands, the probability of a reversal increases sharply.
- CCI‑Bollinger Bands: Measures the volatility of CCI itself. Band walks and squeezes reveal early signs of breakouts.
3. M1 Linear Regression (1‑minute trend synchronization)
- When watching second‑based movement, it’s easy to lose sight of the bigger picture. This feature projects the 1‑minute linear regression trend directly onto the second‑chart canvas.
- It highlights high‑probability moments such as “When the second‑chart CCI breaks out in the same direction as the 1‑minute trend.”
🛠 Parameter Settings
- InpSecInterval: Choose between 1s, 5s, and 15s second charts (updated version).
- Preset Mode: Select optimized pseudo‑higher‑timeframe presets for second‑based candles.
- Display Flags: Toggle visibility of CCI, AI prediction, MACD, and other panels individually (more features coming).
- Color Settings: Customize everything—from canvas background to each indicator line.
💎 Why This Version Is Free
To let more traders experience the power of second‑based charts and the usability of the interface, we decided to release the core second‑chart engine and our signature CCI Engine completely free. Try it and feel the real‑time rhythm of the market.🟨 Differences Between Free and Pro Versions
| Feature | Free Version | Pro Version |
|---|---|---|
| Second‑chart HUD | ✔ | ✔ |
| CCI Engine | ✔ | ✔ |
| Seek Bar | ✔ | ✔ |
| Presets | ✔ | ✔ |
| Multi‑symbol Buttons | ✔ | ✔ |
| M1 Regression Bands | ✔ | ✔ |
| MACD 4‑color Histogram | ✖ | ✔ |
| AI Prediction Score | ✖ | ✔ |
🟧 Pricing
- 148 USD (lifetime)
- 30 USD (1 month)
- 60 USD (6 months)
- 80 USD (1 year)
We welcome comments, reviews, and feature requests. Let us know what you’d like to see next!
O usuário não deixou nenhum comentário para sua avaliação
Thank you for downloading! Although not yet in the built-in presets, here are the optimized settings and strategies for the 15-second interval. This setup is designed to filter out market noise and capture stable trends. 1. Optimized Settings for 15s
CCI Period: 105 Short-term ALMA (Yellow): 51 Long-term ALMA (Blue/Red): 315 BB Deviation: 2.0 Threshold Level: 160 2. Trading Strategies
A. Reversal Signals (Overbought/Oversold) The 160 & BB Rule: When the Yellow line exceeds the ±160 level AND simultaneously touches or pierces the Bollinger Band (2.0), there is an extremely high probability of a reversal on the very next bar. SELL: Yellow line hits Upper BB above +160. BUY: Yellow line hits Lower BB below -160. Note: While each condition works alone, the win rate is significantly higher when they occur simultaneously. B. Momentum Signals (Crossovers) The Cross Rule: When the Yellow line crosses the Long-term ALMA (Blue/Red), the price tends to follow the direction of the cross. Bullish: Yellow crosses above Blue. Bearish: Yellow crosses below Red. Since noise is filtered in the 15s/30s settings, these crossovers are highly reliable. C. The "Band Walk" Exception Warning: If a BB pierce occurs with strong momentum after a "Squeeze" (low volatility period), it may trigger a Band Walk. In a Band Walk, the trend will continue despite temporary dips. Trend Shift Signal: The trend officially ends when the Yellow line crosses back over the Center line (Long-term ALMA). D. Trend Direction (Win Rate Optimization)
For the best results, always trade in the direction of the Center line color: Center line is BLUE: Focus on BUY entries. Center line is RED: Focus on SELL entries.