AZ ATR indicator with volume correlation bonus
- インディケータ
- バージョン: 1.24
- アップデート済み: 7 6月 2026

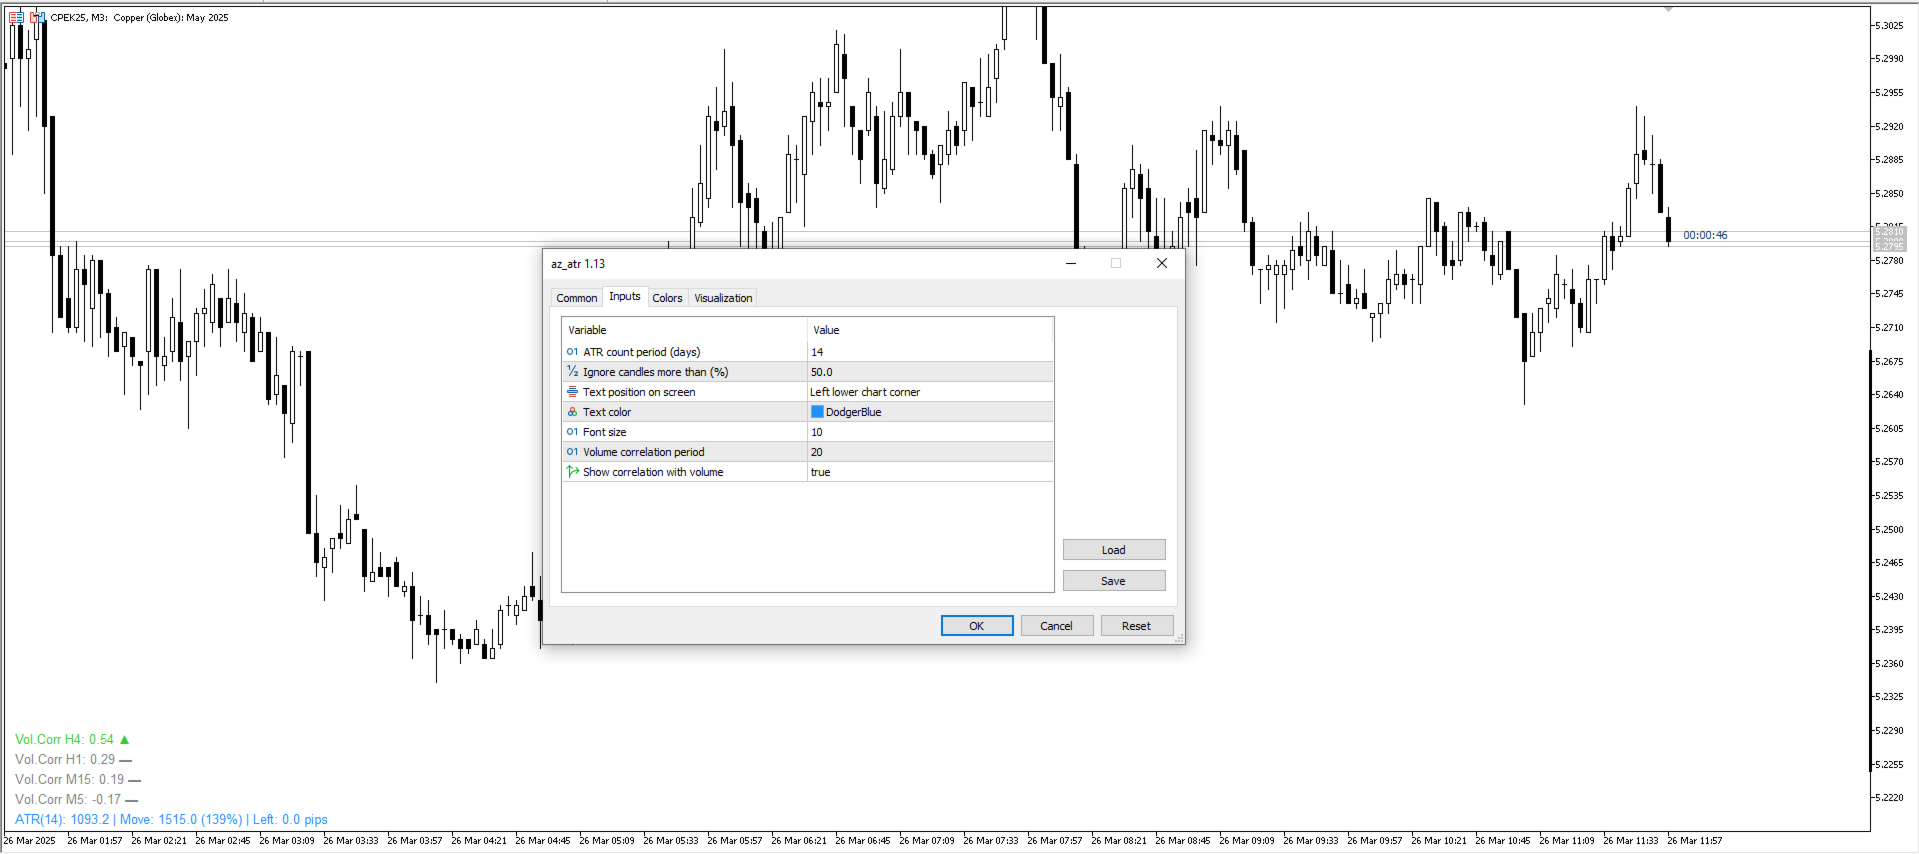
What do the values mean:
🟢 Positive correlation (0.3 - 1.0):
▲ 0.3-0.7 - moderate connection
▲▲▲ 0.7-1.0 - strong connection
It means: Price growth is accompanied by volume growth = the movement is confirmed by market participants. This is a healthy trend with conviction.
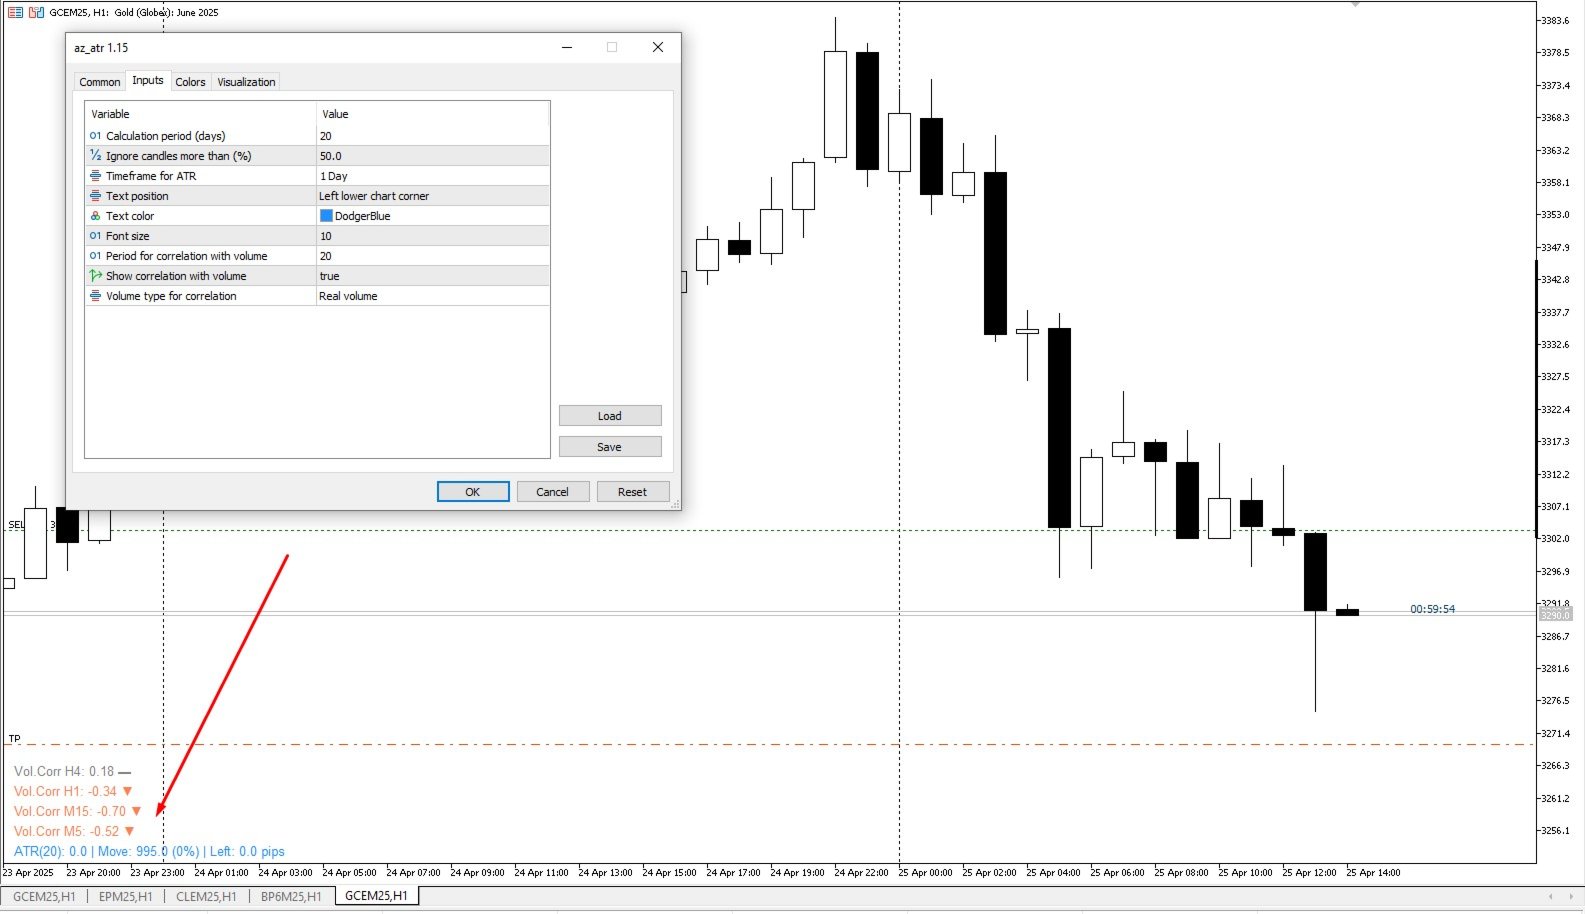
🔴 Negative correlation (-0.3 to -1.0):
▼ -0.3 to -0.7 - moderate feedback
▼▼▼ -0.7 to -1.0 - strong feedback
It means: The price rises, but the volume falls (or vice versa) = movement without confirmation. Reversal or attenuation of the trend is possible.
⚪ Neutral (-0.3 to 0.3):
▬ - weak or no connection
It means: The volume is not connected with the price movement = uncertainty, consolidation or random movement.
Practical application:
H4: ▲▲▲ 0.85 + D1: ▲ 0.45 = strong confirmation of the trend on several timeframes → confidently enters
H4: ▼▼▼ -0.80 = movement without volume → caution, possible trap
All ▬ = flat, better to wait
P.S. But if you want a real indicator that can change your vision of trading - try my AZ Volzone SYSTEM. Good luck!


Спасибо автору за хороший и полезный индикатор