MACD Ultra Pro v3

  • インディケータ
  • Oleksandr Sheyko
    Oleksandr Sheyko
    2017年から積極的に金融市場で取引を行っています。人々がトレーディングをより理解できるよう支援し、明確さと成果をもたらすカスタムインジケーターや戦略を開発しています。
  • バージョン: 3.1
  • アクティベーション: 5

MACD Ultra Pro v3.1 – 単なるMACDではない

MACD Ultra Pro v3.1 は標準的なMACDではありません。これは大幅に強化されたバージョンで、リアルタイムの深いデータ分析を組み込んでいます。このインジケーターは現在の価格動向を追跡するだけでなく、過去の市場履歴を分析し、その結果をもとに将来のトレンドを予測的に示します。

🔍 従来のMACDとの違い

  • リアルタイムのデータ分析 – 価格データだけでなく、取引量、市場のモメンタム、トレンドの動きを処理。

  • 分析の調整機能 – パラメータを細かく設定し、市場やタイムフレームに合わせて最適化可能。

  • 履歴分析 – 過去の動きを評価し、現在のシグナルに反映。

  • 予測能力 – 将来の市場方向をより正確に見極めるサポート。

⚙️ 1つのツールに統合された包括的な機能

  • MACDのダイバージェンスとコンバージェンス – チャート上に明確に表示。

  • ヒストグラムとシグナルライン – 動きの強さを色分けして表示。

  • ボリューム分析 – 異常な取引量を検出し、シグナルへの影響を評価。

  • RSIフィルター – 過買い/過売りゾーンでの誤ったシグナルを減少。

  • トレンドフィルター – 主要トレンドの方向に沿った取引のみを許可。

  • 詳細情報パネル – タイムフレーム、市場履歴、シグナル強度、ボリューム、MACD、RSI、トレンド方向を画面に表示。

📢 アラートと通知

取引チャンスを逃さないための機能:

  • プラットフォーム内アラート – 直接ターミナルに通知。

  • サウンド通知 – 選択したタイムフレームに応じて調整。

  • メール通知 – 任意で受信可能。

  • プッシュ通知 – 携帯電話に即時送信。

🏆 まとめ

MACD Ultra Pro v3.1 は複数の高度な機能を統合した強力な取引ツールです。単なる改良版MACDではなく、テクニカル指標、インテリジェントフィルター、リアルタイムデータ処理を組み合わせた包括的な分析システムです。信頼性の高いシグナル、深い市場洞察、そして意思決定の支援を提供します。


おすすめのプロダクト
Manyal trading system, CovEchoTrend Robot, focuses on reliability and flexibility. By employing statistical analysis methods to study the relationships between the base indicator and market patterns, the system enables a deeper understanding of market processes. Intelligent pattern analysis: The application of statistical data processing helps identify key trend reversal points more accurately, signaling significant market shifts. Informed decision-making is based on the intersection of indicato
Trend indicator, a revolutionary unique solution for trend trading and filtering with all important trend features built into one tool! This is a 100% non-repainting multi-timeframe and multi-currency indicator that can be used on all currency pairs. HandleTrend is an effective trend following indicator that gives trend signals in the form of arrows on the chart.
The implementation of the Trend Turn trend indicator is simple - in the form of lines of two colors. The indicator algorithm is based on standard indicators as well as its own mathematical calculations. The indicator will help users determine the direction of the trend. It will also become an indispensable advisor for entering the market or closing a position. This indicator is recommended for everyone, both beginners and professionals. How to interpret information from the indicator. We sell
MarketMagnet
Kelly Adediran Raymond
Are you ready to take your trading journey to new heights? Look no further than MarketMagnet, this groundbreaking indicator designed to propel your trading success with excitement and accuracy. Powered by the convergence of Momentum and CCI (Commodity Channel Index), MarketMagnet equips traders with the ultimate tool to determine direction and entry prices for a wide range of recommended currency pairs and instruments. It is designed for traders seeking to scalp for a few pips on lower timeframe
Our BOOM SELL ALERT indicator is specifically engineered to   take candles on BOOM 1000 , BOOM 500 is tool is optimized for M1 (1-minute) timeframe, ensuring you receive timely and actionable insights.   The indicator is a combination of   many indicators. -        AO Oscillator -        Stochastic   HOW TO USE THIS INDICATOR To use well this indicator , it   need to use SCHAFF TREND RSX ( 5 MIN OR M5) IF SCHAFF trend RSX is GREEN and you have a signal then SELL when you have ENTRY and out with
Introduction to Fractal Pattern Scanner Fractal Indicator refers to the technical indicator that makes use of the fractal geometry found in the financial market. Fractal Pattern Scanner is the advanced Fractal Indicator that brings the latest trading technology after the extensive research and development work in the fractal geometry in the financial market. The most important feature in Fractal Pattern Scanner is the ability to measure the turning point probability as well as the trend probabil
Limitless MT5 is a universal indicator suitable for every beginner and experienced trader. works on all currency pairs, cryptocurrencies, raw stocks Limitless MT5 - already configured and does not require additional configuration And now the main thing Why Limitless MT5? 1 complete lack of redrawing 2 two years of testing by the best specialists in trading 3 the accuracy of correct signals exceeds 80% 4 performed well in trading during news releases Trading rules 1 buy signal - the ap
新しいトレーディングツール:トレードを最適化しよう! 私は、悩まずに簡単に取引できるように開発した全く新しいツールを紹介できることを嬉しく思います!従来の指標とは異なり、このツールは単に価格の変動を追跡するのではなく、通貨間の相関関係を深く分析し、市場に入る戦略的なタイミングを見つける手助けをします。 使い方は以下の通りです: ゼロ = 取引なし:指標がゼロの間は、市場の条件が適していないことを意味し、市場に参加しません。 4の数字でアラートが発動:通貨の1つが4に達すると、ツールがアラートを送信し、4つの通貨ペアで取引をするのに適した条件が整ったことを知らせます。 相関関係の分析:従来の指標とは異なり、このツールは通貨間の相関に基づいています。例えば、ある通貨がドルと相関している場合は1、2つの通貨が相関していれば2となります。4に達すると、それは複数の通貨がドルに対して弱いことを意味し、ツールは4つの通貨ペアをアラートとして送信します。 各通貨ペアを手動で探す手間を省く、時間を大幅に節約できるツールです!このツールは最適な取引機会を自動的にお知らせします。 今こそ

The Second-Level Tick Candlestick Generator is a professional-grade MT5 indicator tool specifically designed for high-frequency trading and short-term scalping. It can convert raw tick data into highly customizable second-level candlestick charts in real-time, helping traders accurately capture micro-market fluctuations and optimize entry and exit timing. This tool provides clear chart displays, allowing you to more intuitively identify price action patterns and improve trading decision efficien
7FIGURES TREND — MT5 Trend & Signal Indicator See the trend. Read the market. Trade with greater clarity. 7FIGURES TREND is a professional MetaTrader 5 trend and signal indicator designed for traders who want a cleaner and simpler view of market direction without filling their charts with unnecessary technical information. The indicator performs its analysis in the background and presents the trader with clear information directly on the chart. WHAT 7FIGURES TREND SHOWS The system identifies the
Gioteen Volatility Index (GVI) - your ultimate solution to overcoming market unpredictability and maximizing trading opportunities. This revolutionary indicator helps you in lowering your losing trades due to choppy market movements. The GVI is designed to measure market volatility, providing you with valuable insights to identify the most favorable trading prospects. Its intuitive interface consists of a dynamic red line representing the volatility index, accompanied by blue line that indicate
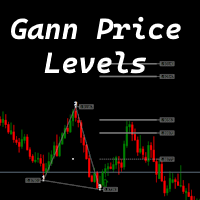
The indicator is designed to work on any trading platform. The program is based on proprietary algorithms and W.D.Ganna's mathematics, allowing you to calculate target levels of price movement based on three points with the highest degree of certainty. It is a great tool for stock trading. The indicator has three buttons: NEW - call up a triangle for calculation. DEL - delete the selected triangle. DELS - completely remove all constructions. The probability of achieving the goals is more than 80
The Plasma Trend indicator is a simple technical indication that is used to determine the current trend direction in the market. The Plasma Trend indicator is a powerful tool for determining the direction of the trend in the Forex market. It is based on both standard technical indicators and proprietary mathematical calculations, which provides a more accurate and reliable trend determination. Its implementation in the form of lines of two colors simplifies the visual determination of a change
RBreaker Gold Indicatorsは、金先物の短期日内取引戦略であり、トレンドフォローと日内反転の2つの取引手法を組み合わせたものです。トレンド相場での利益を捉えるだけでなく、相場が反転した際には迅速に利確し、その流れに沿ってポジションを反転させることができます。 この戦略は、アメリカの雑誌『Futures Truth』において、15年連続で最も収益性の高い取引戦略トップ10に選ばれた実績を持ち、非常に長いライフサイクルを誇り、現在も国内外で広く使用・研究されています。 本インディケーターは、2026年の金先物の値動きに対応し、14日間のATR指標に基づいて、ブレイクアウト係数A、観察係数B、リバーサル係数Rをより合理的な値で定義しています。非常に優れたインディケーターであり、安定的な年間収益を実現しています。ぜひおすすめします〜
HTB Throne Gold Scalper EA は、XAUUSD(ゴールド)を対象とした自動売買システムで、M5 の時間足で動作します。 事前に定義されたルールと管理されたリスクパラメータに基づき、日中のスキャルピング取引を実行します。 本 EA は、市場構造およびボラティリティの状況を分析して取引機会を選択します。 各取引は個別に管理されます。 グリッド戦略やマーチンゲール手法は使用していません。 リスク管理 全体的なリスクを管理するための日次損失制限 取引活動は口座残高に応じて調整されます 高いボラティリティが予想されるニュース時の取引を抑制するニュースフィルター ブローカーおよび口座要件 Raw Spread または ECN タイプの口座向けに設計 低スプレッドおよび高速な約定環境を推奨 XAUUSD に最適化 取引プロファイル 取引銘柄 XAUUSD(ゴールド) 時間足 M5 取引スタイル 日中スキャルピング 取引期間 短期 リスクモデル 管理型 戦略タイプ グリッドなし、マーチンゲールなし 推奨ユーザー リスク管理された自動売買に関心のあるトレーダー マーチンゲール手
WsFx Kvoo
Yasir Mohammed Sachit Sachit
WSFX KVOO is a complete, all-in-one price-action toolkit for MetaTrader 5. It combines a smart zigzag wave engine, auto-detected support/resistance order blocks, trend legs, a regression-based price channel, Head & Shoulders pattern recognition, and a live trade-plan builder (entry, trailing stop, and multi-target ladder) — all in one non-repainting indicator. Four live on-chart dashboards give you a full picture at a glance: overall trend and liquidity, a multi-timeframe (2m/15m/1h/4h/Daily) co
Tenos Ea
Sachin Nagar Shyamendra Nagar
TENOS EA   is a fully automated, multi-strategy Expert Advisor designed for MetaTrader 5, engineered to operate across major Forex pairs and precious metals. Built on a foundation of adaptive trend-following combined with intelligent hedging mechanics, TENOS EA aims to deliver consistent performance in both trending and ranging market conditions. its consistent profit maker and long term profit maker. Our website: https://easouq.shop/ Contact US on telegram: @OfficialEaSouq
Introduction to the Manual Backtesting Indicator on MQL5 The MetaTrader platform provides an excellent backtesting tool for evaluating Expert Advisors (EAs). However, when it comes to manually backtesting a strategy to assess its effectiveness, this tool has some limitations: You cannot manually draw zones or trend lines while in backtesting mode. You cannot switch timeframes to check time alignment. For example, if my strategy requires additional confirmation from a higher timeframe (HTF), this
Candlestick Scanner MT5 is a scanner indicator for MetaTrader 5 that watches many symbols and timeframes for 21 candlestick patterns. Each cell of its panel shows the latest pattern. A context filter can keep only patterns at a recent low (bullish) or high (bearish). A statistics table shows what price did after each pattern in your own history, next to the same measure for any bar. It is for traders who want to check a whole watchlist in one place. It works on closed bars only. A cell never cha
Stormer RSI 2
Ricardo Rodrigues Lucca
This strategy was learned from Stormer to be used on B3. Basically, 15 minutes before closing the market, it will check RSI and decided if it will open an position. This strategy do not define a stop loss. If the take profit reach the entry price it will close at market the position. The same happens if the maximal number of days is reached. It is created to brazilian people, so all configuration are in portuguese. Sorry Activations allowed have been set to 50.
NRP SMC PRO EA — Product Description Short Description Professional Smart Money Concepts Expert Advisor engineered for XAUUSD, combining institutional market structure analysis, Fair Value Gaps, liquidity sweeps, and prop-firm-focused risk management. Includes optional news filtering, trading sessions, trade journaling, and advanced capital protection. NRP SMC PRO EA — Institutional Smart Money Automation for MT5 NRP SMC PRO EA is a professional Smart Money Concepts Expert Advisor built around c
Perfect Trade Indicator PRO ULTRA for MT5 Perfect Trade Indicator PRO ULTRA — это многофункциональный аналитический индикатор для MetaTrader 5, созданный для трейдеров, которые работают с XAUUSD (Gold) и хотят видеть на графике не просто стрелки, а полноценную торговую картину. Индикатор предназначен для работы в стиле smart scalping / intraday trading на таймфреймах M15 и M30. Он объединяет несколько аналитических блоков в единый механизм и помогает находить более качественные торговые сет
Pattern Builder Pro — MetaTrader 5 用カスタムスイングパターンスキャナー Pattern Builder Pro は、任意のカスタムスイングパターンを手描きで作成し、複数の時間足にわたって Market Watch 内のすべての銘柄から統計的に類似した値動きの形状をスキャンできる MetaTrader 5 用インジケーター兼マーケットスキャナーです。ヘッドアンドショルダー、トライアングル、フラッグなど固定形状に限定される従来のチャートパターンインジケーターとは異なり、この MT5 パターン認識ツールでは独自のプライスアクションパターンを自由に定義でき(スイングポイント数・形状ともに任意)、Dynamic Time Warping(DTW)や Procrustes 解析を含む 11 項目の重み付け類似度エンジンによりリアルタイムで一致する形状を検出します。 主な機能: XYグリッド上のインタラクティブなパターン描画ボード、ピクセル単位でのスイングポイント配置 多指標類似度エンジン:形状、角度シーケンス、傾き、リトレースメント、エクステンション、スイング比
価格が流動性を探しに向かう可能性のある場所を把握 Liquidity Reaction Map MT5は、確定した価格構造に基づいて、潜在的なバイサイドおよびセルサイド流動性エリアを特定するチャート型市場分析インジケーターです。 スイングポイント、等しい高値と安値、前日および前週の水準、セッションの高値と安値、心理的なラウンド価格を整理された流動性マップに統合します。近接する水準は統合され、強度、現在価格からの距離、複数ソースの一致度に基づいて順位付けされます。 価格が流動性エリアに接近する、流動性をスイープする、反発する、またはブレイクする可能性のある場所を分析するために使用できます。取引の開始や管理は行いません。 流動性のソース 流動性マップは、次の情報から流動性を特定できます。 確定したスイング高値と安値 等しい高値と等しい安値 前日の高値と安値 前週の高値と安値 完了したセッションの高値と安値 心理的なラウンド価格水準 設定可能な複数の時間足 バイサイド流動性は関連する高値の上に表示され、セルサイド流動性は関連する安値の下に表示されます。 これらのエリアは、過去の価格構造から算
Caicai L&S Yield Histogram Important Notice: This indicator is an integral tool of the automated EA Caicai Long and Short Pair Trading . This indicator visually displays the percentage deviation (Yield %) of a pair's current spread relative to its own historical mean. It is an excellent tool for quickly visualizing the gross financial potential of a market distortion in Long & Short operations. Main Features: Percentage Visualization: Understand the size of the distortion in palpable percentage
Tragos
David Chokumanyara
TRAGOS Indicator – The GOAT of All Trading Indicators TRAGOS (Greek for “male goat”) isn’t just a name — it’s the GOAT: Greatest of All Time in trading indicators. Designed for Forex, Indices, Gold, Crypto, and Deriv Synthetic Indices (Boom & Crash, Volatility 75, Step, Jump, etc.), it gives you non-repainting buy, sell, and exit signals with unmatched clarity. Why TRAGOS? Non-Repainting Signals – 100% reliable. Audible, Email & Push Alerts – Never miss a trade. Trend Following – Rid
MagicZone – Advanced Order Flow & Market Depth Indicator MagicZone   is a professional multi‑dimensional indicator that visualises   order book dynamics ,   bid/ask pressure ,   volume‑based support/resistance zones , and   real‑time DOM (Depth of Market)   levels – all in a clean, customisable sub‑window. Ideal for   scalpers ,   day traders , and   order flow analysts   who want to see exactly where large orders accumulate and how market participants drive price. Key Features 1. Order Book
Gold Crazy EA   is an Expert Advisor designed specifically for trading Gold H1/ EU M15. It use some indicators to find the good Entry. And you can set SL or you can DCA if you want. It can be an Scalping or an Grid/ Martingale depend yours setting. This EA can Auto lot by Balance, set risk per trade. You also can set TP/ SL for earch trade or for basket of trade. - RSI_PERIOD - if = -1, then the default strategy works, if >0, then the RSI strategy works - MAX_ORDERS - to trade with only 1 order,
このプロダクトを購入した人は以下も購入しています
Boba Analysis Suite Boba Analysis Suite は、MetaTrader 5 向けの分析インジケーターです。市場構造、重要な価格帯、相場全体の状況を、一つのチャート画面にまとめて表示します。 トレーダーおよびトレーディング指導者としての実務経験をもとに開発され、市場の方向性の評価、重要な価格水準の特定、複数の時間足を組み合わせた分析など、体系的な分析プロセスを支援します。 相場の背景を踏まえた分析 個々のシグナルの意味は、相場の状況によって変わります。Boba Analysis Suite は、現在のチャート状況をより大きな市場構造と関連付け、あらかじめ定めたルールに沿って取引アイデアを検討するための分析を支援します。 主な分析機能: トレンドと市場構造: 市場の方向性と、その背景にある構造を評価します。 重要な価格帯と価格水準: さらに分析すべき重要な領域を視覚的に表示します。 複数の時間足: 異なる時間足の情報を組み合わせ、相場全体の状況を評価します。 視覚的な分析プロセス: 分析情報をチャート上で直接確認できます。 自主的な取引判断を支援 Boba
ARIPoint
Temirlan Kdyrkhan
1 (4)
ARIPoint is a powerful trading companion designed to generate high-probability entry signals with dynamic TP/SL/DP levels based on volatility. Built-in performance tracking shows win/loss stats, PP1/PP2 hits, and success rates all updated live. Key Features: Buy/Sell signals with adaptive volatility bands Real-time TP/SL/DP levels based on ATR Built-in MA Filter with optional ATR/StdDev volatility Performance stats panel (Success, Profit/Loss, PP1/PP2) Alerts via popup, sound, push, or email Cu
UZFX {SSS} スキャルピング・スマートシグナル v5.0 MT5は、変動の激しい市場において正確かつリアルタイムのシグナルを求めるスキャルパー、デイトレーダー、スイングトレーダー向けに設計された、リペイントのない高性能な取引インジケーターです。(UZFX-LABS)によって開発されたこのインジケーターは、価格行動分析、トレンド確認、スマートフィルタリングを組み合わせることで、すべての通貨ペアおよび時間枠において、高確率の売買シグナル、警告シグナル、トレンド継続の機会を生成します。 トレードの判断に迷うのはもうやめましょう。明確さ、正確さ、そして規律ある市場執行を求めるトレーダーのために設計された、体系的なシグナルシステムに従い始めましょう。 間違いなく、MQL5で入手可能な最高のインジケーターの一つです。絶対に見逃さないでください!!「スマートなトレーダーのためのスマートシグナル」 最新バージョン5.0がリリースされました。価格は予告なく最大499.99ドルまで値上がりする可能性がありますので、チャンスを逃さないようお早めにお求めください!! 購入を決める前に!無料トライアル
First time on MetaTrader, introducing IQ Star Lines, an original Vedic Astrology Based Intraday Trading Indicator. We don't offer free or bonus indicators in exchange of reviews from you. You won't need any free products with this indicator to make it work. ;) Enjoy! Welcome to the new and updated  IQ Star Lines , the ultimate fusion of ancient planetary cycles and modern quantitative trading, published for the first time on Metatrader. This is an indicator built by the developer, who has spent
ARICoin is a powerful trading companion designed to generate high-probability entry signals with dynamic TP/SL/DP levels based on volatility. Built-in performance tracking shows win/loss stats, PP1/PP2 hits, and success rates all updated live. Key Features: Buy/Sell signals with adaptive volatility bands Real-time TP/SL/DP levels based on ATR Built-in MA Filter with optional ATR/StdDev volatility Performance stats panel (Success, Profit/Loss, PP1/PP2) Alerts via popup, sound, push, or email Cust
MERAVITH SCANNERは、MetaTrader 5用のプロフェッショナルな金融市場インジケーターで、複数の分析ツールを一つの統合システムにまとめています。独自の出来高加重平均価格(VWAP)手法を使用してすべての計算を自動で行い、主観的な解釈を完全に排除します。 このインジケーターは、すべての資産クラス(FX、株式、指数、商品、暗号通貨)およびM1から月足までのすべての時間軸で動作します。基本原理は「価格は出来高に従う」というものです。MERAVITHは機関投資家の出来高が集中するポイントを特定し、その集中から数学的に正確な価格レベルを導き出します。予測や投機は行わず、計算のみを行います。 MERAVITH SCANNERを使用すると、28の主要FX通貨ペアをすべての時間軸でわずか2~3分でスキャンできます。また、任意の市場をスキャンすることも可能です。例えば、約100銘柄の株式を約10分でスキャンできます。 インジケーターは、消耗レベル、均衡線、偏差、統計レベル、およびターゲット予測を算出します。 チャート要素 Origin Point :すべての計算が始まる起点です。イン
一言でいうと このインジケーターは RSI と MACD という2人の専門家を1つにまとめたもの です。2つのチャートを別々に見て判断する代わりに、両方が同意したときだけ「買い」または「売り」の矢印を表示します。 矢印は再描画されません 。一度出現すれば、そのまま固定されます。 「コンボ」の意味 通常、トレーダーは RSI(値動きの勢い)と MACD(トレンドの方向)を別々に見ます。しかし両者が矛盾することも多いです。 このインジケーターでは、 両方が同時に同意したときのみシグナル を出します。これにより、多くの偽シグナルが排除されます。 画面で見えるもの 価格チャートとは別のインジケーターウィンドウ 青と赤の矢印 —— そのまま使えるシグナル 拡大表示された MACD ヒストグラム(見やすく強調されている) RSI と MACD のラインも表示されるが、注目すべきは矢印 こんな人におすすめ 初心者 —— 2つのインジケーターを別々に解釈し、矛盾に対処する必要がない 経験者 —— シグナルの高速フィルタリングと、再描画しないクリアなロジック 迷いたくない人 —— 「買い」「売り」「待て
note: this indicator is for METATRADER4, if you want the version for METATRADER5 this is the link:  https://www.mql5.com/it/market/product/108106 TRENDMAESTRO ver 2.5 TRENDMAESTRO recognizes a new TREND from the start, he never makes mistakes. The certainty of identifying a new TREND is priceless. DESCRIPTION TRENDMAESTRO identifies a new TREND in the bud, this indicator examines the volatility, volumes and momentum to identify the moment in which there is an explosion of one or more of these da
MERAVITH は MetaTrader 5 向けのマルチタイムフレームの出来高・流動性インジケーターで、すべての時間足でトレンド、サポートとレジスタンスのゾーン、エントリー、ターゲット、ストップロスを表示します。市場の完全な流動性マップ、ヘッジファンド流の流動性ツールを提供し、独自の出来高加重平均価格の手法ですべての計算を自動で行うため、主観的な解釈はありません。 FX、ゴールド(XAUUSD)、指数、仮想通貨に対応し、すべての時間足で機能します。 購入後の特典:MERAVITH での取引方法を解説した動画レッスン集。購入後にメッセージをお送りください。 MERAVITH の機能 すべての時間足を分析し、それぞれで有効なトレンドを表示します。 流動性ゾーン(Volume Equilibrium)を示します。強気と弱気の出来高が等しくなる場所です。 すべての時間足の流動性レベルをチャート上に直接表示します。 参考用に市場のテキスト分析を書き出します。 現在のトレンドからエントリー、ターゲット、サポートレベル、ストップロスを計算します。 取引のリスクリワード比を計算します。 口座残高に
Cycles Plotter 移動平均と開始日を備えたカスタマイズ可能なサイクルインジケーター Cycles Plotter は、ユーザー入力のみに基づいて、完全にカスタマイズ可能な2つの正弦波サイクルを描画する高度なテクニカルインジケーターです。サイクルを自動生成しません。すべてのサイクルは、ユーザーが設定したパラメーターのみに基づいて計算され、価格の振動と潜在的なトレンド変化を研究するための視覚的ツールをトレーダーに提供し、自動シグナルや予測は生成しません。 重要なポイント: ユーザー定義のサイクル: サイクル 1 P1 と 2 P2 はユーザーが完全に設定できます。サイクルの長さ、振幅、移動平均、正確な開始日と時刻を設定できます。ユーザーがパラメーターを入力しない場合、サイクルは描画されません。 振幅の制御: 各サイクルは異なる振幅を持つことができ、基準となる移動平均に対して振動の高さを調整できます。 トレンド検出: 高速および低速移動平均はサイクルの方向を示します: Fast MA が Slow MA より大きい 上昇フェーズ 緑 lime Fast MA が Slow MA
AriX
Temirlan Kdyrkhan
1 (4)
AriX Indicator for MT5 A powerful trend-following and signal-evaluation tool AriX is a custom MT5 indicator that combines Moving Averages and ATR-based risk/reward logic to generate clear buy/sell signals. It visualizes dynamic SL/TP levels, evaluates past trade outcomes, and displays win/loss statistics in a clean on-chart panel. Key features include: Buy/Sell signals based on MA crossovers ATR-based SL/TP1/TP2/TP3 levels with visual lines and labels Signal outcome tracking with real-time stat
相場が本当は何をしているのかを見抜く。   3つの市場フェーズ(収縮・拡張・トレンド)を目の前でライブに捉え、トレンド・フェーズの初期段階でより優れたエントリーを取りましょう   。      当て推量はもう終わり。機関投資家やスマートマネーのように相場を読み始めましょう。   Apex Market Structure Pro(MT5版)は、ノイズを取り除き、あらゆるローソク足の下にある真の構造を見せる高精度のスマートマネー分析ツ   ールです。流動性、構造転換、蓄積ゾーン、トレンドバイアスを、ひとつのクリーンでプロフェッショナルなオーバーレイに集約します。遅行   指標に見切りをつけ、明晰さをもってトレードする準備のできた本気のトレーダーのために作られました。   重要:本インジケーターは Heikin Ashi(平均足)ローソク足での動作を前提に設計されています。使用前にチャートを Heikin Ashi   に設定し、その真価を解き放ってください。分析のすべては Heikin Ashi の価格の流れを軸に構築されています。Apex Market Structure Pr
Title:FX-AIEA Supply and Demand Zone Indicator (MT5) — Technical Overview Version: 2.51 | Platform: MetaTrader 5 Introduction Supply and demand zones are considered a core manifestation of institutional order flow, providing a more direct reflection of buying and selling pressure than traditional support/resistance levels. This indicator attempts to automate the identification of high-probability supply and demand zones using an adaptive ZigZag algorithm, reducing the subjectivity and time asso
ORB Seeker MT5
Marcela Goncalves De Oliveira
数量限定で特別価格!希少性を維持するための特別価格です! たったの599ドル! ご購入後、ボーナスとしてORB Seeker EAと個人最適化セットファイルをお受け取りいただくため、私にご連絡ください。 クリーンなセッションブレイクアウトを自信を持ってキャッチしましょう! ORB Seeker MT5は、正確性、シンプルさ、柔軟性、そして明確なチャート構造を求めるトレーダー向けに開発された、プロ仕様のオープニングレンジブレイクアウト(ORB)インジケーターです。 このシステムは、あらゆる銘柄のプレマーケットまたはカスタムセッションのレンジを自動的にプロットし、エントリー、ストップロス、テイクプロフィット、およびオプションの50%部分TPレベルを含む明確なブレイクアウトシグナルを提供します。すべての計算結果はリアルタイムでチャート上に表示されます。 ロンドンオープン、ニューヨークセッション、アジアセッション、または独自のカスタム市場時間帯で取引できます。ORB Seeker MT5は選択したセッション時間帯に合わせて調整されるため、市場レンジ、ブレイクアウトレベル、トレードレベルの位
Volume Arrow Signal Product Description Volume Arrow Signal is a smart trading indicator designed to help traders identify potential buy and sell opportunities using price action, volume behavior, and directional arrow signals. The indicator places clear arrows directly on the chart, making it easy to spot possible market reversals, trend continuations, and entry opportunities without spending hours analyzing charts manually. Whether you are trading Gold (XAUUSD) , Forex pairs, Indices, or Crypt
AriFocus - Non-Repainting Buy/Sell Signals AriFocus - one clear signal. AriFocus marks buy and sell signals directly on the chart and suggests a stop-loss level for each one. Every signal is confirmed on bar close and never repaints. - Buy/sell arrows, confirmed on bar close - Suggested stop-loss level for every signal - Trend band and candle coloring to show direction at a glance - 10 ready-made presets, or your own settings (14 calculation methods) - Pop-up, push and email alerts with entr
Footprint は、オーダーフロー(Order Flow)と出来高分析のためのインジケーターです。 クラスターレベルでの市場構造の特定、アクティビティの高い主要ゾーンの発見、そして設定ウィンドウを毎回開くことなくチャート上で直接フィルター操作を行うのに役立ちます。 Footprintインジケーターの機能 Bid x Ask、Deltaのクラスターチャート; チャート上のコントロールパネル; フィルター調整用のスライダー; Absorption; Initiative; Stacked Imbalances; Big Trades; dPOC / Dynamic Point of Control; Delta; サイドマーケットプロファイル; 累積デルタ(Cumulative Delta)。 主な利点 高密度のティックフローに対する高速な計算とデータ表示; チャート内管理 — 設定を開くことなく、主要モードとフィルターを直接切り替え可能; 重要な価格レベルとクラスターを強調するためのフィルタリング; シグナルの視覚的ハイライト:吸収、主導権、インバランス、大口取引; 日、週、または現
Zain Gold ScalpingV5
Ahmed Gamal Abdel Nasser Mohamed
Zain Gold Scalping V5 is a technical analysis indicator for MetaTrader 5 designed for Forex and Gold markets. It provides chart-based market information, trend analysis, signal conditions, and an on-screen dashboard to help traders analyze price movement across multiple timeframes. Main Features The indicator supports multiple timeframes, including M1, M5, M15, M30, H1 and higher timeframes. It can be used with Gold (XAUUSD), Forex currency pairs, indices and other supported instruments. The in
VTrende Pro
Andrii Diachenko
5 (1)
VTrende Pro - MTF indicator for trend trading with a display panel for MT5 *** Videos can be translated into any language using subtitles (video language - Russian) Although the signals of the VTrende Pro indicator can be used as signals of a full-fledged trading system, it is recommended to use them in conjunction with the Bill Williams TS. VTrende Pro is an extended version of the VTrende indicator. Difference between Pro version and VTrende: - Time zones - Signal V - signal 1-2 waves -    S
KenKem Master Volume Profiler - Brief Introduction A Display-only volume-profile cockpit for XAUUSD, BTCUSD and other liquid symbols. Draws profile structure, multi-timeframe flow, EMA trend and study-only setup markers. Places no orders. Not a signal service.  It maps where the market has actually traded and reads recent order flow, so you can see structure and lean at a glance.  What it shows: Master and local volume profiles (POC and value-area high/low) - the price shelves that matter. A liv
Navigator Equilibrium:市場のフェーズ、モメンタム、ピーク、ダイバージェンスをひとつのウィンドウで モメンタム・オシレーター、トレンドフィルター、ボラティリティ指標、ダイバージェンス・スキャナーを行き来する必要はもうありません。Navigator Equilibrium は、それらを色分けされたひとつのウィンドウにまとめました。モメンタムが強まっているのか弱まっているのか、どちらが主導権を握っているのか、相場がトレンド中なのか持ち合いなのか、そして価格とモメンタムがどこで食い違っているのかが、ひと目でわかります。 相場を明確に読み取りたい裁量トレーダーにも、整理されたドキュメント付きのバッファを必要とする EA 開発者にも向いています。 他との違い 上昇・下落だけではない、5つの状態を持つヒストグラム。 方向に加えて、モメンタムが強まっているのか、弱まっているのか、ピーク状態まで伸びきっているのかを色で示します。 相場環境を示すゼロライン。 色が変わり、相場がトレンド中か持ち合い中かを教えてくれます。 「誰が主導権を握っているか」がひと目でわかる。 ヒストグラムの棒
This indicator automatically detects internal & swing market structure, Fibonacci Retracement and Fibo Levels. Features Full internal & swing market structure labeling in real-time Fibonacci Retracement Fibonacci Levels After purchasing the indicator, the full source code is provided, and via indicator buffers it can be easily integrated into your Expert Advisors (EAs) for automated trading strategies.
Boom & Crash & PainX & GainX Ultimate Spike Detector Trade Spikes With Confidence — Not Guesswork Catching spikes should be one of the most profitable strategies in synthetic markets. But for most traders, it becomes one of the most frustrating. You enter too early… price goes against you. You wait for a spike… it never comes. You finally catch one… but don’t know whether to hold or close. You make profit… then give it all back because there’s no exit plan. This is exactly the problem the Ultim
Historical Similarity Matcher Indicator (HI.SI.MA) Try it free today — demo version now available!   https://www.mql5.com/en/market/product/167114 Overview The Historical Similarity Matcher is a technical analysis indicator for MetaTrader 5. It scans historical price data to find segments that show statistical similarity to a user-selected reference period on the chart.
OrderFlow Absorption – MT5用プロフェッショナル・デルタ&アブソープションシグナルインジケーター OrderFlow Absorptionで本物のオーダーフロー分析の力を解き放ちましょう。MetaTrader 5向けの究極のデルタヒストグラム&アブソープションシグナルインジケーターです。あらゆる価格変動の裏側で何が起きているのかを知りたいトレーダーのために設計されており、市場を動かす隠れた買い/売り圧力や吸収イベントを明らかにします。 特徴 デルタヒストグラムの可視化:   買い圧力・売り圧力を色分けされたヒストグラムで即座に表示。 アブソープションシグナル検出:   高度なロジックで強気・弱気の吸収イベントを特定し、反転の兆しを早期に通知。 チャートマーカー:   吸収シグナルをチャート上に直接マークし、視覚的に分かりやすく表示。 ポップアップアラート:   新しい吸収シグナルが出現した際にリアルタイムで通知。 カスタマイズ可能な閾値:   弱いシグナルを除外し、高確率のセットアップに集中。 リソース管理:   大きなチャートでも高速に動作する効率的な計算。
SMC Institutional Suite v3.7 Professional Smart Money Concept Indicator for MetaTrader 5 What is New in Version 3.7 - Visual Stability Update This release focuses entirely on one goal: making every zone, label, and line on your chart rock-solid stable. There is no more flickering, no more zones disappearing on a new candle, and no more duplicate drawings. Order Block (OB) zones no longer flicker or disappear. Once drawn, they stay permanently on the chart. Equal Highs and Equal Lows (EQH / EQL)
MasterTrend Indicator for MT5 A powerful trend-following and signal-evaluation tool MasterTrend   is a custom MT5 indicator that combines Moving Averages and ATR-based risk/reward logic to generate clear buy/sell signals. It visualizes dynamic SL/TP levels, evaluates past trade outcomes, and displays win/loss statistics in a clean on-chart panel. Key features include: Buy/Sell signals based on MA crossovers ATR-based SL/TP1/TP2/TP3 levels with visual lines and labels Signal outcome tracking wit
Volatility 75 Boom Crash VIX Pro V2 Volatility 75 Boom Crash VIX Pro V2 is a high-performance trading indicator specifically engineered for Synthetic Indices (Deriv) and Forex . This tool focuses on identifying institutional liquidity zones and generating high-accuracy, non-repainting signals based on Price Action and Fibonacci levels. Key Advantages: No Repainting: Once a signal arrow appears and the candle closes, it will never move or disappear. Institutional Liquidity Zones: Automatically ca
SMC Sweep Fvg MT5 — スマートマネーと同じ目線で、チャート上に市場を映す こんな経験はありませんか。価格がストップを巻き取り、反転し、まさに想定どおりの方向へ進む。方向は正しかった。間違えたのはエントリーだけです。 このインジケーターは、そうした場面を減らすために作られています。分析で最も重い部分——チャートのマークアップ——を引き受け、本当に重要な「判断」をあなたに残します。 チャートに表示されるもの マーケットストラクチャー — 実際の構造的高値・安値に HH / HL / LH / LL ラベルとレベルライン。トレンドが一目で分かり、推測は不要です。 インバランスゾーン(FVG) — 価格が急ぎ過ぎて通過し、後で戻りやすい領域。未埋めと既埋めのゾーンは別色で表示されます。 流動性の動き — 反転前に市場がレベルを巻き取る瞬間を追跡します。 トレード設計の完成形 — エントリー矢印、ストップロス、利益目標。すべて描画済みで、頭の中で計算する必要はありません。 トレンドフィルター — 上位足のラインで、主戦場の動きの側に立ち続けられます。 インジケーターは
作者のその他のプロダクト
Aurora EURUSD EA Aurora EURUSD EA   は、通貨ペア   EURUSD   のために特別に設計された高精度の自動売買システムです。 市場構造、ボラティリティの変化、価格モメンタムを適応的に分析し、安定した自動売買を実現するための洗練されたロジックを備えています。 本システムは、トレンド形成、レンジ相場、移行期など、さまざまな市場環境において一貫した動作を維持するよう設計されています。 過度なリスクを伴う手法(マーチンゲール、グリッド、ストップロスなしの取引)は一切使用せず、 リスク管理と安定性   を最優先にしています。 Aurora EURUSD EA は EURUSD の特性とリズムに最適化されており、流動性の高い市場での精密な動作を可能にします。 精度、安定性、そして現代的な技術基盤を重視するトレーダーに適した、プロフェッショナルな自動売買フレームワークです。 ️   技術パラメーター Aurora EURUSD EA は   EURUSD 専用   に設計されており、最適な動作タイムフレームは   M30、H1、H4   です。 シス
Aurora Gold EA MT4 Aurora Gold EA MT4 は、XAUUSD 専用に設計されたプレミアム自動売買システムであり、精度・安定性・一貫したパフォーマンスを求めるトレーダーのために開発されました。戦略は高度なアルゴリズムロジックと適応型マーケット分析を活用し、MetaTrader 4 環境向けに最適化されています。 EA は市場構造、ボラティリティサイクル、流動性ゾーン、モメンタム変化を継続的に評価し、高確率エントリーを特定します。リアルタイムで調整されるダイナミックロジックにより、強いトレンド、急激な価格変動、レンジ相場など、多くの MT4 EA が苦戦する状況にも賢く対応します。 リスク管理は Aurora Gold EA MT4 の中核要素です。すべての取引で、コントロールされたポジションサイズ、適応型ストップロス、極端な値動きへの保護を採用しています。マーチンゲール、グリッド、ノーストップロスなどの危険な手法は一切使用しません。 現代の市場環境と変動スプレッドに合わせて最適化されており、Aurora Gold EA MT4 はゴールドトレーダーに
Multi‑TF Arrow Dashboard is a fast and clean signal panel that instantly shows BUY/SELL direction across all major timeframes M1, M5, M15, M30, H1, H4, D1 . It measures trend strength using EMA and delivers clear, real‑time signals with zero delay. Works on all instruments, including forex pairs (EURUSD, GBPUSD, USDJPY) and metals (XAUUSD) . Maximum simplicity, maximum efficiency — perfect for scalping, intraday, and swing trading
️ Power Moving Average Signals 概要: Power Moving Average Signals は、2本の移動平均線(MA)—高速と低速—の交差に基づいたトレンドフォロー型のトレーディング戦略です。モメンタムの変化を捉え、明確な 買い・売りシグナル を生成します: 買いシグナル :高速MAが低速MAを上抜けしたとき 売りシグナル :高速MAが低速MAを下抜けしたとき 通貨ペアに最適化: この戦略は、特に 外国為替市場(FX) において優れたパフォーマンスを発揮します。トレンドが明確な相場で効果的に機能し、早期のエントリーと効率的なトレンド追従を可能にします。 ️ 推奨タイムフレーム: 5分足以上のチャート (M5、M15、H1など)での使用が推奨されます。ノイズが少なく、シグナルの信頼性が高まります。 主なメリット: シンプルで直感的なロジック 初心者から上級者まで幅広く対応 MetaTrader 5 プラットフォームに対応 複数の銘柄とタイムフレームで使用可能 ️ プロのヒント: ボラティリティフィルターや他の確認インジ
️ 一目均衡表システム(Ichimoku Kinko Hyo System) 正確かつ効率的な市場分析のためのインテリジェントツール このインジケーターは、信頼性の高い 一目均衡表(Ichimoku Kinko Hyo) の理論に基づいており、市場の構造・動向・価格の潜在的な動きを包括的に把握することができます。トレーダーが視覚的に素早く判断できるよう設計されています。 主な機能: 高精度な分析 – 複数の時間軸にわたる高度な市場分析 ️ 即時の市場把握 – 価格の方向性とシグナルの強さを明確に表示 視覚的なシグナル表示 – 緑色の上向き矢印は買い、赤色の下向き矢印は売りを示す ️ マルチタイムフレーム対応 – すべての時間軸でスムーズに動作 幅広い適用性 – 通貨ペア、商品、貴金属などに最適 推奨時間軸 – 5分以上 のチャートで最も効果を発揮 視覚的に明快な分析を重視するトレーダーに最適なツールであり、 精度・明瞭性・迅速な市場判断 をサポートします。
Clever Parabolic RSI Parabolic SAR と RSI を組み合わせた、賢くて正確なオシレーター このオシレーターは、人気の高い2つのテクニカル指標 — Parabolic SAR と RSI — を融合させたインテリジェントなシステムで、 市場の状態 、 トレンドの強さ 、そして 売買のタイミング を明確に視覚化します。 仕組み: 緑の四角いドット が表示されたら、 上昇トレンドの開始 を示します 赤の四角いドット は、 下降トレンドの開始 を示します 最初のドットの後に 同じ方向のドットが3つ 続きます — 3つ目のドットの後にエントリー するのが基本戦略です スクリーンショットでは、 トレンド転換から3本のローソク足以内に正確なシグナル が出現している様子が確認できます 戦略と活用法: 5分足以上 のタイムフレームで優れたパフォーマンスを発揮 FX通貨ペア、商品、株価指数、暗号資産 など幅広く対応 スキャルピング、デイトレード、スイングトレード に最適 Clever Parabolic
Power Market Strength Panel Pro – すべての主要インジケーターを1つのパネルに集約 Power Market Strength Panel は単なるインジケーターではありません。これは、複数の重要なテクニカル指標を組み合わせて、 自動で市場を分析する強力なトレーディングツール です。 含まれる主なインジケーター: EMA(指数平滑移動平均) – トレンドの方向を判断 ADX + DI+/- – トレンドの強さと買い/売り圧力を測定 RSI(相対力指数) – モメンタムと買われすぎ/売られすぎを検出 ATR(平均真の範囲) – 市場のボラティリティを表示 出来高(Volume) – 価格変動の強さを確認 どのように機能するのか: このインジケーターは、これらすべての情報を リアルタイムで自動収集・分析 し、 シンプルなシグナルシステム としてパネルに表示します: 緑 = STRONG BUY(強い買いシグナル) 赤 = STRONG SELL(強い売りシグナル) グレー = NEUTRAL(中立、様子見) あらゆる
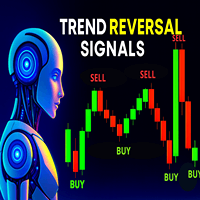
TREND REVERSAL SIGNALS – トレンド反転を正確に捉えるシグナル TREND REVERSAL SIGNALS は、トレンドの反転ポイントを高精度で検出するために設計された高度なインジケーターです。価格データ(OHLC)を分析し、反転を示す重要なローソク足パターンを認識します。プライスアクション、ボラティリティ(ATR)、市場構造を組み合わせることで、チャート上に明確な BUY / SELL シグナル を表示します。 分析の基盤: プライスアクション (OHLC) – ダブルトップ/ボトム、ヘッド&ショルダーなどの反転パターンを検出 ボラティリティ (ATR) – 動きの強さを測定し、偽のシグナルを排除 市場構造 – 高値・安値の推移を追跡し、トレンド方向を確認 テクニカル指標 – 移動平均線、RSI、MACD、ボリンジャーバンドを活用 出来高分析 – 突発的な出来高の増加に反応し、VWAP を参照レベルとして利用 トレーダーへの提供内容: 特定のローソク足に BUY/SELL シグナルを表示 すべての銘柄・タイムフレームに対応 デイトレードからスイ
AutoLevels ― サポート&レジスタンスの自動検出 AutoLevels は、リアルタイムのチャートデータに基づいて 重要な価格ゾーン を自動的に識別する高度なインジケーターです。 スイング高値・安値、マーケットのボラティリティ (ATR)、そして価格の繰り返し反応を分析し、信頼性の高いサポートとレジスタンスを検出します。 主な特徴: スイングポイント (Swing High / Low) を利用し、感度を調整可能 ATR によるゾーン幅の自動調整で、異なるボラティリティに対応 オプションで移動平均線を使ったトレンド確認 オプションで出来高分析を追加し、重要レベルを強化 ️ 動作原理: 価格が反応するポイントをグループ化し、明確なゾーンを形成 最低タッチ数 (MinTouches) に基づき、弱いレベルをフィルタリング チャート上にゾーンを可視化 ― タッチ回数が多いほどゾーンは強力 すべてのタイムフレームと全ての銘柄に対応 ― FX、株式、指数、暗号資産など。 トレーダーが手作業でラインを引かなくても、重要なレベルを素早く正確に把握できます。 「Aut
AutoLevelsPro —— 価格データを分析し、自動的に サポートとレジスタンスのゾーン を表示するインジケーターです。 特に 短期タイムフレーム に最適化されており、最も効果的なのは 15分足チャート です。 使用するデータ: High —— 各ローソク足の最高値 Low —— 各ローソク足の最安値 Close —— ATR計算に使用 各ローソク足のタイムスタンプでゾーンを正確に配置 ️ 分析の仕組み: スイングハイ/スイングローを検出 ATRを計算し、市場のボラティリティを測定してゾーン幅を決定 近いレベルをまとめてゾーン化 最低タッチ数に満たない弱いレベルを除外 データの取得元: 適用されたチャートの価格データ(選択したタイムフレームに従う) MetaTrader内蔵のATRインジケーター(タイムフレームに応じて動的に調整) 結果の読み方: 緑のゾーン = サポート 赤のゾーン = レジスタンス ゾーン内の数字 = タッチ回数(多いほど強力なレベル) ゾーン幅 = 市場の
Buyer Seller Balance Analyzer は、複数のタイムフレームにおける買い手と売り手の力を包括的に把握できます。 主なコンポーネント: Buyer/Seller Balance テーブル 買い手と売り手の比率を表示 M1 から MN1 までのタイムフレームをカバー 色分けされた値(緑 = 買い手、赤 = 売り手) 主要指標: Buyers (%) – 買い手の割合 Sellers (%) – 売り手の割合 ️ Balance – 買い手と売り手の差 Strength – トレンドの強さ (STRONG/MEDIUM/WEAK) Volume – 取引量の指標 (HIGH/normal) 追加機能: 移動平均線 (8, 21, 50, 100, 200) 水平線で示す現在価格 高い取引量の強調表示 シグナル解釈: 強いトレンド: Balance が大きく正(濃い緑) → 強い上昇トレンド Balance が大きく負(濃い赤) → 強い下降トレンド 反転: B
Buyer Seller Arrows – 自信を持ってトレード! すべてのタイムフレーム(M1 から MN1 まで)で、買い手と売り手の力を直感的に分析できる革新的なツールです。色分けされたパーセンテージと矢印によって、 市場のダイナミクスを瞬時に把握 できます。 主な機能: 緑の上向き矢印 = 買い手優勢 赤の下向き矢印 = 売り手優勢 各タイムフレーム (M1, M5, M15, M30, H1, H4, D1, W1, MN1) における パーセンテージ強度 カラーコード による素早い識別(鮮やかな緑と赤) 動作原理: 買い圧力と売り圧力のバランス を追跡 EMA と SMA を用いて強度を計算 リアルタイムでトレンドの優勢 を表示 理想的なエントリーとエグジットポイント を特定するサポート トレーダーに選ばれる理由: 非常に分かりやすいビジュアル – 複雑なチャート不要、純粋な市場の強さを表示 迅速な意思決定 – スキャルピングやスイングトレードに最適 完全にカスタマイズ可能 – 自分のトレードスタイルに合わせてパラメータを調整 他のインジケーターとの
MarketStrength Pro 市場でのあなたの優位性! 仕組み MarketStrength Pro は、4つの主要コンポーネントを使って市場の強さを分析します: Buy/Sell Pressure(買い/売り圧力) — 買い手と売り手の優勢を可視化、 Normalized Volume(正規化ボリューム) — 異常な出来高を検出、 Volatility Trend(ボラティリティトレンド) — ボラティリティとトレンド方向を統合、 SMA Trend Detection(SMA トレンド検出) — プロレベルのトレンドシグナルを提供。 コア技術 Candle Body Analysis(ローソク足実体分析) — 実体の大きさで市場の強さを測定、 Volume Normalization(出来高の正規化) — 現在の出来高を平均と比較、 ATR に類似したボラティリティ計算 — 正確なボラティリティ測定、 50期間 SMA — 信頼性の高いトレンド検出。 購入する理由 「他の人には見えない市場の強さが見える!」 主な3つのメリット マルチタイムフ
Histogram Volume (Custom) 明確で精度の高い出来高分析を行うための高度なインジケーター。 機能 現在の市場活動に基づく 買い圧力/売り圧力(Bull/Bear) を表示 リアルタイムの実際の出来高 を表示 買い手と売り手の強さを示す カラー・ヒストグラム を生成 直近 X 本のローソク足における 平均出来高 と偏差を追跡 全ての時間足で値を 正規化 (M1〜MN1 に対応) 主要な出来高統計を表示する ライブパネル を搭載 メリット 市場のどちら側が優勢かを即座に把握 異常な出来高増加や市場活動の変化を検出 強い値動きと弱い値動きを見分けるのに役立つ 全ての市場・時間足で動作 リペイントなし — 安定した信頼性の高い値 対象ユーザー デイトレーダーおよびスイングトレーダー 出来高分析 を取引システムに組み込みたいユーザー 市場活動を素早く視覚的に理解したいトレーダー まとめ Histogram Volume (Custom) は、 現在の出来高の強さ、その変化、そして市場の主導権がどちらにあるか を明確かつ正確に示します。
MarketPredict Pro – 高度な多層型マーケット分析システム   仕組み MarketPredict Pro は、6つの独立した分析レイヤーを組み合わせ、次のローソク足を高精度で予測します。   6つの分析レイヤー Buyers/Sellers Pressure   – 買い手と売り手の強さを測定 Trend Strength   – SMA(20) によるトレンド強度計算 Volatility   – ATR に類似した14期間のボラティリティモデル Market Pressure   – 直近5本のローソク足の累積市場圧力 Prediction Engine   – 多因子による次のローソク足予測 Real‑time Panel   – リアルタイム市場統計パネル   技術アルゴリズム   圧力計算モデル 出来高、方向性、価格変動を組み合わせた加重圧力分析。   統計的精度 STRONG シグナル:   82–87% NORMAL シグナル:   73–78% SIDEWAYS / UNCERTAIN:   65–70%  
短い説明 Ultimate Sniper Pro は、トレンド・ボラティリティ・流動性・Smart‑Money ロジックを一つの精密なエントリーに統合したプロ仕様のトレードシステムです。 マーチンゲールなし、ランダム性なし —— 純粋な技術力と厳格なリスク管理のみ。 詳細説明 Ultimate Sniper Pro は、精度・安定性・プロフェッショナルなロジックを求めるトレーダーのために設計された次世代型エキスパートアドバイザーです。 本EAは複数の側面から市場を分析します: • トレンド構造(EMA 50/200) • ボラティリティとローソク足の強さ(ATR、実体優位、ヒゲ分析) • Smart Money Concepts(オーダーブロック、FVG、公正価値ギャップ、流動性狩り) • ボラティリティスクイーズ(ボリンジャーバンド + ケルトナーチャネル) • 弱いシグナルを排除し、高確率セットアップのみを取引するスコアリングシステム 危険な手法は一切使用しません: マーチンゲールなし グリッドなし ナンピンなし 隠れた戦略なし 実際の市場行動に基づく透明
Aurora Gold EA Aurora Gold EA は、 XAUUSD(ゴールド) 専用に設計された高品質な自動売買システムであり、現代のボラティリティが高いゴールド市場において、精度・安定性・一貫したパフォーマンスを求めるトレーダーのために開発されています。 本EAは高度なアルゴリズムロジックと自動適応型マーケット分析を用いて、ゴールド特有の価格挙動を最大限に活用します。 EA は市場構造、ボラティリティサイクル、流動性ゾーン、モメンタム変化を継続的に評価し、高確率のエントリーポイントを特定します。 リアルタイムで調整される動的ロジックにより、強いトレンド、急激な価格変動、レンジ相場といった多くのEAが苦戦する環境にも柔軟に対応します。 リスク管理は Aurora Gold EA の中核です。 すべての取引において、厳格なポジションサイズ管理、自動調整型ストップロス、極端な相場変動への保護機能を備えています。 また、マーチンゲール、グリッド、ノーストップロス取引などの高リスク手法は一切使用しません。 現代の取引環境や変動スプレッドに最適化された Aurora Gold
Aurora EURUSD EA Aurora EURUSD EA は、通貨ペア EURUSD のために特別に設計された高精度の自動売買システムです。 市場構造、ボラティリティの変化、価格モメンタムを適応的に分析し、安定した自動売買を実現するための洗練されたロジックを備えています。 本システムは、トレンド形成、レンジ相場、移行期など、さまざまな市場環境において一貫した動作を維持するよう設計されています。 過度なリスクを伴う手法(マーチンゲール、グリッド、ストップロスなしの取引)は一切使用せず、 リスク管理と安定性 を最優先にしています。 Aurora EURUSD EA は EURUSD の特性とリズムに最適化されており、流動性の高い市場での精密な動作を可能にします。 精度、安定性、そして現代的な技術基盤を重視するトレーダーに適した、プロフェッショナルな自動売買フレームワークです。 ️ 技術パラメーター Aurora EURUSD EA は EURUSD 専用 に設計されており、最適な動作タイムフレームは M30、H1、H2、H3、H4 です。 システムの中心となるロジックは移
EMA Crossover Ultra EA EMA Crossover Ultra EA は、妥協のない最高パフォーマンスを求めるトレーダーのために設計された高性能自動売買システムです。 インテリジェントな EMA(指数平滑移動平均)クロスと高度なボラティリティフィルターを組み合わせ、強力なトレンドを外科的精度で捉えます。 本EAは H4、M20、M30、M5、H1 に最適化されており、取引頻度とシグナル品質の完璧なバランスにより、最も安定した正確なパフォーマンスを発揮します。 反応速度が速く、攻撃的にエントリーしつつ、リスクはしっかりコントロール。市場から最大限の利益を引き出したいトレーダーに最適です。 ️ 主な特徴 • 自動適応フィルタを備えた高度な EMA クロスエンジン • 動的 SL/TP による自動リスク管理 • H4、M20、M30、M5、H1 に最適化 • 攻撃的でありながら安定したパフォーマンス • 低スプレッドの ECN 口座で最高の結果 最も高いパフォーマンスを発揮するタイムフレーム • H4 – 最も安定し、精度の高い結果 • M20 –
MT5 Multiframe Signal is a sleek and powerful dashboard indicator built for MetaTrader 5. It instantly displays BUY/SELL direction across all major timeframes — M1, M5, M15, M30, H1, H4, D1 — using advanced EMA‑based trend analysis. The panel delivers real‑time, zero‑delay signals with precise strength measurement and clean visual layout. Works flawlessly on all instruments, including forex pairs (EURUSD, GBPUSD, USDJPY) and metals (XAUUSD) . Maximum clarity, maximum performance — ideal for s
XAUUSD EA Crossover EMA — a precision‑engineered trading expert for MetaTrader 5. It identifies EMA crossover signals on gold (XAUUSD) with real‑time accuracy, combining trend strength analysis and instant BUY/SELL execution logic . Designed for traders who demand speed, clarity, and premium performance. Would you like me to craft a short Market promo version or a multilingual description set next?
フィルタ:
レビューなし
レビューに返信