Gioteen Volatility Index
- インディケータ
-
Farhad Kia
 I have extensive experience as an algo-trader and a skilled MT4/5 tool developer. I have created over 1000 EAs, indicators, and scripts for MT4/5, and have won several Forex contests. Apart from programming, I also possess valuable expertise as a successful algo-trader, which allows me to provide
 - バージョン: 1.0
- アクティベーション: 5
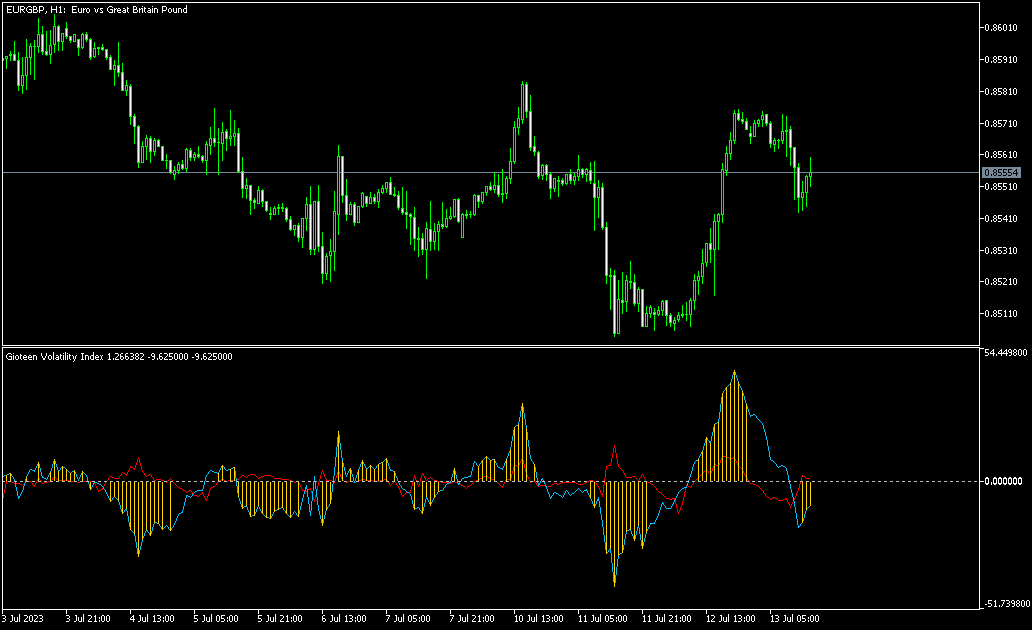
Gioteen Volatility Index (GVI) - your ultimate solution to overcoming market unpredictability and maximizing trading opportunities. This revolutionary indicator helps you in lowering your losing trades due to choppy market movements.
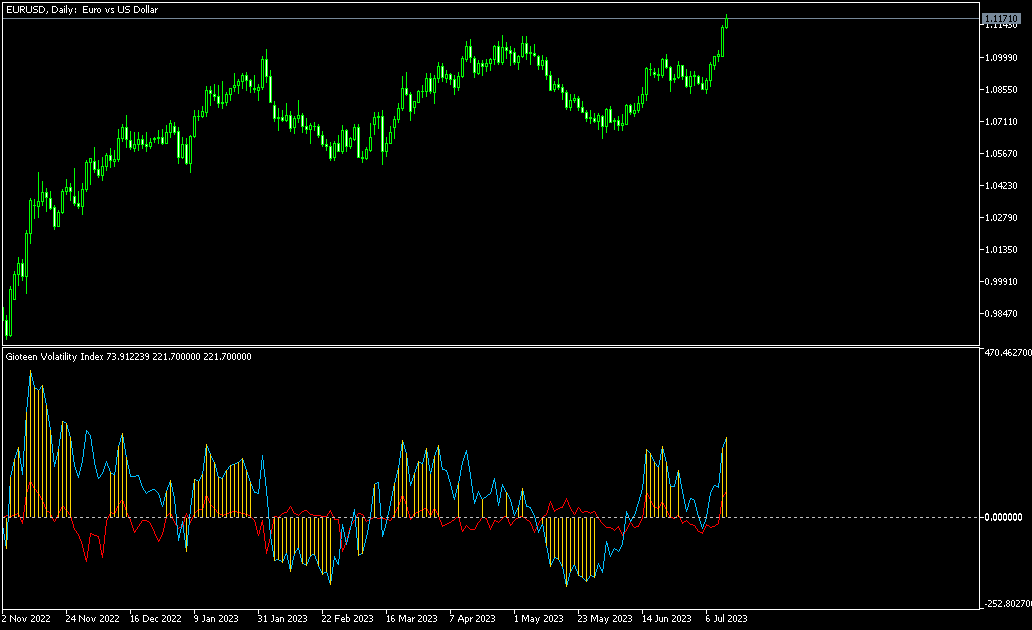
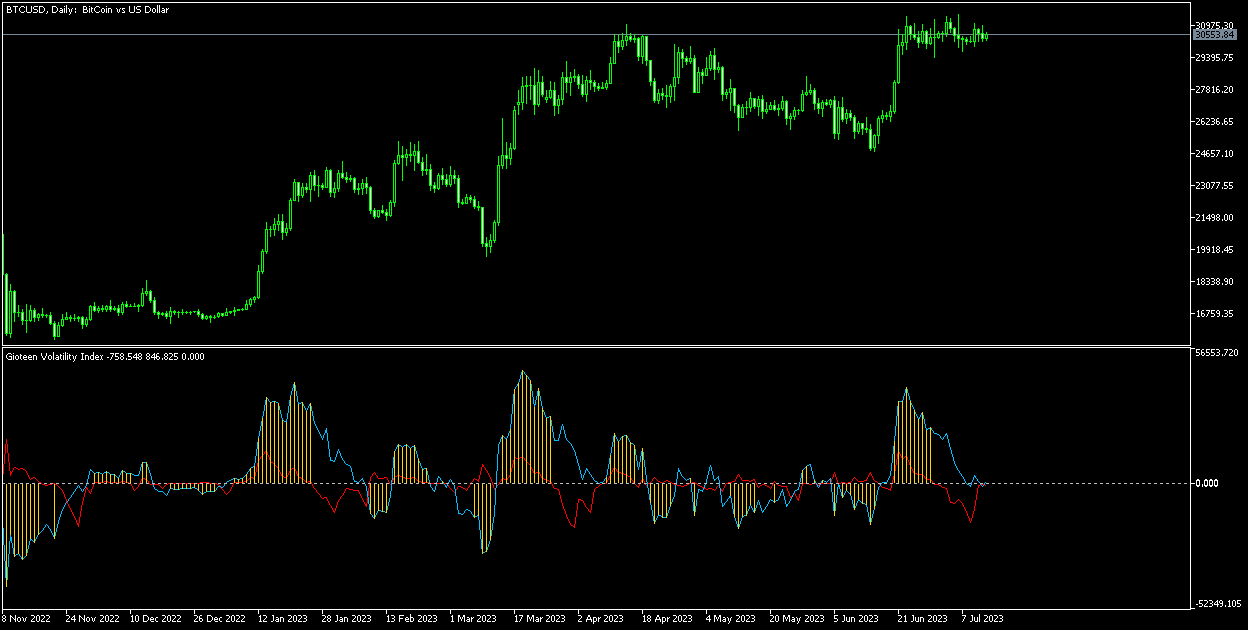
The GVI is designed to measure market volatility, providing you with valuable insights to identify the most favorable trading prospects. Its intuitive interface consists of a dynamic red line representing the volatility index, accompanied by blue line that indicate the market direction.
When the red line falls below 0, it signals a NO trade zone, cautioning you to avoid trading during this period. The blue line illustrates the trend, with values above zero indicating an uptrend.
Additionally, the GVI leverages yellow bars to provide key trading signals. By assessing the size of the yellow bar, you can filter and identify strong trends. The larger the bar, the stronger the trend it represents. In the absence of a yellow bar, the NO trade zone is indicated, suggesting you consider closing any open positions.
The beauty of the Gioteen Volatility Index lies in its simplicity. There are no complicated settings to configure; simply attach it to your chart, and you're ready to harness its power. It's a hassle-free solution that allows you to focus on what truly matters: making good trades.
Furthermore, the GVI enables you to analyze your past trades, providing valuable insights into how it can help improve your results. By reviewing historical data alongside the GVI's signals, you can refine your trading strategies and optimize your decision-making process.
Th Gioteen Volatility Index is a must-have tool for professional traders seeking to enhance their trading systems. It seamlessly adapts to any time frame, market, or trading style, making it the ultimate indicator that will elevate your trading to new heights.
Don't let market volatility hinder your success. Embrace the Gioteen Volatility Index and unlock a world of better trading opportunities like never before.