Point Directions
- インディケータ
- バージョン: 1.50
- アップデート済み: 26 9月 2025
- アクティベーション: 10

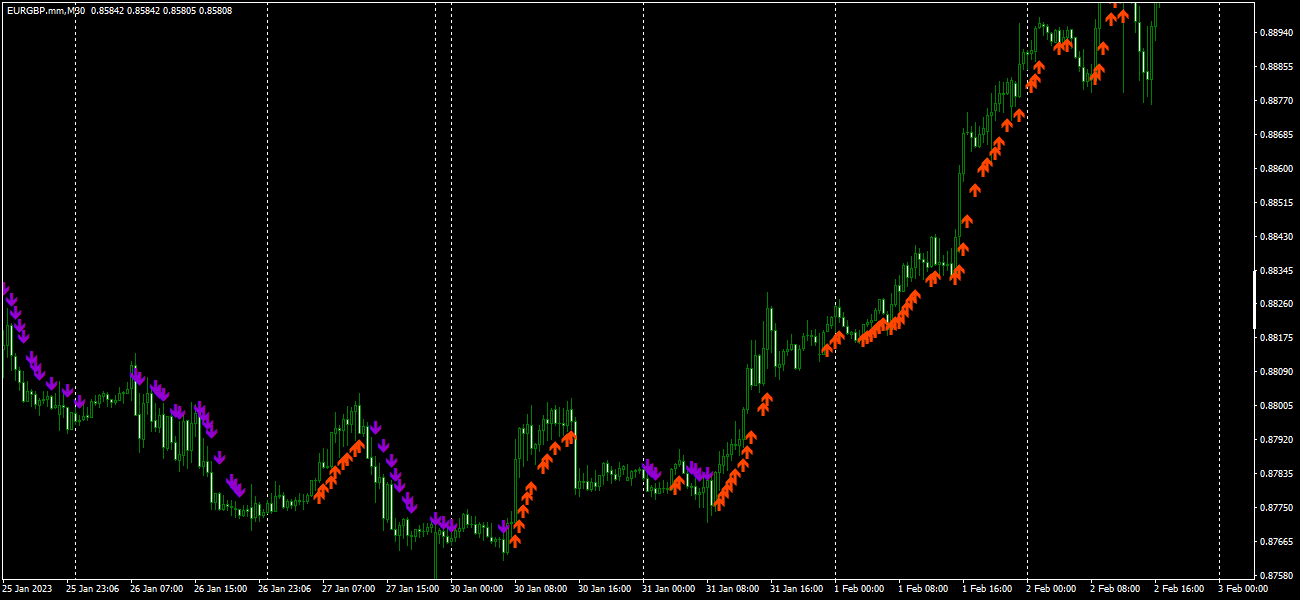
Point Directions - 価格変動時のポイント・サポートレベルとレジスタンスレベルを表示するインジケーターです。矢印は、指定された方向への価格反発を示します。
矢印は再描画されず、現在のローソク足上に形成されます。すべての時間枠と取引商品で機能します。複数の種類のアラートが用意されています。
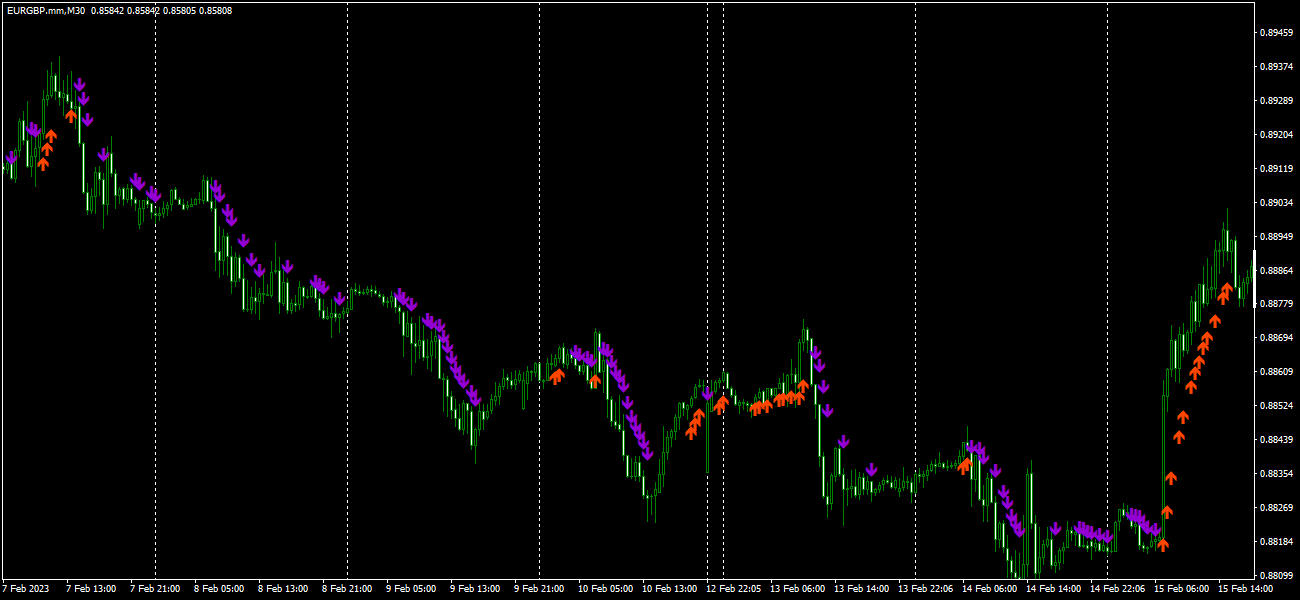
あらゆるチャートに合わせてシグナルをカスタマイズするための高度な設定を備えています。トレンド取引と調整取引の両方に対応しています。
矢印をプロットするには、2種類の移動平均線と矢印の強度レベルがあります。詳細な設定は入力パラメータに記載されています。
使用方法に関するご質問は、プライベートメッセージをお送りください。
入力パラメータ
矢印は再描画されず、現在のローソク足上に形成されます。すべての時間枠と取引商品で機能します。複数の種類のアラートが用意されています。
あらゆるチャートに合わせてシグナルをカスタマイズするための高度な設定を備えています。トレンド取引と調整取引の両方に対応しています。
矢印をプロットするには、2種類の移動平均線と矢印の強度レベルがあります。詳細な設定は入力パラメータに記載されています。
使用方法に関するご質問は、プライベートメッセージをお送りください。
入力パラメータ
- Method MA - 矢印を生成するために移動平均線を使用するかどうかを選択します(標準または加速)。
- Accelerated MA period/Standard MA period - 移動平均線期間を変更します(5~500)。
- Ma Metod - 移動平均線方式を変更します。
- Ma Price - 移動平均線価格を変更します。
- Arrow Intensity - 矢印の強度(値の増加に伴い強度が増します)。
- Arrow thickness - 矢印の太さ
- Sell arrow color/Buy arrow color - 矢印の色
- play sound / display message / send notification / send email - シグナルポイントが発生した際にアラートを使用します。
- Sound file signal arrows - シグナル矢印のサウンドファイル。

ITS GREAT Product Its Arrow Gives siganal like magic