• 概要
  • レビュー (6)
  • コメント
  • 最新情報

Tops and Bottoms Indicator

4.8

Tops & Bottoms Indicator FREE


Tops abd Bottoms:  An effective indicator for your trades


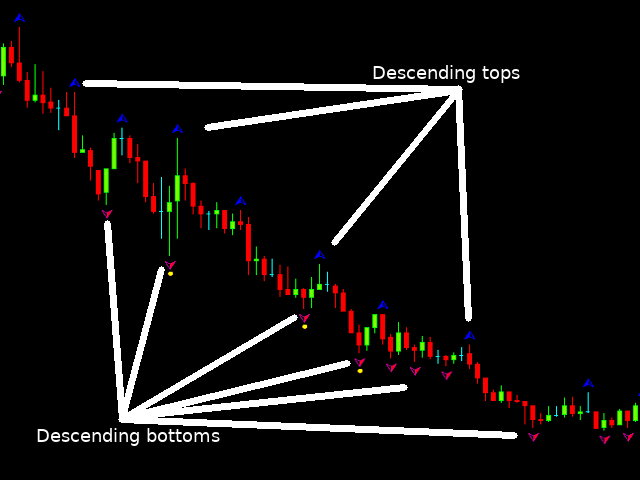
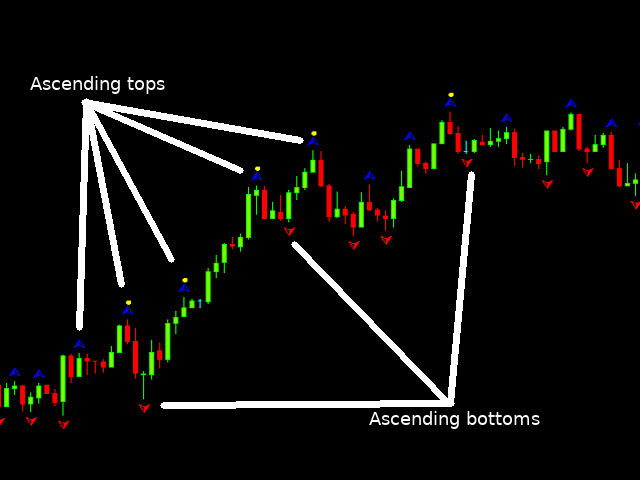
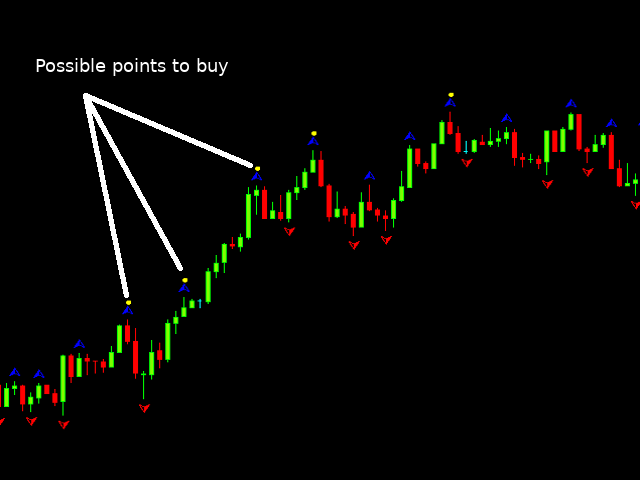
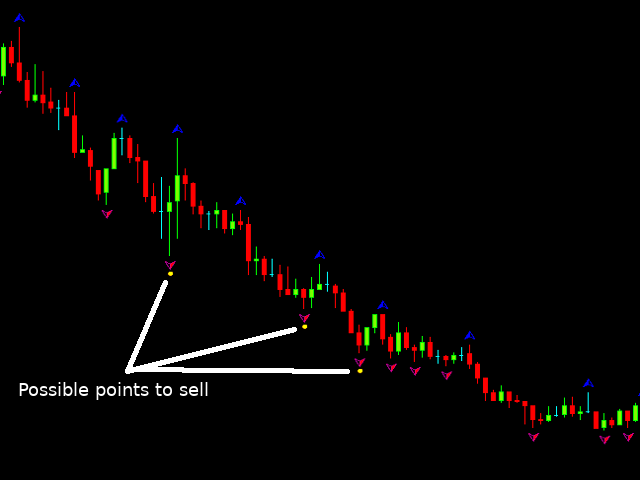
The tops and bottoms indicator helps you to find  ascending and descending channel formations with indications of ascending and/or descending tops and bottoms. In addition, it  show possibles  opportunities with a small yellow circle when the indicator encounters an impulse formation.


This indicator provide to you  more security and speed in making entry decisions.

Also test our FREE advisor indicator:    https://www.mql5.com/en/market/product/53448

Also test our  FREE Probabilistic Analysis indicator:    https://www.mql5.com/en/market/product/53669

Try our EA ToolBot for free: https://www.mql5.com/en/market/product/52347#!tab=overview


NOTE: This indicator does not guarantee profits or make promises of gain, it only provides information that helps the trader to make a better decision.

Inputs

  • Bounce in Pips - Number of pips between the ends to consider the entry valid.
レビュー 6
Clemildes Horta
232
Clemildes Horta 2023.10.09 00:49 
 

Excelente indicador! Obrigado por partilhar!

leruaites
16
leruaites 2023.09.29 15:16 
 

Muito bom.

Airton Oliveira
40
Airton Oliveira 2021.10.14 22:08 
 

Já estava procurando um indicador de topos e fundos há muito tempo, está me ajudando muito. Obrigado.

おすすめのプロダクト
Follow The Line MT5
Oliver Gideon Amofa Appiah
4.38 (29)
This indicator obeys the popular maxim that: "THE TREND IS YOUR FRIEND" It paints a GREEN line for BUY and also paints a RED line for SELL. (you can change the colors). It gives alarms and alerts of all kinds. IT DOES NOT REPAINT and can be used for all currency pairs and timeframes. Yes, as easy and simple as that. Even a newbie can use it to make great and reliable trades. NB: For best results, get my other premium indicators for more powerful and reliable signals. Get them here: https://www.m
FREE
What is this indicator? このインジケーターはMT5のFX検証ソフト「 Knots Compositor 」の 全てのチャートモードに対応したMACD です。 どのチャートモードでも、 チャートに表示されているローソク足で計算して表示します 。 Types of the applied price - Close - Open - High - Low - Median Price (HL/2) - Typical Price (HLC/3) - Weighted Price (HLCC/4) KC-Indicators -   KC-MA   (移動平均線) -   KC-ENV   (エンベロープ) -   KC-BB   (ボリンジャーバンド) -   KC-ADX   (Average Directional Movement Index) -   KC-MACD   (Moving Average Convergence/Divergence) -   KC-RSI   (Relative Strength Index) -   KC-S
FREE
Free automatic Fibonacci is an indicator that automatically plots a Fibonacci retracement based on the number of bars you select on the BarsToScan setting in the indicator. The Fibonacci is automatically updated in real time as new highest and lowest values appears amongst the selected bars. You can select which level values to be displayed in the indicator settings. You can also select the color of the levels thus enabling the trader to be able to attach the indicator several times with differe
FREE
Donchian Channel is an indicator created by Richard Donchian. It is formed by taking the highest high and the lowest low of the last specified period in candles. The area between high and low is the channel for the chosen period. Its configuration is simple. It is possible to have the average between the upper and lower lines, plus you have alerts when price hits one side. If you have any questions or find any bugs, please contact me. Enjoy!
FREE
The Penta-O is a 6-point retracement harmonacci pattern which usually precedes big market movements. Penta-O patterns can expand and repaint quite a bit. To make things easier this indicator implements a twist: it waits for a donchian breakout in the right direction before signaling the trade. The end result is an otherwise repainting indicator with a very reliable trading signal. The donchian breakout period is entered as an input. [ Installation Guide | Update Guide | Troubleshooting | FAQ | A
FREE
Are you tired of drawing trendlines every time you're analyzing charts? Or perhaps you would like more consistency in your technical analysis. Then this is for you. This indicator will draw trend lines automatically when dropped on a chart. How it works Works similar to standard deviation channel found on mt4 and mt5. It has 2 parameters: 1. Starting Bar 2. Number of bars for calculation The   starting bar   is the bar which drawing of the trend lines will begin, while the   number of bars for c
FREE
Important Lines
Terence Gronowski
4.88 (26)
This indicator displays Pivot-Lines, preday high and low, preday close and the minimum and maximum of the previous hour. You just have to put this single indicator to the chart to have all these important lines, no need to setup many single indicators. Why certain lines are important Preday high and low : These are watched by traders who trade in a daily chart. Very often, if price climbs over or falls under a preday low/high there is an acceleration in buying/selling. It is a breakout out of
FREE
The indicator is based on Robert Miner's methodology described in his book "High probability trading strategies" and displays signals along with momentum of 2 timeframes. A Stochastic oscillator is used as a momentum indicator. The settings speak for themselves period_1 is the current timeframe, 'current' period_2 is indicated - the senior timeframe is 4 or 5 times larger than the current one. For example, if the current one is 5 minutes, then the older one will be 20 minutes The rest of the
FREE
Forex Indicator Arrows is an arrow Indicator used as an assistant tool for your trading strategy. The indicator analyzes the standard deviation of bar close for a given period and generates a buy or sell signals if the deviation increases. It good to combo with Martingale EA to follow Trend and Sellect Buy Only/Sell Only for EA work Semi-Automatic. You can use this  Indicator with any EAs in my Products.
FREE
This indicator analyzes price action patterns and helps you to make positive equity decisions in the binary options market. [ Installation Guide | Update Guide | Troubleshooting | FAQ | All Products ] Easy to trade Trade both call and put options No crystal ball and no predictions The indicator is non-repainting The only strategy suitable for binary options is applying a mathematical approach, like professional gamblers do. It is based on the following principles: Every binary option represents
FREE
Introduction The Bounce Zone indicator is a cutting-edge non-repainting technical tool built to identify key areas on the price chart where market sentiment is likely to cause a significant price reversal. Using advanced algorithms and historical price data analysis, this indicator pinpoints potential bounce zones. Combined with other entry signal, this indicator can help forex traders place the best trades possible Signal A possible buy signal is generated when price is in the green zo
FREE
This indicator is an automated version of the Fibonacci retracement (Fib) indicator. Deciding the best areas to use when drawing the fib can be tricky and this  indicator was made with that in mind. When you drop it on the chart it will automatically choose the best points to draw the fib with, but in case you aren't satisfied with those regions, you can adjust it as you wish.
FREE
Trend Fibonacci is a unique indicator that combines a power of Fibonacci sequences and ranges. How to read: - There are three zones --> red, gold and green - Red candlestick = downtrend - Green candlestick = uptrend   - Gold candlestick = no established trend Inputs: Per = number of bars used for calculations FirstRatio = first Fibonacci ratio (Or use any ratio you want) SecondRatio = second Fibonacci ratio (Or use any ratio you want) !! IF YOU PURCHASE THE INDICATOR, CONTACT ME FOR
FREE
Value Chart Candlesticks
Flavio Javier Jarabeck
4.75 (8)
The idea of a Value Chart indicator was presented in the very good book I read back in 2020 , " Dynamic Trading Indicators: Winning with Value Charts and Price Action Profile ", from the authors Mark Helweg and David Stendahl. The idea is simple and the result is pure genius: Present candlestick Price analysis in a detrended way! HOW TO READ THIS INDICATOR Look for Overbought and Oversold levels. Of course, you will need to test the settings a lot to find the "correct" one for your approach.
FREE
The indicator identifies when a divergence occurs between price and an indicator or oscillator. It identifies both regular and hidden divergences. Combined with your own rules and techniques, this indicator will allow you to create (or enhance) your own powerful system. Features Can detect divergences for the following oscillators/indicators:   MACD, OsMA, Stochastics, RSI, CCI, RVI, Awesome, ADX, ATR, OBV, Composite index, MFI and Momentum. Only one oscillator/indicator can be selected. Draws
FREE
Introduction Reversal Candles is a cutting-edge non-repainting   forex indicator designed to predict price reversals with remarkable accuracy through a sophisticated combination of signals. Signal Buy when the last closed candle has a darker color (customizable) and an up arrow is painted below it Sell when the last closed candle has a darker color (customizable) and a down arrow is painted above it
FREE
Donchian Channel DC is the indicator of Donchian Channels, that plots maximum and minimum values of a specific period, besides mean value line. It´s possible to configure simple period for analysis and the indicator will plot all three values. You can trade with this indicator as trend or reversal, according to each strategy. Do not let to test others indicators as soon as others expert advisors.
30 USD
Rainbow MT5
Jamal El Alama
4.33 (3)
Description : Rainbow MT5 is a technical indicator based on Moving Average with period 34 and very easy to use. When price crosses above MA and MA changes color to green, then this is a signal to buy. When price crosses below MA and MA changes color to red, then this is a signal to sell. The Expert advisor ( Rainbow EA MT5 ) based on Rainbow MT5 indicator is now available here . MT4 version is available here .
FREE
Best SAR MT5
Ashkan Hazegh Nikrou
5 (1)
説明 :  外国為替市場(PSAR)で専門的で人気のあるインジケーターの1つに基づいた新しい無料インジケーターをご紹介します。このインジケーターは元のパラボリックSARインジケーターの新しい変更です。プロSARインジケーターでは、ドットと価格チャートのクロスオーバーを見ることができます。クロスオーバーはシグナルではありませんが、動きの終わりの可能性について話します。新しい青いドットで購入を開始し、最初の青いドットの1 atr前にストップロスを配置し、最後にドットが価格チャートを横切るとすぐに終了できます。 売買シグナルを開く方法は? 最初の青い点によるオープンバイトレードと最初の赤いドットによるオープンセルトレード 正しいストップロスはどこにありますか? 安全なストップロスは最初のドットにある可能性があります(最初の青いドットの買いの場合と最初の赤い点の売りの場合) 正しいテイクプロフィットはどこにありますか? テイクプロフィットはストップロス距離とRRに基づいて調整できるので、私の提案は2 RRで、ストップロスの2倍です。 利益を上げているのにtpを達成でき
FREE
About the indicator: DALA Forecast is a universal tool for predicting the dynamics of time series of any nature. For prediction, modified methods of nonlinear dynamics analysis are used, on the basis of which a predictive model is built using machine learning methods.  To get the trial version of the indicator, you can contact me in private messages. How to use the indicator: Apply the indicator to your chosen financial instrument or indicator with the settings you need. The prediction will b
FREE
This is a buyer and seller aggression indicator that analyzes the shape of each candle and project this data in a histogram form. There are 4 histograms in one. On the front we have two: Upper - Buyer force. Lower - Seller force. At the background we also have two histogram, both with same color. They measure the combined strenght of buyers and sellers. This histograms can be turned off in Input Parameters. It is also possible to have the real or tick volume to help on this force measurement. IN
FREE
This indicator is especially for the binary trading. Time frame is 1 minutes and exp time 5 or 3 minutes only. You must be use martingale 3 step. So you must put lots size is 10 % at most. You should use Mt2 trading platform to connect with my indicator to get more signal without human working. This indicator wining rate is over 80% but you may get 100% of profit by using martingale 3 step. You should use MT2 Trading Platform to connect meta trader platform and binary platform . You can get mt2
FREE
This indicator finds Three Drives patterns. The Three Drives pattern is a 6-point reversal pattern characterised by a series of higher highs or lower lows that complete at a 127% or 161.8% Fibonacci extension. It signals that the market is exhausted and a reversal can happen. [ Installation Guide | Update Guide | Troubleshooting | FAQ | All Products ] Customizable pattern sizes Customizable colors and sizes Customizable breakout periods Customizable 1-2-3 and 0-A-B ratios It implements visua
FREE
チャート上にフィボナッチレベルを手動で描画することにうんざりしていませんか?取引における主要なサポートとレジスタンスのレベルを特定する便利で効率的な方法をお探しですか?これ以上探さない! 自動 フィボナッチ レベル を実行する究極の MetaTrader 5 インジケーターである DrawFib Pro の紹介   チャート上に描画し、これらのレベルを突破したときにタイムリーにアラートを提供します。 DrawFib Pro を使用すると、取引戦略を強化し、時間を節約し、より多くの情報に基づいた意思決定を行うことができます。 私のフィボナッチベースのインジケーター:   Advanced Gartley Pattern MT5   ||    Price Wave Pattern MT5 主な特徴: 自動 フィボナッチ描画. カスタマイズ可能な パラメータ . 正確 で 信頼性. リアルタイム アラート. ユーザー フレンドリーな インターフェイス . DrawFib Pro は、チャート上でフィボナッチを自動描画するための効率的で信頼性が高く、使いやすい方法を求めるトレーダーにとって
FREE
Combining the best of Price Action , Directional Movement , and Divergence/Convergence analysis, Candle Color Trend is a easy and reliable way to identify trend direction. The indicator automatically paints the candles according to the assumption that an uptrend is defined by prices that form a series of higher highs and higher lows. In contrast, a downtrend is defined by prices that form a series of lower highs and lower lows. Additionally, ADX Wilder indicator is used to measure trend weakness
FREE
Tired of plotting trendlines? The PZ TrendLines MT5 indicator applies a mechanical approach to the construction of trend lines for you!  [ Installation Guide | Update Guide | Troubleshooting | FAQ | All Products ] It can draw up to 18 trendlines Trendlines can be optionally based on fractals Each line represents a breakout level Each trendline can be broken or rejected Configurable amount of lines Configurable colors Support I am happy to provide free products but given my limited time, they com
FREE
True Day
Aurthur Musendame
5 (1)
True Days is a tool designed specifically for the trader who wants to catch intraday volatility in price charts.  True day makes it easier for the trader to avoid trading in the dead zone - a period in time where markets are considered dead or non volatile. The trader can concentrate on finding opportunities only during periods of profound market movements. By default the indicator gives you a true day starting at 02:00 to 19:00 hours GMT+2. You can adjust according to your Time Zone. By deafult
FREE
Introduction This indicator detects volume spread patterns for buy and sell opportunity. The patterns include demand and supply patterns. You might use each pattern for trading. However, these patterns are best used to detect the demand zone (=accumulation area) and supply zone (=distribution area). Demand pattern indicates generally potential buying opportunity. Supply pattern indicates generally potential selling opportunity. These are the underlying patterns rather than direct price action. T
FREE
This indicator studies price action as an aggregation of price and time vectors, and uses the average vector to determine the direction and strength of the market. This indicator highlights the short-term directionality and strength of the market, and can be used to capitalize from short-term price movements by trading breakouts or binary options.  [ Installation Guide | Update Guide | Troubleshooting | FAQ | All Products ] Find market direction easily Confirm with breakouts or other indicators
FREE
This indicator displays pivot points in the chart, including historical vales, and supports many calculation modes for Pivot Points and S/R levels. [ Installation Guide | Update Guide | Troubleshooting | FAQ | All Products ] It plots historical levels for backtesting purposes It allows you to select the reference timeframe It implements different Pivot Point calculation modes It implements different SR calculation modes It implements customizable colors and sizes Calculation Modes The indi
FREE
このプロダクトを購入した人は以下も購入しています
ご紹介   クォンタム トレンド スナイパー インジケーターは 、トレンド反転を特定して取引する方法を変革する画期的な MQL5 インジケーターです。 13年以上の取引経験を持つ経験豊富なトレーダーのチームによって開発されました。     クォンタムトレンドスナイパーインジケーター   は、非常に高い精度でトレンドの反転を識別する革新的な方法で、あなたのトレーディングの旅を新たな高みに押し上げるように設計されています。 ***Quantum Trend Sniper Indicatorを購入すると、Quantum Breakout Indicatorを無料で入手できます!*** クォンタム ブレイクアウト インジケーターは、トレンドの反転を特定するとアラートを発し、矢印を示し、3 つのテイクプロフィットレベルを提案します。 初心者トレーダーにもプロのトレーダーにも適しています。 量子EAチャネル:       ここをクリック MT4のバージョン:       ここをクリック 推奨事項: 期間:すべての時間枠。最良の結果を得るには、M
149.99 USD
Description: First of all Its worth emphasizing here that this Trading System is Non-Repainting, Non-Redrawing and Non-Lagging Indicator, Which makes it ideal from both manual and robot trading.  For limited time only 50% OFF, Now 149$ Next price 300$. The user manual in the form of detailed blog, free online course and downloadable presets of the smart trend trading system are all  here . Join our Free Group and stay up-to-date on the Best Indicators and Experts:   Here The “Smart Trend Tra
149 USD
トレンド スクリーナー インジケーターでトレンド取引の力を解き放ちます。ファジー ロジックと複数通貨システムを活用した究極のトレンド取引ソリューションです。 ファジー ロジックを活用した革新的なトレンド インジケーターである Trend Screener を使用して、トレンド取引を向上させます。 これは、13 を超えるプレミアム ツールと機能、および 3 つの取引戦略を組み合わせた強力なトレンド追跡インジケーターであり、Metatrader をトレンド アナライザーにする多用途の選択肢となります。 期間限定オファー : トレンド スクリーナー インジケーターは、わずか 50 ドルで生涯ご利用いただけます。 (元の価格 125$ ) (オファー延長) Trend Screener の 100% 非再描画精度の揺るぎない精度を体験して、取引の決定が過去の価格変動の影響を受けないようにしてください。 マルチタイムフレームおよびマルチ通貨機能の多用途性を解放し、比類のない自信を持って外国為替、商品、暗号通貨、インデックスの世界を取引できるようにします。 Trend Screener の包括的な
50 USD
Gold Stuff mt5
Vasiliy Strukov
4.88 (154)
Gold Stuff mt5 は、金専用に設計されたトレンド指標であり、あらゆる金融商品にも使用できます。 インジケーターは再描画せず、遅れません。 推奨時間枠 H1. 設定と個人的なボーナスを得るために、購入後すぐに私に連絡してください!   設定 矢印を描く - オンオフ。 チャートに矢印を描く。 アラート - 可聴アラートのオンオフ。 メール通知 - オンオフ。 電子メール通知。 プチ通知 - オンオフ。 プッシュ通知。 次に、色域を調整します。 Gold Stuff mt5 は、金専用に設計されたトレンド指標であり、あらゆる金融商品にも使用できます。 インジケーターは再描画せず、遅れません。 推奨時間枠 H1. 設定と個人的なボーナスを得るために、購入後すぐに私に連絡してください!   設定 矢印を描く - オンオフ。 チャートに矢印を描く。 アラート - 可聴アラートのオンオフ。 メール通知 - オンオフ。 電子メール通知。 プチ通知 - オンオフ。 プッシュ通知。 次に、色域を調整します。
30 USD
今、147ドル(いくつかの更新後に499ドルに増加します) - 無制限のアカウント(PCSまたはMac) RelicusRoad ユーザー マニュアル + トレーニング ビデオ + プライベート Discord グループへのアクセス + VIP ステータス 市場の新しい見方 RelicusRoad は、外国為替、先物、暗号通貨、株式、および指数の世界で最も強力な取引インジケーターであり、トレーダーに収益を維持するために必要なすべての情報とツールを提供します。初心者から上級者まで、すべてのトレーダーが成功するためのテクニカル分析と取引計画を提供します。これは、将来の市場を予測するのに十分な情報を提供する重要な取引指標です。意味をなさないチャート上のいくつかの異なる指標ではなく、完全な解決策を信じています.これは、信号、矢印 + 価格アクション情報を表示するオールインワンのインジケーターで、他に類を見ない非常に正確です。 強力な AI に基づいて、RelicusRoad は不足している情報とツールを提供して、あなたを教育し、トレーディングのプロ、成功したトレーダーにします。
147 USD
note: this indicator is for METATRADER4, if you want the version for METATRADER5 this is the link:  https://www.mql5.com/it/market/product/108106 TRENDMAESTRO recognizes a new TREND in the bud, he never makes mistakes. The certainty of identifying a new TREND is priceless. DESCRIPTION TRENDMAESTRO identifies a new TREND in the bud, this indicator examines the volatility, volumes and momentum to identify the moment in which there is an explosion of one or more of these data and therefore the mome
777 USD
ご紹介     Quantum Breakout PRO は 、ブレイクアウト ゾーンの取引方法を変革する画期的な MQL5 インジケーターです。 13年以上の取引経験を持つ経験豊富なトレーダーのチームによって開発されました。     クォンタム ブレイクアウト プロ   は、革新的でダイナミックなブレイクアウト ゾーン戦略により、あなたのトレーディングの旅を新たな高みに押し上げるように設計されています。 クォンタム ブレイクアウト インジケーターは、5 つの利益ターゲット ゾーンを備えたブレイクアウト ゾーン上のシグナル矢印と、ブレイクアウト ボックスに基づいたストップロスの提案を提供します。 初心者トレーダーにもプロのトレーダーにも適しています。 量子EAチャネル:       ここをクリック 重要!購入後、インストールマニュアルを受け取るためにプライベートメッセージを送ってください。 推奨事項: 時間枠: M15 通貨ペア: GBPJPY、EURJPY、USDJPY、NZDUSD、XAUUSD アカウントの種類: ECN、Raw、またはス
149.99 USD
Description: First of all Its worth emphasizing here that this Trading Tool is Non-Repainting, Non-Redrawing and Non-Lagging Indicator, Which makes it ideal for professional trading and expert advisers. For limited time only 40% OFF, Now 60$  Next price 100$. Attention , the application might not work in the strategy tester,    Try Demo here before you buy:   here . Get a detailed blog, free online course and learn more about the Smart Price Action Concepts  here . Join our Free Group and
60 USD
Step into the realm of Forex trading with confidence and precision using XQ, a cutting-edge Forex indicator designed to elevate your trading game to unprecedented heights. Whether you're a seasoned trader or just stepping into the world of currency exchange, XQ Forex Indicator empowers you with the insights and signals needed to make informed trading decisions. The signal conditions are a combination of three indicators, and XQ Forex Indicator only display  medium and long-term trends . The ind
199 USD
mql5と Telegramの モーニング・ブリーフィングで、詳細とスクリーンショットを含む毎日のマーケット・アップデートをご覧 ください! FX Power MT5 NGは 、長年の人気を誇る通貨強度計FX Powerの次世代モデルです。 この次世代ストレングスメーターは何を提供するのでしょうか?初代FXパワーの魅力すべて プラス GOLD/XAUの強さ分析 より正確な計算結果 個別に設定可能な分析期間 カスタマイズ可能な計算上限値により、さらに優れたパフォーマンスを実現 もっと見たい人のための特別なマルチインスタンス設定 すべてのチャートでお好みの色を無限に設定可能 数え切れないほどの通知オプションにより、重要なことを見逃すことはありません。 Windows 11とmacOSのスタイルで角を丸くした新しいデザイン 魔法のように動くインジケーターパネル FXパワーの主な機能 すべての主要通貨の強さの完全な履歴 すべての時間枠における通貨の強さの履歴 すべてのブローカーとチャートで同一の計算結果 100%信頼できるリアルタイム計算 -> リペイントなし ドロップダウン・リストから
149 USD
ICT, SMC, SMART MONEY CONCEPTS, SMART MONEY, Smart Money Concept, Support and Resistance, Trend Analysis, Price Action, Market Structure, Order Blocks, BOS/CHoCH,   Breaker Blocks ,  Momentum Shift,   Supply&Demand Zone/Order Blocks , Strong Imbalance,   HH/LL/HL/LH,    Fair Value Gap, FVG,  Premium  &   Discount   Zones, Fibonacci Retracement, OTE, Buy Side Liquidity, Sell Side Liquidity, BSL/SSL Taken, Equal Highs & Lows, MTF Dashboard, Multiple Time Frame, BigBar, HTF OB, HTF Market Structure
60 USD
スイングトレーディング は、トレンドの方向のスイングと可能な反転スイングを検出するように設計された最初のインジケーターです。トレーディングの文献で広く説明されているベースラインスイングトレーディングアプローチを使用します。インディケータは、いくつかの価格と時間のベクトルを調査して、全体的なトレンドの方向を追跡し、市場が売られ過ぎまたは買われ過ぎて修正の準備ができている状況を検出します。 [ インストールガイド | 更新ガイド | トラブルシューティング | よくある質問 | すべての製品 ] むち打ちを起こさずに市場スイングの利益 インジケーターは常にトレンドの方向を表示します 色付きの価格帯は機会のベースラインを表します 色付きのダッシュは、可能な反転スイングを表します この指標は、独自の品質とパフォーマンスを分析します 複数時間枠のダッシュボードを実装します カスタマイズ可能なトレンドおよびスイング期間 電子メール/サウンド/プッシュアラートを実装します インジケータは再描画またはバックペインティングではありません Swing Tradingとは Swing Tradi
249 USD
FX Volume MT5
Daniel Stein
4.94 (16)
mql5と Telegramの モーニング・ブリーフィングで、詳細とスクリーンショットを含む毎日のマーケット・アップデートをご覧 ください! FX Volumeは、ブローカーの視点から市場のセンチメントをリアルに洞察する、最初で唯一の出来高インジケーターです。 ブローカーのような機関投資家が外国為替市場でどのようなポジションをとっているか、COTレポートよりもはるかに速く、素晴らしい洞察を提供します。 この情報をチャート上で直接見ることは、あなたの取引にとって真のゲームチェンジャーであり、画期的なソリューションです。 以下のようなユニークなマーケットデータ洞察から利益を得てください。 比率は 、通貨のロングポジションとショートポジションの比率をパーセントで表示します。 比率の変化は 、選択した期間内のロング比率とその変化率を表示します。 Volumes Totalは 、通貨の取引量(ロングとショート)の合計をロット単位で表示します。 Volumes Long :全通貨のロングポジションの取引量を表示します。 Volumes(ショート )は、全通貨のショートポジションの取引量を表示
229 USD
Quantum平均足PRO のご紹介 市場のトレンドに対する明確な洞察を提供するように設計された平均足キャンドルは、ノイズを除去し、誤ったシグナルを排除する能力で知られています。混乱を招く価格変動に別れを告げ、よりスムーズで信頼性の高いチャート表現を導入しましょう。 Quantum Heiken Ashi PRO を真にユニークなものにしているのは、従来のローソク足データを読みやすい色のバーに変換する革新的なフォーミュラです。赤と緑のバーはそれぞれ弱気トレンドと強気トレンドをエレガントに強調し、潜在的なエントリーポイントとエグジットポイントを驚くほど正確に見つけることができます。 量子EAチャネル:       ここをクリック MT4のバージョン:       ここをクリック この注目すべき指標には、いくつかの重要な利点があります。 明確性の向上: 価格変動を平滑化することで、平均足バーは市場トレンドをより明確に表現し、有利な取引機会を特定しやすくします。 ノイズの削減: 誤ったシグナルを引き起こすことが多い不安定な価格変動に別れを告げます。 Quantum Heik
99.99 USD
MT4版  |  FAQ Owl Smart Levels Indicator は、 Bill Williams の高度なフラクタル、市場の正しい波構造を構築する Valable ZigZag、エントリの正確なレベルをマークする Fibonacci レベルなどの一般的な市場分析ツールを含む 1 つのインジケーター内の完全な取引システムです。 利益を得るために市場と場所に。 戦略の詳細な説明 インジケータを操作するための指示 顧問-取引助手 プライベートユーザーチャット ->購入後に私に書いて、私はプライベートチャットにあなたを追加し、あなたはそこにすべてのボーナスをダウンロードすることができます 力はシンプルさにあります! Owl Smart Levels 取引システムは非常に使いやすいので、専門家にも、市場を勉強し始めて自分で取引戦略を選択し始めたばかりの人にも適しています。 戦略と指標に秘密の数式や計算方法が隠されているわけではなく、すべての戦略指標は公開されています。 Owl Smart Levels を使用すると、取引を開始するためのシグナルをすばやく確認し、注文を出すため
97 USD
First of all Its worth emphasizing here that this Trading System is Non-Repainting, Non-Redrawing and Non-Lagging Indicator, Which makes it ideal from both manual and robot trading.  For limited time only 50% OFF, Now 200$ Next price 400$. Get a detailed blog and learn more about the Atomic Analyst  here . Join our Free Group and stay up-to-date on the Best Indicators and Experts:   Here The Atomic Analyst is the Number #1 PA Price Action Indicator that uses Strength and Momentum of the pri
200 USD
これはMT5のインジケーターで、再描画なしで取引に参入するための正確なシグナルを提供します。 外国為替、暗号通貨、金属、株式、インデックスなど、あらゆる金融資産に適用できます。かなり正確な見積もりを提供し、取引を開始して終了するのに最適な時期を教えてくれます。1つのシグナルを処理しただけでインジケーターの元が取れた例の 動画 (6:22)をご覧ください。Entry PointsPro インジケーターの助けを借りたほとんどのトレーダーの最初の1週間の結果が改善しています。 Telegramグループ に登録してください。Entry Points Proインジケーターのメリットは次の通りです。 再描画のないエントリーシグナル 再描画されるインジケーターでは一度表示されたシグナルが削除されて大きな金銭的損失につながることがありますが、これと異なり、表示されて確認されたシグナルは消えることがありません。 エラーなしの取引開始 インジケーターアルゴリズムによって取引を開始する(資産を売買する)理想的な瞬間を見つけることができます。それを使用するすべてのトレーダーの成功率が向上します。
125 USD
トレンド スキャナーは、マルチシンボルおよびマルチタイム フレームから市場トレンドをスキャンし、チャート上の可動パネルに表示します。分析にはゴールド スタッフ インジケーターを使用します。機能には、アラート、電子メール、およびプッシュ通知が含まれます。 トレーダーは、自分が選んだペアを複数選択して表示できます。 トレンド スキャナーは、トレンドの方向性を確認するための優れたツールであり、トレンドに従って売買注文のみを許可することで、手動取引または EA 取引に使用できます。 機能には、アラート、電子メール、およびプッシュ通知が含まれます。 トレーダーは、自分が選んだペアを複数選択して表示できます。 トレンド スキャナーは、トレンドの方向性を確認するための優れたツールであり、トレンドに従って売買注文のみを許可することで、手動取引または EA 取引に使用できま リアルタイム結果はこちらからご覧いただけます。 設定と個人的なボーナスを得るために、購入後すぐに私に連絡してください!
30 USD
トレンドラインマップインジケーターは、トレンドスクリーナーインジケーターのアドオンです。トレンドスクリーナー(トレンドラインシグナル)によって生成されたすべてのシグナルのスキャナーとして機能します。 これは、トレンドスクリーナーインジケーターに基づくトレンドラインスキャナーです。 Trend Screener Pro インジケーターがない場合、Trend Line Map Proは機能しません。 It's a Trend Line Scanner based on Trend Screener Indicator. If you don't have Trend Screener Pro Indicator,     the Trend Line Map Pro will not work . ブログにアクセスすると、トレンドラインマップインジケーターの無料バージョンをダウンロードできます。 Metatrader Testerの制限なしで、購入する前に試してみてください。 :  ここをクリック 1.簡単になる利点 通貨と時間枠に基づいて売買シグナルを表示し
50 USD
ADR反転インジケーターは、通常の1日の平均レンジに関連して価格が現在取引されている場所を一目で示します。価格が選択した平均範囲とレベルを超えると、ポップアップ、電子メール、またはプッシュを介して即座にアラートを受け取るため、プルバックと逆転にすばやくジャンプできます。インディケータは、チャート上に1日の平均レンジの極値で水平線を描画し、それらを超える価格の数学的確率が付加されているレベルを超える延長も描画します。詳細については、以下をご覧ください... インジケーターとモニターを補完するADRアラートダッシュボードここでも利用可能なすべてのペア:https:// www.mql5.com/en/market/product/66316 MT4バージョンはこちらからも入手できます:https:// www.mql5.com/en/market/product/62757 通常の1日平均レンジ(ADR)内で価格が取引され、これらのレベルを上回っている時間の約60%は、通常、その後の引き戻し(利益確定)の動きを伴う急激な価格の動きの指標です。毎日の範囲の上部または下部からのプルバ
49 USD
TPSpro TRENDPRO  - is a trend indicator that automatically analyzes the market and provides information about the trend and each of its changes, as well as giving signals for entering trades without redrawing! The indicator uses each candle, analyzing them separately. referring to different impulses - up or down impulse. Exact entry points into transactions for currencies, crypto, metals, stocks, indices!  -    To maximize the potential and learn how to trade using this indicator, read the full
135 USD
TPA True Price Action indicator reveals the true price action of the market makers through 100% non-repainting signals strictly at the close of a candle! TPA shows entries and re-entries, every time the bulls are definitely stronger than the bears and vice versa. Not to confuse with red/green candles. The shift of power gets confirmed at the earliest stage and is ONE exit strategy of several. There are available now two free parts of the TPA User Guide for our customers. The first "The Basics"
168 USD
IX Powerは 、FX Powerの無敵の精度をついにFX以外のシンボルにも提供します。 お気に入りの指数、株式、コモディティ、ETF、さらには暗号通貨の短期、中期、長期のトレンドの強さを正確に判断します。 お使いの端末が提供する すべてを分析する ことができます。ぜひお試しいただき、取引 タイミングが大幅に改善 されることをご体験ください。 IXパワーの主な特徴 100%正確で再描画されない計算結果 - ターミナルで利用可能なすべての取引シンボルに対して 予め設定され、さらに個別に設定可能な強度分析期間のドロップダウン選択 Eメール、メッセージ、モバイル通知による無数の通知オプション EAリクエストのためのアクセス可能なバッファ カスタマイズ可能な計算制限により、さらに優れたパフォーマンスを実現 もっと見たい人のための特別なマルチインスタンス設定 すべてのチャートでお好みの色を無限に設定可能 Windows 11とmacOSのスタイルで角を丸くした新しいパネルデザイン サブ・ウィンドウとメイン・チャートの間をシームレスに移動する、魔法のように動くイン
89 USD
クリスマスセール!40% OFF!1月1日に価格が$250に値上がり! GoldenGate Entriesをご紹介します:最先端のトレーディングソリューション! GoldenGate Entries(GGE)を使用して取引する革新的なアプローチを発見しましょう。GGEは、取引体験を向上させるために設計された先進的なインジケーターで、ユーザーに正確性と自信を持たせるための包括的な機能を提供します。 通貨ペア:Any(FX - 商品 - 株式 - 株式 - クリプト) タイムフレーム:15分からH1 主な特徴: 買いと売りの矢印の指示:常に情報を受け取るために、買いと売りの矢印の指示をポップアップアラートとともに受け取ります。 GoldenGate_Algo:GoldenGate_Algoを使用して市場の状況を把握し、市場が「売り過ぎ」または「買い過ぎ」かどうかを評価する強力なツールです。 現在のトレンド分析:視聴中のタイムフレームで現在のトレンドにアクセスして、取引を市場の主流方向に合わせることができます。 組み込みのピボットポイント:組み込まれた
149 USD
Gannスクエアインジケーターは、W.D. Gannによって執筆された「市場予測のための数学的な式」の記事に基づく強力な市場分析ツールです。このツールは、解析に数学的な概念を応用し、Gann理論に基づいています。それは、144、90、52のスクエアや9のスクエアなど、Gannの関連テクニックの要素を取り入れています。さらに、の方法を組み込んでおり、9のスクエアとその関連性についてのチャネルやスターパターンに焦点を当てています。 ユーザーマニュアルと使用方法: このインジケーターを使用する前に、ユーザーマニュアルを読んで疑問点を解決するためにお問い合わせいただくことをお勧めします。ユーザーマニュアルの完全版は、当社のウェブサイトで入手できます。 MT5の完全版は購入できますし、MT4の無料版も試すことができます。両方のバージョンへのリンクを提供していますので、ご利用ください。 主な機能と機能: Gannスクエアインジケーターは、市場分析のための完全なツールセットを提供し、幾何学的な概念とGann理論に基づいて的確な判断を行う手助けをします。以下に主な機能を示します。 9のスクエアの分析:
200 USD
The Price Action Finder Multi indicator is an indicator of entry points that searches for and displays Price Action system patterns on dozens of trading instruments and on all standard time frames: (m1, m5, m15, m30, H1, H4, D1, Wk, Mn). The indicator places the found patterns in a table at the bottom of the screen. By clicking on the pattern names in the table, you can move to the chart where this pattern is located. Manual (Be sure to read before purchasing) | Version for MT4 Advantages 1. Pa
149 USD
Was: $259 Now: $120 — The Volume by Price Indicator for MetaTrader 5 features Volume Profile and Market Profile TPO (Time Price Opportunity). Get valuable insights out of currencies, equities and commodities data. Gain an edge trading financial markets. Volume and TPO histogram bar and line charts. Volume Footprint charts. TPO letter and block marker charts including split structures. Versatile segmentation and compositing methods. Static, dynamic and flexible ranges with relative and/or absolu
120 USD
Was: $299  Now: $99   Supply Demand uses previous price action to identify potential imbalances between buyers and sellers. The key is to identify the better odds zones, not just the untouched ones. Blahtech Supply Demand indicator delivers functionality previously unavailable on any trading platform. This 4-in-1 indicator not only highlights the higher probability zones using a multi-criteria strength engine, but also combines it with multi-timeframe trend analysis, previously confirmed swings
99 USD
ブレーカートレーダーになり、価格が反転すると市場構造からの利益が変化します。 注文ブロックブレーカーインジケーターは、トレンドまたは価格の動きが枯渇に近づいており、逆転の準備ができていることを識別します。通常、反転または大規模なプルバックが発生しようとしているときに発生する市場構造の変化について警告します。 この指標は、ブレイクアウトと価格の勢いを識別する独自の計算を使用します。使い果たされる可能性のあるポイントの近くで新しい高値が形成されるたびに、インディケーターはその高値の作成を担当する最後の注文ブロックを描きます。次に、移動する価格とともに注文ブロックを追跡します。その後、価格が反対方向にシフトし、その注文ブロックを突破すると、新しい市場構造を作成し、トレンドまたは大きな後退の可能性のある反転の開始を警告します。 注文ブロックは、高値/安値が作成される前の最後の反対色のろうそくであり、価格がこれらの重要な領域を下抜けすると、トレンドの短期的ま​​たは長期的な反転の兆候です。 特徴 重要な枯渇点での市場構造の変化を警告します 価格が使い果たされるレベルに近づくと、
49 USD
Reversal First Impulse levels (RFI)   - are the   maximum volume   levels/areas that turn the market around, so they play a critical role in future trading decisions. The logic behind the movement of any chart is that the price moves from the first impulse level (RFI) to the first impulse level (RFI) of the past trend. The first impulse level (RFI) is the most powerful level during a trend reversal, which forms a reversal zone. The first impulse level from the reversal of the previous movement
145 USD
作者のその他のプロダクト
ToolBot Advisor Indicator (RSI, ATR, ADX, OBV) FREE   An effective indicator for your negotiations The toolbot indicator and advisor brings leading (OBV) and lagging (RSI, ATR, ADX) indicators so that you have more security in your negotiations. In addition, it informs you of possible up and down trends as well as providing you with incredible advisors who will give you information about trading opportunities. With this indicator you will have more security and speed in your decision making
FREE
ToolBot   Probabilistic Analysis -  FREE   An effective indicator for your negotiations The toolbot indicator brings the calculation of candles and a probabilistic analysis so that you have more security on your own. Also test our   FREE   tops and bottoms indicator: :    https://www.mql5.com/pt/market/product/52385#description Also test our   FREE   (RSI, ATR, ADX, OBV)  indicator :    https://www.mql5.com/pt/market/product/53448#description Try our EA ToolBot for free:   https://www.mql
FREE
フィルタ:
Clemildes Horta
232
Clemildes Horta 2023.10.09 00:49 
 

Excelente indicador! Obrigado por partilhar!

leruaites
16
leruaites 2023.09.29 15:16 
 

Muito bom.

Airton Oliveira
40
Airton Oliveira 2021.10.14 22:08 
 

Já estava procurando um indicador de topos e fundos há muito tempo, está me ajudando muito. Obrigado.

Minas Nicolas
51
Minas Nicolas 2021.10.05 23:11 
 

Excellent Indicator!

João Silva
110
João Silva 2021.05.12 13:17 
 

Indicador muito bom, gostaria de saber o funcionamento do buffer de compra e de venda para anexar em um EA.

Aleksandr Tamonin
4109
Aleksandr Tamonin 2021.01.24 10:56 
 

Хороший индикатор. Спасибо автору.

レビューに返信
バージョン 1.2 2020.07.27
Added Bounce to make entry analysis more flexible.
バージョン 1.1 2020.07.20
Code base optimization.