SessionInfoDisplay

Critical Market Session Information with a Single Glance

Stop juggling multiple tools and squinting at time zone converters. The SessionInfoDisplay Indicator is your new, indispensable trading co-pilot that puts real-time market intelligence directly on your chart.

 What It Does: Your Essential Trading Dashboard 

This intelligent indicator provides three critical pieces of information at a glance:

1. Real-Time Session Detection

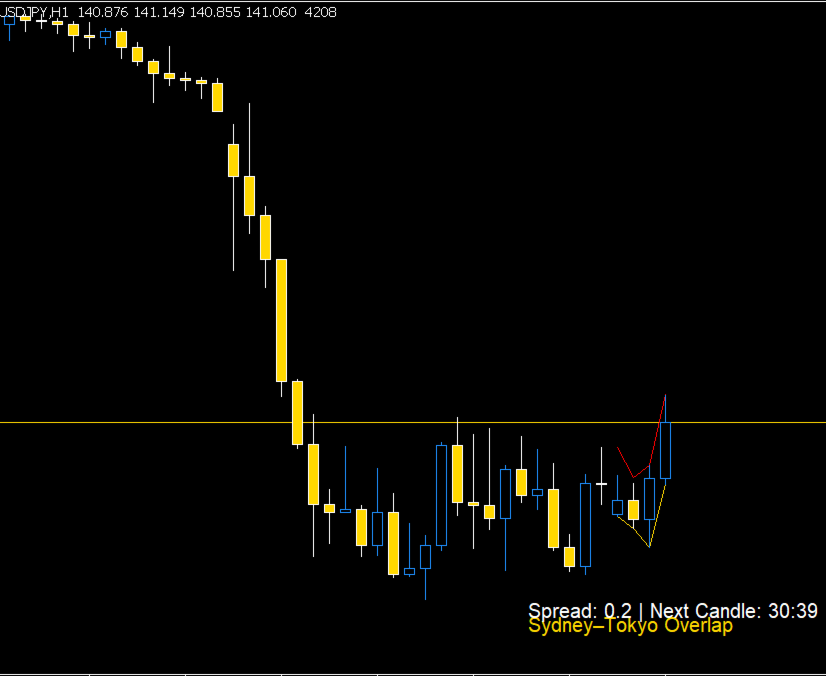
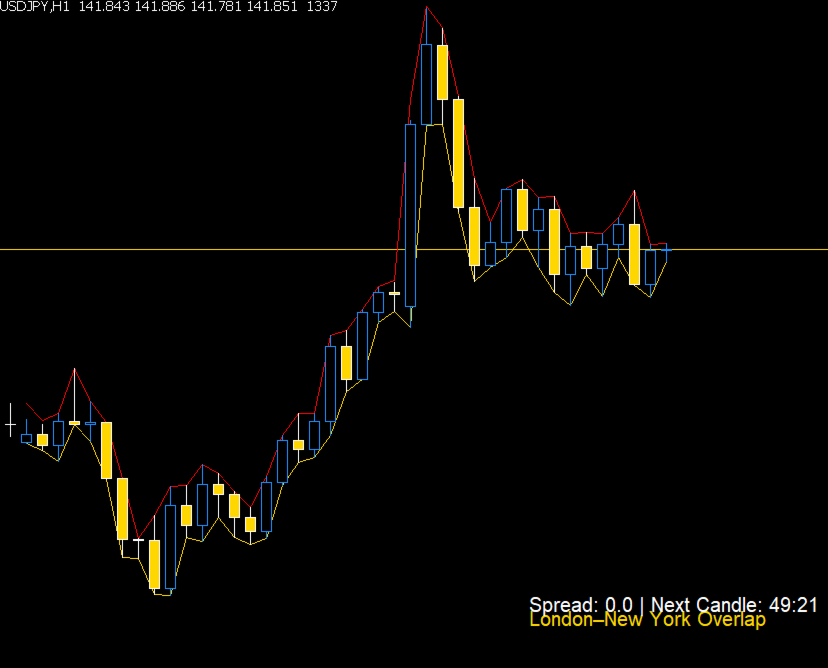
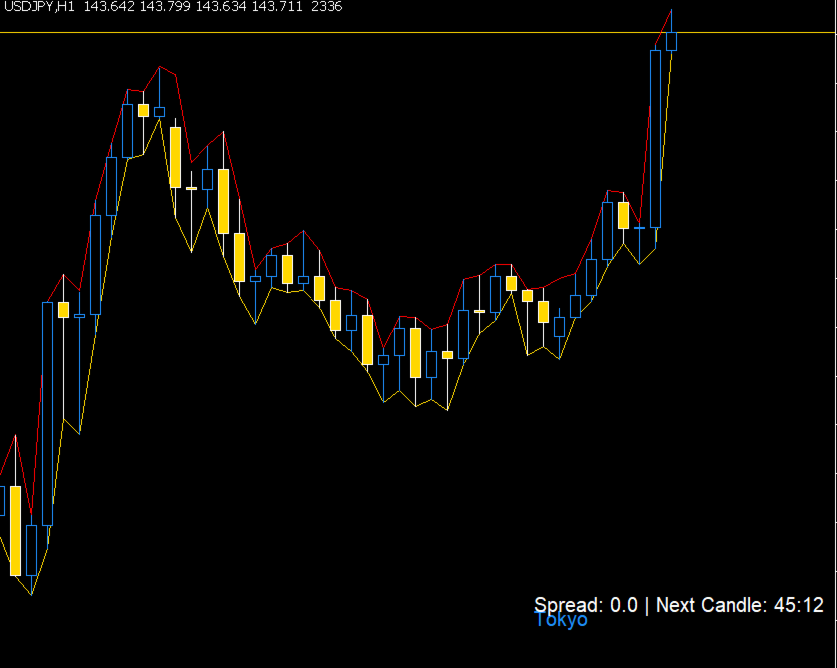
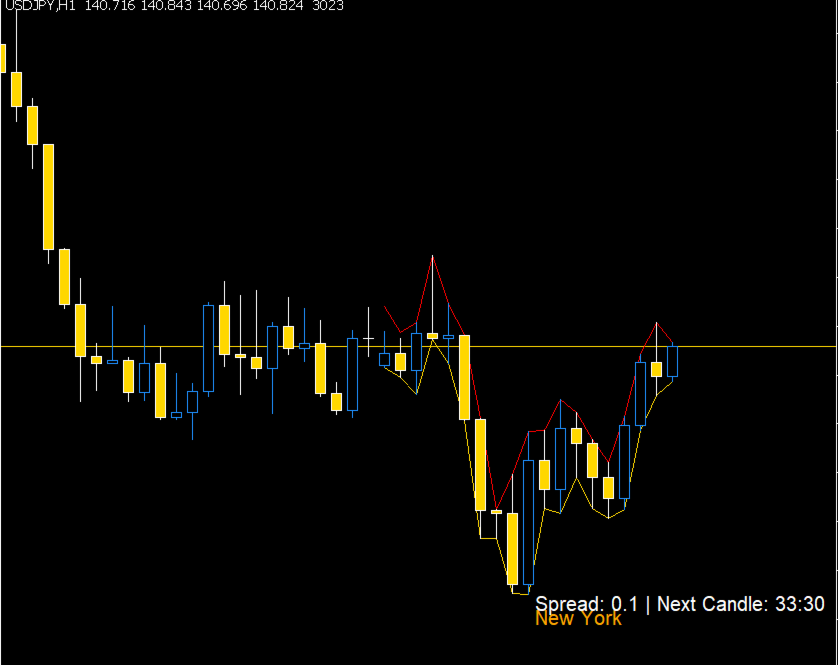
   - Automatically identifies which major financial session is active: Sydney, Tokyo, London, or New York

   - Flags precious overlap periods (like London-New York) where volatility spikes

   - Uses DST-safe GMT timing so you're never caught off-guard by daylight savings changes

   - Color-coded display for instant visual recognition


2. Live Spread Monitoring

   - Displays current spread in your preferred format (pips or points)

   - Watch spread changes in real-time to avoid entering during widening conditions

   - Essential for assessing trading costs and liquidity


3. Candle Countdown Timer

   - Shows exactly how much time remains until the current candle closes

   - Perfectly formatted as MM:SS for precision timing

   - Never miss an entry or exit at candle close again


 How It Transforms Your Trading:

  Timing Is Everything: 

Know precisely when liquidity flows in and out of the market. Enter during session overlaps when volume peaks, and avoid thin markets when spreads widen unpredictably.

  Risk Management Simplified: 

Monitor spreads in real-time. No more entering trades only to discover you're paying 3x the normal spread. Make cost-aware decisions instantly.

  Visual Efficiency: 

With colour-coded sessions displayed directly on your chart, you'll develop an intuitive sense of market rhythm. Green for London, Orange for New York – your brain learns to associate colours with market behaviours.

No More Time Zone Math: 

Forget calculating whether it's 8 AM GMT or 9 AM BST. The indicator handles all time conversions automatically, ensuring you're always synchronized with global market hours.

Customizable and Unobtrusive: 

Position it anywhere on your chart, adjust font size, and choose your preferred colour scheme. It provides vital information without cluttering your workspace.

 Why You Need This Indicator Now:

  Every professional trader knows that market session awareness separates profitable traders from the rest. Institutional traders have teams monitoring these variables – now you have the same advantage in a single, elegant tool.


Whether you're a scalper needing tight spreads, a swing trader timing entries with session opens, or a news trader capitalizing on overlap volatility, SessionInfoDisplay delivers the contextual awareness you need to trade with confidence.


Stop guessing. Start knowing. 

Add SessionInfoDisplay to your charts today and trade with the precision of someone who sees the entire global market clock.


Transform your chart from a price display into a strategic command centre.

Key Benefits Summary:

- Real-time session detection (DST-safe)

- Overlap period identification for high-volatility opportunities

- Live spread monitoring for optimal entry timing

- Candle countdown for precise trade execution

- Color-coded visual system for instant recognition

- Customizable placement and appearance


Compatible with MT5 | Updates every second | Lightweight and efficient

Your edge in the markets isn't just what you trade - it's when you trade. Master both with SessionInfoDisplay.


おすすめのプロダクト
Double Correlation indicator (free) plots two windowed correlations in a separate window.  the size of window is taken as input before the two symbols to correlate to. Two symbols are taken as an input parameters as well as period length. and the two correlations are computed with the currently shown symbol ex: input GBPJPY and AUDNZD.  current symbol EURUSD then the following will be computed corr(EURUSD,GBPJPY) and corr(EURUSD,AUDNZD) The indicator can be useful to run a multi-symbol pair trad
FREE
Indicator Description Range Filter Pro is a sophisticated trading tool for XAUUSD (Gold) that combines adaptive price filtering with volume analysis and real-time market monitoring. Designed for both novice and professional traders, this indicator helps identify trend direction, potential reversals, and significant market movements through its multi-layered approach. Key Components 1.Dynamic Range Filter 2.Volatility-Adjusted Bands 3.Volume-Enhanced Candles 4.Professional Trading Dashboard 5.M
FREE
Mae Pla Green Pen Analysis Framework The Mae Pla Green Pen Analysis Framework is a multi-timeframe price action scanner for XAUUSD (Gold Spot) . It monitors all 9 timeframes simultaneously — M1, M5, M15, M30, H1, H4, D1, W1, and MN — and displays pattern detection results on a real-time dashboard drawn directly on the chart. The indicator is based on the Mae Pla Green Pen trading methodology, which uses structured price action patterns to identify potential trade setups. Pattern Detection Three
FREE
Macro-R Pro Signal — Advanced Trading Signal Indicator Macro-R Pro Signal is a professional trading indicator designed to deliver high-quality BUY and SELL signals with enhanced precision and reduced market noise. By combining Bollinger Bands, RSI, and adaptive volatility filtering , this indicator helps traders identify high-probability reversal points while avoiding unfavorable market conditions. How the Strategy Works This indicator is built on a mean reversion + momentum confirmation concep
FREE
Trading Sessions by Mahefa R is an indicator for MetaTrader 5 that visually identifies the four main trading sessions: New York, London, Tokyo, and Sydney . Designed to provide a clean, intuitive, and professional market view, it highlights the most active periods of the Forex market using smart visualization of session ranges , session-specific candle colors , and daily separators . Main Features: Automatic detection of the 4 major sessions New York London Tokyo Sydney Each session is fully c
FREE
この情報インジケーターは、アカウントの現在の状況を常に把握したい人にとって役立ちます。 VERSION MT 4 -   More useful indicators このインジケーターには、ポイント、パーセンテージ、通貨での利益、現在のペアのスプレッド、現在の時間枠でバーが閉じるまでの時間などのデータが表示されます。 チャート上に情報線を配置するには、いくつかのオプションがあります。 価格の右側 (価格の後ろにあります)。 コメントとして (グラフの左上隅に); 画面の選択した隅。 情報区切り記号を選択することもできます。 | / \ # このインジケーターは使いやすく、非常に有益です。設定で不要な情報項目を無効にすることも可能です。 設定 外観の種類     - 情報行の表示タイプ。次の 3 つのオプションがあります。 価格に従ってください     - 価格に従う。 コメントとして     - コメントとして; 画面の選択した隅に     - 画面の選択した隅にあります。 添付用グラフコーナー     - 表示タイプを選択した場合 画面の選択されたコーナーでは、この項目を使用して
FREE
TimeCandles
Alvaro Da Fonseca Madruga
Título: Relógio de Candle – Otimize sua Precisão e Timing de Entrada Se você opera estratégias de rompimento, scalping ou qualquer método que dependa do fechamento de candles, sabe que timing é tudo . Operar "no escuro", sem saber exatamente quanto tempo falta para o candle atual encerrar, é uma das maiores fontes de ansiedade e erros de execução no day trade. Apresento o Relógio de Candle , uma ferramenta indispensável para quem busca profissionalizar o ambiente de tela. Por que utilizar este i
FREE
Multi Currency Strength Dashboard Mini (FREE) – Currency Strength Meter for MetaTrader 5 Multi Currency Strength Dashboard Mini は MetaTrader 5 向けの無料インジケーターで、 主要 8 通貨 (USD、EUR、GBP、JPY、CHF、CAD、AUD、NZD)の相対的な強さを、見やすく素早く読み取れるダッシュボードとしてリアルタイムに表示します。 目的:数秒で強い通貨と弱い通貨を把握し、ウォッチリストの絞り込みに役立てること(例:強い通貨と弱い通貨を組み合わせたペアを選ぶ)。 バージョン 2.00 の新機能 TradingTips UI による完全なビジュアル刷新(ディープネイビーのパネル、ネオングローボーダー、ブルーヘッダー)。 セクションボックス内のカラー強度バー(緑 / ゴールド / 赤)。 8 通貨ごとのトレンド矢印(上 / 下 / 中立)。 ヘッダーバーをつかんでドラッグ&ドロップでダッシュボードを移動。 最小化ボタン:コンパクトモードでチ
FREE
VFI Quantum
Nikita Berdnikov
5 (1)
Introducing VFI (Volume Flow Indicator) – a trading indicator that analyzes the relationship between volume and price movement to identify key trading opportunities. The indicator displays the strength and direction of volume flow, providing clear signals about potential entry and exit points. Signals are formed based on zero line crossovers, crossovers between the VFI line and its exponential moving average (EMA), and when the indicator exits overbought and oversold zones. Attention! This stra
FREE
My Candle Patterns
Francisco Gomes Da Silva
5 (1)
この指標は、こちらからダウンロードできるMy candleの完全版のデモ版です: Candle Patterns Creator 完全版では、独自のローソク足ルールを作成したり、従来のローソク足パターンを戦略に合わせてより正確に修正することができます。 この指標にはいくつかのローソク足ルールの例が含まれていますが、ここではいくつかをご紹介します: Pattern Rule Candle Green C > O Candle Red C < O Doji C = O Hammer (C > O and (C-O) *2 < O-L and (C-O) *0.5 > H-C) or (C < O and (O-C) *2 < C-L and (O-C) *0.5 > H-O) Hammer Green C > O and (C-O) *2 < O-L and (C-O) *0.5 > H-C Hammer Red C < O and (O-C) *2 < C-L and (O-C) *0.5 > H-O Marubozu  (C > O and C-O > (H-L) * 0.7 ) or
FREE
Correlation Matrix Pro - マルチ通貨ヘッジスキャナー 通貨ペア間の相関関係をリアルタイムで把握! 最大6つの通貨ペア間の統計的関係を同時に可視化する強力な分析ツールです。ポートフォリオ管理、リスク分散、ヘッジ戦略に最適です。 主な機能 - 対数リターンを使用したリアルタイムピアソン相関 - 最大6通貨ペアを同時監視 - 自動タイムフレーム検出 - 調整可能な遡及期間(5-200本) - ヘッジ機会の自動検出 - ミニマルで折りたたみ可能なパネルデザイン - 即座に解釈できるカラーコード付きマトリックス カラーコード 緑 (+0.70 〜 +1.00) = 強い正の相関 薄緑 (+0.50 〜 +0.69) = 中程度の正の相関 グレー (-0.49 〜 +0.49) = 弱い/相関なし オレンジ (-0.50 〜 -0.69) = 中程度の負の相関 赤 (-0.70 〜 -1.00) = 強い負の相関(ヘッジ) なぜ相関分析が重要? リスク管理 高相関ポジションによるリスクの二重化を回避。 ヘッジ戦略 効果的なヘッジのため、強い負の相関を持つペアを自動検出。
FREE
Girassol Sunflower MT5 Indicator
Saullo De Oliveira Pacheco
3.86 (7)
This is the famous Sunflower indicator for Metatrader5. This indicator marks possible tops and bottoms on price charts. The indicator identifies tops and bottoms in the asset's price history, keep in mind that the current sunflower of the last candle repaints, as it is not possible to identify a top until the market reverses and it is also not possible to identify a bottom without the market stop falling and start rising. If you are looking for a professional programmer for Metatrader5, please
FREE
Value Chart Candlesticks
Flavio Javier Jarabeck
4.57 (14)
The idea of a Value Chart indicator was presented in the very good book I read back in 2020 , " Dynamic Trading Indicators: Winning with Value Charts and Price Action Profile ", from the authors Mark Helweg and David Stendahl. The idea is simple and the result is pure genius: Present candlestick Price analysis in a detrended way! HOW TO READ THIS INDICATOR Look for Overbought and Oversold levels. Of course, you will need to test the settings a lot to find the "correct" one for your approach. It
FREE
Smart FVG Stats
- Md Rashidul Hasan
5 (1)
The  Smart FVG Statistics Indicator  is a powerful MetaTrader 5 tool designed to automatically identify, track, and analyze Fair Value Gaps (FVGs) on your charts. Love it? Hate it? Let me know in a review! Feature requests and ideas for new tools are highly appreciated. :) Try "The AUDCAD Trader": https://www.mql5.com/en/market/product/151841 Key Features Advanced  Fair Value Gap  Detection Automatic Identification : Automatically scans for both bullish and bearish FVGs across specified histo
FREE
VWAP Anchor Tool
Jackson Mukurani Wanguthi
Anchored VWAP is a lightweight, interactive volume-weighted average price indicator designed for traders who need precision without clutter. Unlike standard VWAP that resets every session, this tool lets you drop up to five custom anchors directly on any candle. Each anchor calculates VWAP from that exact point forward, complete with standard deviation bands to highlight where price may find support or resistance relative to volume. Key Features: • Up to 5 simultaneous anchors — compare multi
FREE
Candle Timer Closing MT5
Jean Charles Vilhena Maia
5 (1)
Candle Closing Timer Pro は、正確なエントリー判断のためにローソク足の確定を重視するトレーダー向けに開発された、シンプルかつ不可欠なツールです。チャートの隅に固定される一般的なタイマーとは異なり、このインジケーターは残り時間を 現在の価格ラインに直接表示 するため、プライスアクションから目を離さずに取引に集中できます。 主な特徴: インテリジェントな配置: タイマーはリアルタイムで売値(Bid)ラインに追従し、ローソク足の視認性を妨げないよう、ラインのすぐ下に表示されます。 ダイナミックな色変化アラート: 視覚的なカラーロジックを採用。通常時は フォレストグリーン で表示され、確定前のラスト10秒になると自動的に レッド に変化し、即座に判断が必要であることを知らせます。 全時間軸に完全対応: どのタイムフレームでも動作します。M1からH1などチャートを切り替えた際も、即座に残りの確定時間を再計算します。 軽量かつ高効率: Jean Maia による最適化されたMQLコードにより、複数のチャートで使用してもプラットフォームの動作に影響を与えないスムーズなパフォー
FREE
Shadow Flare インジケーターは、MetaTrader 5 向けの 非リペイント型トレンド & 流動性ツール です。設定可能な移動平均ベースライン(HMA / EMA / SMA / RMA から選択)を計算し、その上下に ATR(Average True Range)ベースのバンドを巻き付けることで「粘着性」のあるトレンド状態を生成します。トレンド状態は、価格の終値が上側バンドまたは下側バンドを明確にブレイクしてクローズしたときにだけ反転します。同じトレンドエンジンが自動サプライ・デマンドゾーンモジュールも駆動し、スイングハイ/スイングローを検出してその周囲に色付きボックスを描画し、価格がクローズでゾーンを抜けた瞬間にそのゾーンを無効化(ミティゲート)します。 トレンド状態が反転したバーで買い・売りシグナルが発生し、オプションの出来高フィルターと RSI フィルターにより、弱いエントリーやモメンタムに逆行するエントリーをブロックできます。内蔵ダッシュボードはリアルタイムでトレンドバイアス、モメンタム(RSI ベース)、出来高ステータスを表示します。ポップアップ、サウンド、モ
FREE
マルチタイムフレーム対応、カスタマイズ可能なビジュアル信号、設定可能なアラートシステムを備えた相対力指数(RSI)インジケーター。 フリーランスプログラミングサービス、アップデート、その他のTrueTL製品は私の MQL5プロフィール からご利用いただけます。 フィードバックとレビューを心よりお待ちしております! RSIとは? 相対力指数(RSI)は、価格変化の速度と大きさを測定するモメンタムオシレーターです。このインジケーターは0から100の間で振動し、指定された期間にわたって最近の上昇幅と最近の下落幅の大きさを比較します。 RSIは主に買われすぎと売られすぎの状態を識別するために使用されます。高い値は買われすぎ状態を示し、低い値は売られすぎ状態を示します。トレーダーはまた、RSIと価格動作の間のダイバージェンスにも注目しており、これは潜在的なトレンド転換を示す可能性があります。 機能: 矢印と垂直線を使用したビジュアルシグナルマーカー 設定可能なトリガー付きの3つの独立したシグナルバッファ(方向変化、レベル交差、ピーク/谷、極端ゾーン) 時間帯フィルタリング付きの設定可能なア
FREE
概要 このインジケーターは、クラシックな ドンチャンチャネル を強化したバージョンで、実践的なトレード機能を追加しています。 標準の3本線(上限、下限、中央線)に加え、 ブレイクアウト を検出し、チャート上に矢印で視覚的に表示します。また、チャートを見やすくするために、 現在のトレンド方向と逆側のラインのみを表示 します。 インジケーターの機能: 視覚的シグナル :ブレイクアウト時にカラフルな矢印を表示 自動通知 :ポップアップ、プッシュ通知、Eメール RSIフィルター :市場の相対的な強弱に基づいてシグナルを検証 カスタマイズ可能 :色、ラインの太さ、矢印コード、RSI閾値など 動作原理 ドンチャンチャネルは次のように計算します: 上限線 :直近N本のクローズ済みローソク足の最高値 下限線 :直近N本のクローズ済みローソク足の最安値 中央線 :最高値と最安値の平均値 上方ブレイクアウト は終値が上限線を超えたときに発生し、 下方ブレイクアウト は終値が下限線を下回ったときに発生します。 インジケーターは以下を行います: 3本のドンチャンラインを描画 方向転換後の最初のブレイクアウト
FREE
Multi Pair Scanner Ultimate
Janitha Sandaruwan Amaradasa Wickramasingha Arachchilage
5 (2)
Multi-Pair Scanner Ultimate: See the Whole Market at Once Stop flipping through 28 charts. The   Multi-Pair Scanner Ultimate   is a professional-grade dashboard that monitors   28 Forex pairs + Gold   simultaneously. It gives you a "God Mode" view of the market—Trend, Momentum, Currency Strength, and Signals—all in one lightweight panel that   never freezes your terminal.     NOTE: This is a Scanner, not an Auto-Trader Why This Scanner is Different Most dashboards lag and crash MT5 because they
FREE
High Low Open Close
Alexandre Borela
4.98 (44)
このプロジェクトが好きなら、5つ星レビューを残してください。 このインジケータは、指定されたためのオープン、ハイ、ロー、クローズ価格を描画します 特定のタイムゾーンの期間と調整が可能です。 これらは、多くの機関や専門家によって見られた重要なレベルです トレーダーは、彼らがより多くのかもしれない場所を知るために有用であり、 アクティブ。 利用可能な期間は次のとおりです。 前の日。 前週。 前の月。 前の四半期。 前年。 または: 現在の日。 現在の週。 現在の月。 現在の四半期。 現年。
FREE
SyncCrosshair - シンクロ&スナップ十字インジケータ 概要 SyncCrosshairは軽量なMQL5インジケーターで、複数のMT5チャートでTradingViewの十字線を再現します。同期されたチャート上でマウスを動かすかクリックすると、チャートのタイムフレーム(5分足、15分足、H1、H4など)の各ローソク足の始値に合わせて、垂直線と水平線が正確にスナップします。 主な機能 - マルチチャート同期: SyncCrosshairが接続されているすべてのチャートで、クロスヘアーの位置を自動的にミラーリングします。 - タイムフレームのスナップ: 現在のタイムフレームのバーに正確にラインをロック(例:M5では5分ごと、M15では15分ごと、H1では1時間ごと)。 - ローカルとグローバルの切り替え: Sボタンを押すと、アクティブなチャートのみで同期の有効/無効が切り替わります。 Hボタンを押すと、すべてのチャートで同期の有効/無効が切り替わります。 - カスタマイズ可能な外観: 好みの線の色、スタイル(ドット/ソリッド/ダッシュなど)、幅を選択。 - 高速でスムーズ:
FREE
PROMETHEUS TECHNICAN VERSION Free | By THE SONS A gift from The Sons — no strings, no trial, no expiry. Every trader deserves access to professional-grade market intelligence. That belief is why Prometheus Technical Version exists, and why it costs nothing. Consider it our handshake to the trading community. What You're Getting This is not a simplified tool dressed up as a gift. Prometheus Technican Version is a fully built, institutional-quality technical analysis indicator running a dual-model
FREE
Donchian Channel is an indicator created by Richard Donchian. It is formed by taking the highest high and the lowest low of the last specified period in candles. The area between high and low is the channel for the chosen period. Its configuration is simple. It is possible to have the average between the upper and lower lines, plus you have alerts when price hits one side. If you have any questions or find any bugs, please contact me. Enjoy!
FREE
AZ session scalper A small but useful session indicator, designed primarily for scalping. Enable the session you plan to trade, watch the reaction of the M5/M15 candlesticks to the level of the previous trading session, and enter. We always look at the reaction of the current session to the previous one. For example, if you trade the Americas, enable the European session, and watch how one session takes away liquidity from another. Important: adjust the time to your broker's time zone in the i
FREE
DC Indicator
Lamont Simone Reynecke
The donchian channel indicator might just be the best fit for you Trading in derivative products such as futures, options, CFD's, forex and certificates contains significant risk. These products are not suitable for every investor. Investors could potentially lose all or more than the original investment. If anything, only money equal to personal risk capital should be used and can be lost without jeopardizing financial security or lifestyle. Partially or fully automated trading programs can
FREE
Description The Institutional Cycle Filter (ICF) is a sophisticated trend-following tool that replaces standard moving averages with a "Signal Dot" system. It is designed to minimize lag while maintaining smoothness, making it highly effective for identifying trend reversals in volatile markets like Gold. How It Works (The Logic) Cosine Weighting: Unlike a Simple Moving Average (SMA) or Exponential Moving Average (EMA), this algorithm uses a Cosine function to calculate weights. This allows the
FREE
Follow The Line MT5
Oliver Gideon Amofa Appiah
4.6 (35)
This indicator obeys the popular maxim that: "THE TREND IS YOUR FRIEND" It paints a GREEN line for BUY and also paints a RED line for SELL. (you can change the colors). It gives alarms and alerts of all kinds. IT DOES NOT REPAINT and can be used for all currency pairs and timeframes. Yes, as easy and simple as that. Even a newbie can use it to make great and reliable trades. NB: For best results, get my other premium indicators for more powerful and reliable signals. Get them here: https://www.m
FREE
VolumeBasedColorsBars — Free Powerful Volume Analysis for All Traders Unlock the hidden story behind every price bar! VolumeBasedColorsBars is a professional-grade, 100% FREE indicator that colorizes your chart candles based on real, adaptive volume analysis. Instantly spot surges in market activity, identify exhaustion, and catch the moves that matter. This indicator gives you:    • Dynamic color-coded bars for instant volume context    • Adaptive thresholds based on historical, session-awar
FREE
TradeInfos
Dustin Ricardo Pierenz
Track your spread and all position PnLs (Buy & Sell) in real-time – stay in control of your trades at a glance! Features: Real-time spread display (in pips) Total Buy position PnL Total Sell position PnL Clean, non-intrusive display layout Works with all symbols and timeframes Perfect for: Scalpers needing quick spread awareness Day traders monitoring long/short performance Risk managers optimizing exposure No need to switch tabs or rely on external tools — everything you need is visible at
FREE
このプロダクトを購入した人は以下も購入しています
Neuro Poseidon is a new indicator by Daria Rezueva. It combines precise trading signals with adaptive TP/SL levels - creating best possible trades as a result! Message me and get  Neuro Poseidon Assistant  as a gift to automize your trading process! What makes it stand out? 1. Proven profitability on all assets and timeframes 2. Only confirmed BUY and SELL signals present on the chart 3. Adaptive TP & SL levels generated by the software for each trade 4. Easy to understand - suitable for al
SuperScalp Pro
Van Minh Nguyen
4.67 (27)
SuperScalp Pro – 高度なマルチフィルタースキャルピングインジケーターシステム SuperScalp Pro は、クラシックな Supertrend と複数のインテリジェント確認フィルターを組み合わせた高度なスキャルピングインジケーターです。M1 から H4 まで複数の時間足で効率的に動作し、XAUUSD、BTCUSD、主要 Forex 通貨ペア向けに最適化されています。 このインジケーターは明確な Buy / Sell シグナルを提供し、ATR に基づいてエントリー価格、Stop Loss、Take Profit を自動計算します。Fibonacci Take Profit 機能により、重要な価格帯で早期決済し、到達時に通知を送信します。 初期設定では Fibonacci Take Profit が有効化されており、より安定した取引体験を重視しています。チャートに適用するだけですぐ利用可能です。上級者向けに、すべてのパラメータは自由にカスタマイズできます。 完全なドキュメントは製品ブログにあります: [User Guide] SuperScalp Pro Auto T
まず正直に言いましょう。 どんなインジケーターも、それ単体であなたを利益化させることはできません。もしそう言う人がいるなら、それは夢を売っているだけです。完璧な売買シグナル(矢印)を表示するインジケーターは、いくらでも“完璧に見せる”ことができます。正しい過去の区間を拡大して、勝ちトレードだけを切り取ればいいだけです。私たちはそれをしません。 SMC Intraday Formula はツールです。 市場構造を読み取り、最も高い確率の価格ゾーンを特定し、今この瞬間のスマートマネーの痕跡をシンプルな言葉で正確に示します。最終判断はあなたが行います。トレードを実行するのもあなたです。しかし今は「希望」ではなく「精度」でエントリーできます。 私たちはこのインジケーターを、ゴールド(XAUUSD)および主要FX通貨ペアで約3年間、日々のスキャルピングに使用してきました。M1、M5、M15、M30の主要ツールです。これは未来を予測しようとするのではなく、今まさに形成されている高確率セットアップを示し、その理由を説明します。 他のすべてのインジケーターと何が違うのか? ほとんどのトレーディングイ
Gold Entry Sniper – ゴールドスキャルピング&スイングトレード用プロフェッショナル多時間足ATRダッシュボード Gold Entry Sniper は、XAUUSDや他の銘柄向けに正確な 売買シグナル を提供する、MetaTrader 5用の高度なインジケーターです。 ATRトレーリングストップロジック と 多時間足分析ダッシュボード を搭載し、スキャルピングからスイングトレードまで対応します。 主な特徴と利点 多時間足シグナル分析 – M1、M5、M15 のトレンドを同時表示。 ATRベースのトレーリングストップ – ボラティリティに応じて動的に調整。 プロ仕様のチャートダッシュボード – シグナル状況、ATRレベル、回帰線、売買方向を表示。 明確な売買マーカー – 自動矢印とテキストラベル。 エグジットアラートとトレード管理 – 利益確定のための自動検出。 完全カスタマイズ可能 – パネル位置、色、フォント、ATR/回帰設定を調整可能。 ゴールド(XAUUSD)に最適化 – M1〜M15のスキャルピングに最適、FXや指数、暗号資産にも対応。 Gold Entry
この製品は 2026 年の市場向けに更新され、最新の MT5 ビルドに最適化されています。 価格更新のお知らせ: Smart Trend Trading System は現在 $99 で提供されています。 次の 30 件の購入 後、価格は $199 に上がります。 特別オファー: Smart Trend Trading System を購入後、私にプライベートメッセージを送ることで、 Smart Universal EA を無料 で受け取り、Smart Trend のシグナルを自動売買に変えることができます。 Smart Trend Trading System は、リペイントなし、再描画なし、遅延なしの完全なトレーディングシステムです。よりクリーンなシグナル、より明確なトレンド方向、そしてより整理された取引方法を求めるトレーダー向けに作られています。 Online course , manual and download presets . このシステムは、トレンド検出、反転ゾーン、Smart Cloud、トレーリングストップロジック、サポートとレジスタンス、ローソク足の色分け、ア
Quantum TrendPulse を ご紹介します。これは、   SuperTrend   、   RSI   、および Stochastic のパワーを 1 つの包括的なインジケーターに組み合わせて、取引の可能性を最大限に引き出す究極の取引ツールです。精度と効率を求めるトレーダー向けに設計されたこのインジケーターは、市場のトレンド、勢いの変化、最適なエントリー ポイントとエグジット ポイントを自信を持って特定するのに役立ちます。 主な特徴: SuperTrend 統合: 現在の市場動向に簡単に追従し、収益性の波に乗ることができます。 RSI精度: 買われすぎと売られすぎのレベルを検出し、市場の反転のタイミングに最適で、SuperTrendのフィルターとして使用されます。 確率的精度: 確率的振動を活用して、変動の激しい市場で隠れたチャンスを見つけます。SuperTrend のフィルターとして使用されます。 マルチタイムフレーム分析:   M5 から H1 または H4 まで、さまざまなタイムフレームで市場を常に把握します。 カスタマイズ可能なアラート: カスタム取引条件が満たされ
トレンドキャッチャーインジケーター トレンドキャッチャーインジケーターは、開発者独自の適応型トレンド分析指標を組み合わせることで、市場価格の動きを分析します。短期的なノイズを除去し、根底にあるモメンタムの強さ、ボラティリティの拡大、価格構造の挙動に焦点を当てることで、真の市場方向性を特定します。また、移動平均線、RSI、ボラティリティフィルターなどの平滑化およびトレンドフィルタリング機能を備えたカスタマイズ指標も使用します。 実際の運用状況のモニタリングやその他の製品については、こちらをご覧ください: https://www.mql5.com/en/users/mechanic/seller ご注意ください。私はTelegramでEAや設定を販売していません。詐欺です。すべての設定はブログで無料で公開しています。 重要!ご購入後すぐにご連絡ください。手順とボーナスをお送りします!
Entry In The Zone and SMC Multi Timeframe is a real-time 2-in-1 market analysis tool that combines market structure analysis and a No Repaint BUY / SELL signal system into a single indicator, built on Smart Money Concepts (SMC) — a widely adopted framework used by professional traders to understand market structure. This indicator helps you see the market more clearly, make decisions based on structure rather than guesswork, and focus on high-probability zones where price is more likely to react
このインジケーターを購入された方には、以下の特典を 無料 で提供しています: 各トレードを自動で管理し、ストップロスとテイクプロフィットを設定し、戦略ルールに基づいてポジションを決済する補助ツール 「Bomber Utility」 様々な銘柄に合わせたインジケーターの設定ファイル(セットファイル) 「最小リスク」、「バランスリスク」、「待機戦略」 の3つのモードで使用できる Bomber Utility 用の設定ファイル このトレーディング戦略をすぐに導入・設定・開始できる ステップバイステップのビデオマニュアル ご注意: 上記の特典を受け取るには、MQL5のプライベートメッセージシステムを通じて販売者にご連絡ください。 オリジナルのカスタムインジケーター 「Divergence Bomber(ダイバージェンス・ボンバー)」 をご紹介します。これは、MACDのダイバージェンス(乖離)戦略に基づいた 「オールインワン」型のトレーディングシステム です。 このテクニカルインジケーターの主な目的は、価格とMACDインジケーターの間に発生するダイバージェンスを検出 し、将来の価格の動きを示す
PrimeScalping is a powerful trading companion designed to generate high-probability entry signals with dynamic TP/SL/DP levels based on volatility. Built-in performance tracking shows win/loss stats, PP1/PP2 hits, and success rates — all updated live. Key Features: Buy/Sell signals with adaptive volatility bands Real-time TP/SL/DP levels based on ATR Built-in MA Filter with optional ATR/StdDev volatility Performance stats panel (Success, Profit/Loss, PP1/PP2) Alerts via popup, sound, push, or e
Power Candles V3 - 自己最適化型強弱インジケーター Power Candles V3は 、通貨や銘柄の強さを、適用されたすべてのチャート上で実行可能なトレードプランに変換します。単にローソク足を色分けするだけでなく、バックグラウンドでリアルタイムの自動最適化を実行し、目の前の銘柄に対して最適なストップロス、テイクプロフィット、およびシグナルの閾値を提示します。ワンクリックで実取引に適用でき、エントリーポイント、ストップロス、テイクプロフィットのラインが正確な価格位置にチャート上に表示され、方向性を示すアラートがリアルタイムで発動します。 このツールは、Stein Investmentsのエコシステムの一部です。  18種類以上のツールをすべて閲覧し、AIを活用したセットアップの推奨事項を入手し、  https://stein.investments でコミュニティに参加しましょう クローズしたバーごとに3,000回以上のトレードシミュレーション。9つの強さの状態。2つの戦略を並行してテスト。勝率の高い設定をワンクリックで適用。 なぜこれが必要なのか ほとんどの強
FX Trend NG:次世代マルチマーケット・トレンドインテリジェンス 概要 FX Trend NG は、複数の時間足に対応したプロフェッショナル向けトレンド分析およびマーケット監視ツールです。 市場全体の構造を数秒で把握することができます。 複数のチャートを切り替える必要はありません。どの銘柄がトレンド中なのか、どこでモメンタムが弱まっているのか、そしてどの時間足で強い整合性があるのかを瞬時に確認できます。 ローンチ特別オファー – FX Trend NG を $30(6ヶ月) または $80 永久ライセンス でご利用いただけます。 すでに Stein Investments のユーザーですか? -> メッセージを送信 して、プライベートグループへアクセスしてください。 セットアップや詳細情報が必要ですか? -> Stein Investments 公式ページ をご覧ください。 1. FX Trend NG が他と異なる理由 3ステート・トレンドロジック ― Buy と Sell だけではない • 多くのインジケーターは Buy または Sell の2状態のみを表示します。
この製品は 2026 年の市場向けに更新され、最新の MT5 ビルドに最適化されています。 価格更新のお知らせ: Atomic Analyst は現在 $99 で提供されています。 次の 30 件の購入 後、価格は $199 に上がります。 特別オファー: Atomic Analyst を購入後、私にプライベートメッセージを送ることで、 Smart Universal EA を無料 で受け取り、Atomic Analyst のシグナルを自動売買に変えることができます。 Atomic Analyst は、リペイントなし、再描画なし、遅延なしの Price Action トレーディングインジケーターで、手動取引、シグナルの明確化、EA 自動化のために設計されています。 User manual: settings, inputs and strategy. 価格行動、強さ、モメンタム、マルチタイムフレーム方向、高度なフィルターを分析し、トレーダーがノイズを減らし、弱いセットアップを避け、より構造化された取引判断を行えるようにします。 このインジケーターは、複雑な市場計算をシンプルな視覚シ
Gann Made Easy   は、ミスター・ギャンの理論を使用した取引の最良の原則に基づいた、プロフェッショナルで使いやすい外国為替取引システムです。 W・D・ガン。このインジケーターは、ストップロスとテイクプロフィットレベルを含む正確な買いと売りのシグナルを提供します。 PUSH通知を利用して外出先でも取引可能です。 ご購入後、取引方法の説明と優れた追加インジケーターを無料で入手するには、私にご連絡ください! おそらく、ギャンの取引手法についてはすでに何度も聞いたことがあるでしょう。通常、ギャンの理論は初心者のトレーダーだけでなく、すでにある程度の取引経験がある人にとっても非常に複雑なものです。なぜなら、ギャンの取引手法は理論的にはそれほど簡単に適用できるものではないからです。私はその知識を磨き、最良の原則を私の外国為替インジケーターに組み込むために数年を費やしました。 このインジケーターは非常に簡単に適用できます。必要なのは、それをチャートに添付し、簡単な取引推奨事項に従うだけです。このインジケーターは常に市場分析の仕事を行い、取引の機会を探します。適切なエントリーポイントを検
開発者からのお知らせ: 129ドル で購入できるライセンスは残り 1つ です。売り切れ後、価格は 149ドル に変更されます。 M1 Quantum は、M1専用のプロフェッショナルトレーディングシステムであり、ストップロス、テイクプロフィット、スマートな資金管理を内蔵した、迅速かつ正確な取引シグナルを提供します。 M1 Quantum は、 連続勝利 に重点を置いて口座を素早く成長させるために設計されたプロフェッショナルな資金管理を備えています。 M1 Quantum インジケーター の主な特徴 M1時間足 およびすべての 主要通貨ペア 向けに設計 すべての取引にストップロスとテイクプロフィットを設定 資金管理 を実装し、トレーダーが簡単に取引できるようサポート 高い勝率と高い 連続勝利 リペイントなし、遅延なし あらゆるトレーダーにとって理解しやすい M1 Quantum を使用するには、 M1 Quantum Assistant が必要です。この強力なツールは、M1 Quantum をご購入いただいたすべてのお客様に 無料 で提供されています。 M1 Quantum Assis
ご紹介     Quantum Breakout PRO は 、ブレイクアウト ゾーンの取引方法を変革する画期的な MQL5 インジケーターです。 13年以上の取引経験を持つ経験豊富なトレーダーのチームによって開発されました。     クォンタム ブレイクアウト プロ   は、革新的でダイナミックなブレイクアウト ゾーン戦略により、あなたのトレーディングの旅を新たな高みに押し上げるように設計されています。 クォンタム ブレイクアウト インジケーターは、5 つの利益ターゲット ゾーンを備えたブレイクアウト ゾーン上のシグナル矢印と、ブレイクアウト ボックスに基づいたストップロスの提案を提供します。 初心者トレーダーにもプロのトレーダーにも適しています。 量子EAチャネル:       ここをクリック 重要!購入後、インストールマニュアルを受け取るためにプライベートメッセージを送ってください。 推奨事項: 時間枠: M15 通貨ペア: GBPJPY、EURJPY、USDJPY、NZDUSD、XAUUSD アカウントの種類: ECN、Raw、またはスプレッドが非常に低い R
GoldenX Entryは、MT5向けのインジケーターであり、適応型Smart Entry Trendアルゴリズム、シグナルスコアリングシステム、マーケットレジーム検出機能、およびボラティリティフィルターを備えています。各シグナルには、計算されたエントリーレベル、3つのテイクプロフィット(TP1、TP2、TP3)、およびストップロスレベルが含まれます。本インジケーターは、異なる市場環境に適応するために設計された複数の分析レイヤー上に構築されており、マルチレイヤー分析システムと内蔵オプティマイザーおよび統計トラッキングシステムを組み合わせています。リスク・リワード(RR)指標および過去のトレード履歴に基づく定量分析を提供します。 使い始めは簡単です — 選択した時間足でオプティマイザーを実行し、そのままチャート上でインジケーターを使用します。 コア機能 GoldenX Entryは、シグナルエンジンとトレード管理機能、そして過去統計トラッキングを1つのチャートに統合しています: - 内蔵オプティマイザー: オプティマイザーはチャート上でワンクリックで実行できます。200通りのパラメー
この製品は 2026 年の市場向けに更新され、最新の MT5 ビルドに最適化されています。 価格更新のお知らせ: Smart Price Action Concepts は現在 $200 で提供されています。 次の 30 件の購入 後、価格は $299 に上がります。 特別オファー: 購入後、私にプライベートメッセージを送ることで、 無料ボーナス + ギフト を受け取ることができます。 まず、このトレーディングツールはリペイントなし、再描画なし、遅延なしのインジケーターであり、プロフェッショナルな取引に最適であることを強調しておきます。 Online course , and manual Smart Price Action Concepts Indicator は、初心者から経験豊富なトレーダーまで使える非常に強力なツールです。20 種類以上の便利なインジケーターを 1 つにまとめ、Inner Circle Trader Analysis や Smart Money Concepts Trading Strategies などの高度な取引アイデアを組み合わせています。このインジケ
ARIPoint
Temirlan Kdyrkhan
1 (1)
ARIPoint is a powerful trading companion designed to generate high-probability entry signals with dynamic TP/SL/DP levels based on volatility. Built-in performance tracking shows win/loss stats, PP1/PP2 hits, and success rates all updated live. Key Features: Buy/Sell signals with adaptive volatility bands Real-time TP/SL/DP levels based on ATR Built-in MA Filter with optional ATR/StdDev volatility Performance stats panel (Success, Profit/Loss, PP1/PP2) Alerts via popup, sound, push, or email Cu
Azimuth Pro
Ottaviano De Cicco
5 (7)
Azimuth Pro V2:MT5向けシンセティック・フラクタル構造分析と確認済みエントリー 概要 Azimuth Pro は Merkava Labs によるマルチレベルスイング構造インジケーターです。4つのネストされたスイングレイヤー、スイングアンカーVWAP、ABCパターン検出、3タイムフレーム構造フィルタリング、そして確定バーでの確認済みエントリー — 1つのチャートで、ミクロスイングからマクロサイクルまでを網羅するワークフロー。 これはブラインドシグナル製品ではありません。ロケーション、コンテキスト、タイミングを重視するトレーダーのための構造ファーストワークフローです。 V2発売記念オファー — Azimuth Pro V2をUSD 399で(次の100本)。最終価格:USD 499。 1. V2での変更点 シンセティック・マルチタイムフレームエンジン 上位タイムフレーム分析をMeridian Proと同じ独自のシンセティックアーキテクチャで一から再構築。よりクリーンなHTFコンテキスト、安定したライブ動作、従来のMTF同期問題なし。シンセティックエンジンは 固定比率タ
Crystal Heikin Ashi Signals - Professional Trend & Signal Detection Indicator Advanced Heikin Ashi Visualization with Intelligent Signal System for Manual & Automated Trading Final Price: $149 ---------> Price goes up $10 after every 10 sales . Limited slots available — act fast . Overview Crystal Heikin Ashi Signals is a professional-grade MetaTrader 5 indicator that combines pure Heikin Ashi candle visualization with an advanced momentum-shift detection system. Designed for both manual traders
Market Structure Order Block Dashboard MT5 は、市場構造と主要な価格反応ゾーンをチャート上で直接読み取りたいトレーダー向けに設計された MT5 インジケーターです。BOS、ChoCH、オーダーブロック、Fair Value Gap (FVG)、流動性、Kill Zones、Volume Profile、そして素早い分析のためのコンパクトなダッシュボードを組み合わせています。 本インジケーターは、市場構造、ICT、Smart Money の概念を意思決定の枠組みとして使用するトレーダーを対象としています。トレンド継続、反転の可能性、価格の不均衡、流動性ターゲット、注目ゾーンをより構造的に特定する助けとなります。 購入者向けの付属リソース 購入後、MQL5 のプライベートメッセージにてご依頼いただくと、完全な PDF ユーザーガイドとパラメータ設定のヒントを提供いたします。MQL5 のプライベートメッセージによる直接的な技術サポート。 バージョン 1.20 では 2 つの重要な追加機能があります: Pending BOS / Pending Cho
GEM Signal Pro GEM Signal Pro は、MetaTrader 5 向けのトレンドフォロー型インジケーターです。より明確なシグナル、より整理されたトレードセットアップ、そして実用的なリスク管理をチャート上で確認したいトレーダーのために設計されています。 単純な矢印だけを表示するのではなく、GEM Signal Pro はトレード全体の考え方を、より見やすく分かりやすい形で表示します。条件が確認されると、インジケーターはエントリー価格、ストップロス、利確目標をチャート上に表示し、トレードセットアップをより効率的に確認できるようにします。 動作の仕組み このインジケーターは、まず内部ロジックに基づいて有効なシードシグナルを検出します。 確認条件が満たされると、GEM Signal Pro はチャート上に完全なセットアップを表示します。これにより、トレーダーはトレード構造をより明確に把握し、手作業による分析を減らすことができます。 チャート上のトレードレベル 確認済みシグナルに対して、GEM Signal Pro は以下を表示できます。 エントリー価格 ストップロス テ
Reversion King Indicator
Eugen-alexandru Zibileanu
5 (4)
新たな王者が登場 - インジケーター + 注文管理表示(TP1 + TP2 + TP3)+ オプションのTelegramシグナル送信機能付き(無料) (完全なトレード&シグナルシステム) ゴールド向け最高のEA: Gold Slayer このインジケーターには、高度な戦略、カスタマイズ可能な注文管理システム、そしてエンベロープ拡張を組み合わせた平均回帰システムが搭載されています。さらに、RSIなど複数のインテリジェントな確認フィルターによって、高確率の反転エントリーをBUY・SELLシグナルとして検出します。 単にトレードを学ぶだけでなく、複数ポジションを効果的に管理し、過去に利益を出しているオープンポジションで損失トレードをカバーする方法も学べます。 M5向けに構築・最適化されており、流動性が高くシグナルの精度が安定しているBTCUSDとXAUUSDで優れたパフォーマンスを発揮します。 このインジケーターは、ATRを基に自動計算されたエントリー、ストップロス、テイクプロフィットレベルを備えた明確なLong・Shortシグナルを提供するため、リスク管理が最初から組み込まれています。 マ
KURAMA GOLD SIGNAL PRO(MT5版)— 7層フィルター・自動TP/SL・品質スコア・サイン履歴保存搭載 XAUUSD完全トレードシステム リアルタイムでリペイントしません。サインが出た瞬間、矢印・エントリー・TP・SLはその場で固定され、後から動きません。あなたがトレードするのは、この「リアルタイムで出たサイン」です。さらにv7.20では、実際に通知されたサインを自動保存し、再起動後もそのまま復元します。 購入者限定特典 買い切りライセンスをご購入いただいた方に、AI Zone Radar($59相当)+完全PDFマニュアルを無料プレゼント。本体価格に$59相当の特典が付いてきます。購入後にMQL5でメッセージをお送りください。 AI Zone Radar: https://www.mql5.com/en/market/product/175834 ゴールドトレーダーのコミュニティで実際に使用され、精度と使いやすさで高く評価されています。 あな
Quant Direction は、3次元の市場分析ツールです。完全に客観的なアルゴリズムベースの市場分析を提供し、様々なパラメータにわたる正確なパーセンテージ偏差を同時に算出します。高度なAI搭載モデリングツールで開発され、厳密なテストを経て開発されたこのアルゴリズムは、かつてない精度で市場を分析するように設計されています。プラットフォーム上では、あらゆる通貨ペアや金融商品を分析できます。 短期取引、デイトレード、スイングトレードなど、どのような取引スタイルに も、Quant Directionは最適な選択肢です。 オペレーターの本当の利点 Quant Directionの真の利点は、感情、眼精疲労、過剰分析を完全に排除できる点にあります。方向性を探るために何十ものチャートを手作業で精査したり、自分の好みを常に疑ったりする必要がなくなります。このシステムは、8つの時間間隔(5ヶ月から月単位まで)をミリ秒単位で処理します。あらゆる瞬間に市場を支配している主体を正確に明らかにし、常に成功確率が最も高い方向で取引できるようにします。 市場分析の3つの側面 このアルゴリズムは市場を3つの
優れたテクニカルインジケーター「Grabber」をご紹介します。これは、すぐに使える「オールインワン」トレーディング戦略として機能します。 ひとつのコードに、市場のテクニカル分析ツール、取引シグナル(矢印)、アラート機能、プッシュ通知が強力に統合されています。 このインジケーターを購入された方には、以下の特典を無料で提供します: Grabberユーティリティ:オープンポジションを自動で管理するツール ステップバイステップのビデオマニュアル:インジケーターのインストール、設定、取引方法を解説 カスタムセットファイル:インジケーターをすばやく自動設定し、最大限の成果を出すための設定ファイル 他の戦略はもう忘れてください!Grabberだけが、あなたを新たなトレードの高みへと導いてくれるのです。 Grabber戦略の主な特徴: 推奨タイムフレーム:M5〜H4 対応通貨ペア・資産:どれでも使用可能ですが、私が実際に検証した以下を推奨します(GBPUSD、GBPCAD、GBPCHF、AUDCAD、AUDUSD、AUDSGD、AUDCHF、NZDUSD、NZDCAD、EURCAD、EURUSD、E
SmartScalping is a powerful trading companion designed to generate high-probability entry signals with dynamic TP/SL/DP levels based on volatility. Built-in performance tracking shows win/loss stats, PP1/PP2 hits, and success rates — all updated live. Key Features: Buy/Sell signals with adaptive volatility bands Real-time TP/SL/DP levels based on ATR Built-in MA Filter with optional ATR/StdDev volatility Performance stats panel (Success, Profit/Loss, PP1/PP2) Alerts via popup, sound, push, or e
RelicusRoad Pro: 定量的市場オペレーティングシステム 【期間限定】無制限アクセス 70% OFF - 2,000人超のトレーダーと共に なぜ多くのトレーダーは「完璧な」インジケーターを使っても失敗するのでしょうか? それは、文脈を無視して 単一の概念 だけでトレードしているからです。文脈のないシグナルは単なるギャンブルです。勝ち続けるには、 根拠の重なり(コンフルエンス) が必要です。 RelicusRoad Proは単なる矢印インジケーターではありません。完全な 定量的市場エコシステム です。独自のボラティリティモデリングを用いて、価格が推移する「適正価値の道(Fair Value Road)」をマッピングし、ノイズと真の構造的ブレイクを判別します。 推測はやめましょう。機関投資家レベルの「ロード・ロジック」でトレードを。 コアエンジン:「Road」アルゴリズム システムの中心となる Road Algo は、市場環境にリアルタイムで適応するダイナミックなボラティリティチャネルです。 安全ライン(平衡点) と、価格が数学的に反転しやすい 拡張レベル を投影します。 Si
ScalpPoint is a powerful trading companion designed to generate high-probability entry signals with dynamic TP/SL/DP levels based on volatility. Built-in performance tracking shows win/loss stats, PP1/PP2 hits, and success rates — all updated live. Key Features: Buy/Sell signals with adaptive volatility bands Real-time TP/SL/DP levels based on ATR Built-in MA Filter with optional ATR/StdDev volatility Performance stats panel (Success, Profit/Loss, PP1/PP2) Alerts via popup, sound, push, or emai
作者のその他のプロダクト
Cumulative Volume Delta (CVD) MA-X:インテリジェント・オーダーフロー・センチメントツール Cumulative Volume Delta (CVD) MA-X で、市場の隠れたメカニズムを解き明かしましょう。標準的な出来高指標は「どれだけ」取引されたかを示すだけですが、CVD MA-X は「 誰が 」買い手と売り手の攻防に勝っているのか、そして「 いつ 」それが起きているのかを明らかにします。ティックレベルの値動きと出来高分布を統合することで、市場の確信度と枯渇状態を極めて明確に描き出します。 トレーダーの優位性:なぜ CVD MA-X なのか? 多くのトレーダーが失敗するのは、価格の遅行性に反応してしまうからです。CVD MA-X は、ローソク足の内部圧力(ヒゲと実体の比率)を出来高で加重分析することで、 先行的な優位性 を提供します。リアルタイムで以下の3つの重要な問いに答えます: この動きは「本物の資金」に裏打ちされているか? (CVDとゼロラインの連動) トレンドの勢いが衰えていないか? (MaxBuy/MaxSell 枯渇ポイント) 大口投
QQE Kalman Hybrid  Smarter Trend Detection. Faster Entries. Cleaner Decisions. QQE Kalman Hybrid is built to help you act on what’s happening now. This momentum and trend confirmation indicator combines the proven structure of classic QQE logic with a modern Kalman adaptive engine designed to reduce lag, smooth noise, and surface high-quality trade opportunities earlier. The result is a clean, decision-focused tool that helps traders identify:  What’s the trend structure?  Where’s the best
FREE
T3 MTF PureMath s:マルチタイムフレーム Tillson T3 インジケーター インタラクティブ・ダッシュボード搭載、ゼロラグ・コンフルエンス・トレードシステム マルチタイムフレームがもたらすトレードの優位性 T3 MTF Pure Maths  は、月足から5分足まで、計 8つのタイムフレーム の市場構造を同時に集約するプロ仕様のトレードダッシュボードです。チャートの切り替えや複雑な計算をすることなく、瞬時にアクションにつながる洞察を提供します。 純粋な数学的最適化(インジケーター・ハンドルの不使用、CopyBufferコールの排除)に基づいて構築されており、標準的なインジケーター実装よりも 5〜10倍高速なパフォーマンス を実現。リアルタイムトレードだけでなく、負荷の高いストラテジーテストにも最適です。 このインジケーターが解決する疑問 トレーダーの疑問 T3 MTF Pureによる回答 全体的なトレンド構造は? 色分けされたトレンドパネルで、MN1からH4までの整合性を一目で確認。 最高の注文タイミング(エントリー)は? エントリー用時間足(H1-M30-M15
The Ultimate Ichimoku MTF Dashboard: Your All-In-One Trading Edge Transform Your Trading with One Powerful Indicator Imagine having a professional trading assistant that monitors multiple timeframes simultaneously, identifies high-probability entries, warns you of potential reversals, and provides clear risk management guidance-all in one clean, intuitive display. That's exactly what the Ichimoku MTF Dashboard delivers.     Why This Isn't Just Another In
Cumulative Volume Delta MA-X MTF (Gradient Momentum 搭載) このインディケーターは、MetaTrader 5向けにマルチタイムフレーム(MTF)での累積ボリューム・デルタ(CVD)分析を行います。ティックデータまたはリアルボリュームデータを分析することで、買い圧力と売り圧力の純差を計算し、オーダーフローのセンチメントを視覚的に表現します。 ロジックと機能 このインディケーターは、数学的なアプローチを用いてボリューム分析を行います: データソース : 取引所銘柄のリアルボリューム(Real Volume) と、FX/CFD向けの OHLCウィック・プロキシ(OHLC Wick Proxy)計算の両方をサポートしています。 グラデーションシステム : 4色の移動平均線がトレンドの段階を識別します: ディープスカイブルー(DeepSkyBlue) : 数値が正で、上昇中。 オレンジ(Orange) : 数値が正で、下落中。 マゼンタ(Magenta) : 数値が負で、下落中。 パープル(Purple) : 数値が負で、上昇中。 5レイヤー
Clr-Dynamic RSI v SMA Indicator: A Comprehensive Analysis of Features and Advantages The Clr-Dynamic RSI v SMA indicator represents a significant evolutionary leap in technical analysis tools, transforming the classic Relative Strength Index (RSI) from a potentially ambiguous oscillator into a sophisticated, multi-dimensional trading system. At its core, this indicator retains the mathematical foundation of the RSI, measuring the speed and change of price movements, but radically enhances its
MTF Candlestick Patterns Detector: 究極のプライスアクション・コマンドセンター 変化の激しいトレードの世界では、たった一つの反転パターンを見逃すことが、利益の出る週とチャンスを逃す週の分かれ目になります。 MTF Candlestick Patterns Detector は、すべての時間足で24種類以上の伝説的なローソク足パターンを同時にスキャン、検出、集計するために設計されたプロ仕様のMQL5インジケーターです。 チャートを闇雲に探し回ったり、推測したりするのはもう終わりにしましょう。アルゴリズムが、高確率なセットアップをあなたの元へ届けます。 トレーダーの優位性:なぜこのインジケーターなのか? 多くのローソク足インジケーターは、遅行データでチャートを埋め尽くしてしまいます。当検出器は、コクピットのような役割を果たす マルチタイムフレーム(MTF)パネル を提供し、最も重要なトレードの疑問に一目で答えます。 トレンド構造はどうなっているか? パネルは「トレンドパターン」(MN1からH4)と「エントリーパターン」(H1からM5)を分けて表示します。
MTF VWAP Indicator - Quick Overview   This indicator shows you where institutional money is flowing across multiple timeframes using Volume Weighted Average Price (VWAP) to identify high-probability trading zones.     What It Actually Does:     1. Tracks Smart Money Levels: - Shows Daily, Weekly, and Monthly VWAP lines where big players (banks, funds) are trading - Tells you if price is above or below these key institutional levels - Shows distance from VWAP as a percentage (tells you how extend
Indicator Overview This is a sophisticated Multi-Timeframe (MTF) indicator that not only applies the classic Fisher Transform formula but integrates it into a comprehensive trading system featuring a real-time dashboard. The indicator excels at pinpointing reversals through advanced divergence detection and providing a clear, multi-timeframe view of market structure.     How It Works: Core Fisher Logic   1.   Normalization and Signal Generation         The indicator transforms price (using med
MTF WAD Simplified Indicator - Professional Trading Solution     Overview The MTF WAD Simplified is a sophisticated multi-timeframe volume-based indicator designed to track smart money flow across financial markets. By monitoring the Williams Accumulation/Distribution (WAD) across 8 different timeframes, this tool provides traders with unprecedented insight into institutional accumulation and distribution patterns.     Core Benefits for Traders     1. Smart Money Tracking - Detect Institutional
RSI v SMA MTF Indicator : Professional Trading Edge in One Tool   Summary The RSI v SMA MTF Indicator is a sophisticated, multi-timeframe momentum analysis tool that transforms the traditional RSI into a powerful, actionable trading system. By combining RSI slope analysis with SMA crossover signals, divergence detection, and real-time multi-timeframe confluence, this indicator provides traders with a more comprehensive view of market momentum across all relevant timeframes.     Core Utility an
MTF Connecting Fractals Multi-Timeframe Market Structure. One Glance. Real Decisions. MTF Connecting Fractals is not just another arrow-printing indicator. It’s a complete multi-timeframe market structure intelligence system designed to answer the most important trading questions in real time - clearly, visually, and without clutter. Built around fractals as objective structure anchors, this tool gives traders a decisive edge by combining price action, structural context, proximity risk, and
Multi-Timeframe Money Flow Index (MTF MFI) with Smart Divergence and Dashboard Unlock the flow of institutional money across every timeframe. Are you tired of guessing the trend only to be trapped by a sudden reversal? The Multi-Timeframe Money Flow Index (MTF MFI) is a professional-grade trading tool designed to provide a bird's-eye view of market liquidity and momentum. By aggregating volume-weighted data from W1 down to M1, this indicator eliminates noise and highlights high-probability tra
MTF Parabolic SAR Maximize your trading efficiency with the Multi-Timeframe Parabolic SAR Trend and Momentum Dashboard. Designed for serious traders who value clarity over clutter, this tool aggregates price action across six timeframes into a single, sleek visual interface.  By combining that reliable classic Parabolic SAR logic with advanced momentum scoring and risk assessment, this indicator transforms raw data into actionable trade signals.  The Strategic Edge: Why This Indicator? Most tra
Multi-Timeframes Heiken Ashi Dashboard : The Trend is your Friend Indeed Confluence Trading System     Transform Your Trading with Crystal-Clear Market Structure Visualization Tired of confusing charts and conflicting signals? The Multi-Timeframe Heiken Ashi Dashboard is your complete solution for professional-grade market analysis. This all-in-one indicator combines smoothed Heiken Ashi candles with an intelligent multi-timeframe panel to give you unprecedented clarity in any market condition
Hybrid BB-LRMA [Trend and Volatility Engine]   Master the markets with the Hybrid BB-LRMA, a professional-grade technical analysis tool that fuses the volatility-tracking power of Bollinger Bands (BB) with the hyper-responsive Linear Regression Moving Average (LRMA) to eliminate lag and pinpoint high-probability entries with arrow Signals   Why Hybrid BB-LRMA? Most moving averages are too slow, and Bollinger Bands alone can be noisy. The Hybrid BB-LRMA solves this by using a gradient-based LRMA
Hybrid FATL Fractal: Professional Digital-Signal Logic   Simplify the Complexity of Market Structure.   Unlock the power of digital signal processing combined with price action geometry. The Hybrid FATL Fractal is a professional-grade technical analysis tool designed to eliminate market noise and pinpoint high-probability institutional turning points. By merging the Fast Adaptive Trend Line (FATL) algorithm with Dynamic Fractal Breakout logic, this indicator provides a dual-layered filter that a
VOLUME PROFILE SAF-XII MT5専用プロフェッショナル・マーケットプロファイル分析ツール(グリッドトレードに最適な「ドリーム・インジケーター」) ボリュームプロファイル(価格帯別出来高)とは? ボリュームプロファイルは、従来の「時間軸」の出来高とは異なり、「特定の価格帯」での取引活動を表示するプロ仕様のツールです。選択した期間内の「どこで」取引が行われたかを可視化し、以下のポイントを特定します: バリューエリア (VAH/VAL) :全取引の大部分が行われた価格帯。 ポイント・オブ・コントロール (POC) :最も出来高が集中した単一の価格水準。 リクイディティ・イムバランス :各価格帯における強気(買い)と弱気(売り)の優劣。 サポレジ(支持・抵抗) :実際の取引活動に基づいた自然な価格水準。 3つの動作モード — 「設定したらあとはお任せ」 VP_MANUAL(スイングトレード・重要ライン分析) 垂直ラインをドラッグして分析範囲を手動で設定。 ラインを動かした時のみ再計算されるため軽量。 用途 :指標発表前分析、決算発表、特定の期間分析。 VP_AUTO(スキ
Fisher Transform MTF Pro v4.03 Professional Multi-Timeframe Trading Decision System Fisher Transform MTF Pro turns complex multi-timeframe data into clear, actionable trade decisions in seconds. It answers instantly:  What’s the trend?  Where’s the entry?  How strong is the setup?  What are the risks?  Should I buy, sell, or wait?  The Edge   Zero-Line Filter (Trend Protection) Prevents counter-trend trades by default:  No buys above zero  No sells below zero This forces alignment with th
Turtles Professional v2.0 The Legendary Turtle Strategy, Reimagined for the Modern Trader Turtles Pro transforms the iconic 1980s Turtle Trading System into a high-performance, multi-timeframe decision engine. It eliminates guesswork by providing institutional-grade analysis on trend structure, entry quality, and volatility all on a single chart. The Strategic Edge Turtles Professional uses a Smart Weighted Bias Engine to prioritize higher time frames, ensuring your trades align with the d
Hybrid Hull-LSMA : The Trend Meets Momentum Powerhouse Are you struggling with moving averages that are either too slow to react or too noisy to trust? The Hybrid Hull-LSMA is a solution, engineered to solve the "lag vs. noise" dilemma. By fusing the ultra-smooth Hull Moving Average (HMA) with the predictive Least Squares Moving Average (LSMA), this indicator delivers a high-definition view of market structure and entry timing. Why the Hybrid Hull-LSMA? Standard indicators follow the market; t
Divergent Fisher Transform MT5  Precision Momentum. Intelligent Filtering. EA-Ready Automation. The Divergent Fisher Transform for MT5 is a professional-grade momentum trading indicator designed to help traders answer the most important question in the market: “What should I do right now?” It transforms raw price into high-probability, structured trading decisions using a powerful combination of:  Fisher Transform momentum modeling  Zero-line structural filtering  Multi-level overbought/o
Divergent Stochastic Filter II Catch Reversals Early, Filter Noise, Trade with Confidence The Edge: Why This Stochastic is Different  Every trader knows the Stochastic oscillator. But knowing when to trust its signals, that's the real challenge. The Divergent Stochastic Filter II transforms this classic indicator into a precision reversal detection system by adding critical elements: divergence intelligence, signal filtering and exhaustion detection.  While standard Stochastic oscillators fire s
X-Hybrid Modular Z – 実行インテリジェンス・プラットフォーム あらゆるインジケーターを完全自動売買システムへ X-Hybrid Modular Zは、設計されたカスタムインジケーターを完全な自動売買システムへと変換するモジュール式実行エンジンです。 プロレベルの執行(エグゼキューション)とリスク管理を求めるトレーダーのために設計されており、プログラミング不要で、シグナル発生から機関投資家レベルの取引管理までのギャップを埋めることができます。 このEA(エキスパートアドバイザー)が選ばれる理由 従来のEAとは異なり、単なる「シグナル読み取り機」ではありません。 X-Hybrid Modular Zは、執行プロセスを高度に把握するトレーディング・フレームワークであり、以下の機能を備えています。 適応型スリッページ制御 (ATRおよびスプレッドを考慮) ブローカー挙動プロファイリング (自己学習型執行調整) リトライベースの執行エンジン エントリー間隔フィルター (視覚的なギャップゾーン表示、表示のON/OFF切り替え可能) ブローカー制限レベルの動的検出 (ストップレ
Cumulative Volume Delta (CVD) MA-X Plus:究極のオーダーフロー・フレームワーク CVD MA-X Plus で、市場の隠されたメカニズムを解き明かしましょう。標準的なボリューム指標は「どれだけ取引されたか」を伝えるだけですが、CVD MA-X Plusは、 誰が 戦いに勝っているのか、 いつ 勝っているのか、そして「 スマートマネー 」が どこに 定着しているのかを明らかにします。ティックレベルのプライスアクション(株式/先物/ゴールドなどの規制市場ではリアルボリュームに設定可能)と多層的なボリューム分布を集計することで、このインジケーターは市場の確信、枯渇、そして流動性の極めて鮮明なマップを提供します。これは、こちら( https://www.mql5.com/en/market/product/162375?source=Site+Profile+Seller )にあるCVD MA-Xの進化版です。 トレーダーの優位性:なぜPlus版にアップグレードするのか? 多くのトレーダーが失敗するのは、遅行するプライスアクションに反応してしまうからです。
Hybrid FATL-LRMA : Digital Precision Meets Statistical Certainty The Ultimate Trend-Momentum Convergence System with clear action protocols. Why Hybrid FATL-LRMA? The Edge some Traders Miss Are you tired of lagging indicators that signal entries after the move has already happened? Frustrated by noisy oscillators that keep you in chop while trends pass you by? The Hybrid FATL-LRMA is a dual-engine trading system that bridges the gap between high-frequency digital signal processing and stat
ADX ClrDynamic: The Gradient-Aware, Low-Lag Trend and Momentum ADX/DMI Evolution Tired of lagging indicators that signal a trend only after the move is over? Most ADX indicators are too slow for modern markets. ADX Gradient-Aware solves this by fusing Hull-style low-lag smoothing with a unique Gradient Momentum Logic. This isn't just an indicator; it's a complete decision-engine that identifies trend structure, measures strength, and pinpoints high-probability entries using dual-slope detection.
ADX ClrDynamic  MTF Dashboard: The Ultimate Multi-Timeframe Trend and Momentum Command Center Tired of switching between timeframes to get the full market picture? Most ADX indicators show you only one timeframe at a time, forcing you to piece together the puzzle manually.   ADX ClrDynamic MTF indicator   changes everything by displaying up to 8 timeframes simultaneously in a single, elegant dashboard. This isn't just an indicator; it's your complete multi-timeframe decision-engine that identifi
SERA - Sigma-Enhanced Regression Analysis – The Non-Repaint, Early-Entry MTF Trading System The Problem with Most Regression Tools (And How We Solved It) Traditional regression indicators lie to you. They repaint, they lag, and distort actionable data. Their flaws cost you in false back-tests, late entries/exits and therefore missed profits. Avoid catching a falling knife or chasing a train with SERA, she eliminates ALL three problems. One-Click Trading Style Selection – Choose Conservative, R
合理化された「三色バンド・ロジック (Tri-Color Band Logic)」は、スクイーズ(保合い)検出機能を維持しつつ、プライスアクションの可視性を最優先した設計になっています。 1. 哲学の切り替え:スタイルに合わせたトレード SignalMode 設定により、インジケーターがバンドへのタッチをどのように解釈するかを選択できます。これはあなたの「トレードの性格」に合わせた設定です。 価格が...にタッチした時 ブレイクアウトモード (トレンドフォロー) バウンスモード (逆張り・リバーサル) 自動モード (状況判断) アッパーバンド 買い – 「勢いが加速している、波に乗れ!」 売り – 「価格が伸びきった、逆張りの好機だ!」 価格次第:上で確定=買い / 内側で確定=売り ロワーバンド 売り – 「下落の勢いが強い、飛び乗れ!」 買い – 「売られすぎの反発が来るぞ!」 価格次第:下で確定=売り / 内側で確定=買い SignalMode パラメータは、インジケーターの「思考回路」として機能し、外側バンド(バッファ8および9)との相互作用をどのよう
フィルタ:
レビューなし
レビューに返信