Candle Size in Pips

SizeInPips Indicator – Visualize Candle Size with Ease!

Unlock the power of price action analysis with the SizeInPips Indicator! This simple yet powerful tool is designed for traders who want to quickly measure and visualize the size of each candle (bar) in pips, helping you make informed trading decisions with confidence. Whether you're a beginner or an experienced trader, SizeInPips is the perfect addition to your MetaTrader 5 toolkit.


What Does It Do?

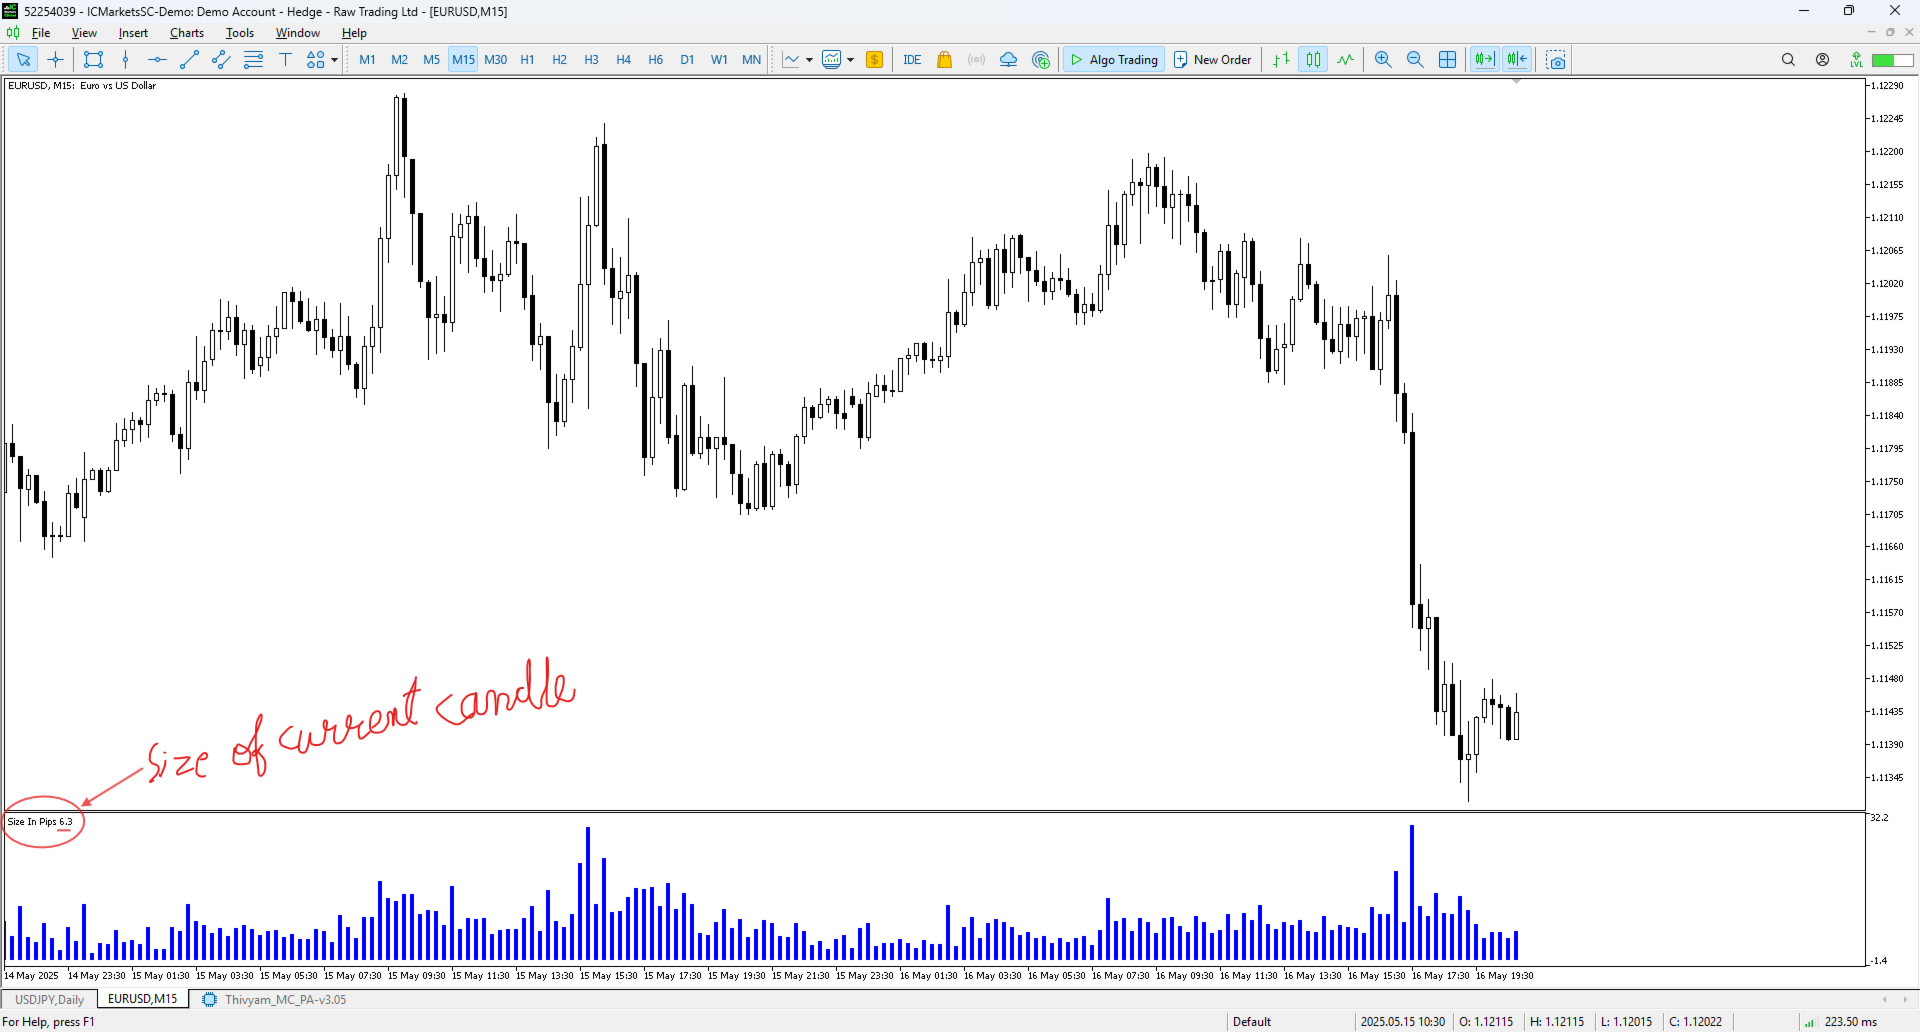
The SizeInPips Indicator calculates the size of each candle (from high to low) in pips and displays it as a clear, easy-to-read histogram in a separate window below your chart. This allows you to instantly assess the volatility and price range of each bar, making it a breeze to incorporate candle size into your trading strategies—whether you're using it as a filter, a signal, or a standalone tool.

Key Features
- Candle Size in Pips: Measures the range of each candle (high minus low) and converts it into pips for precise analysis.
- Histogram Visualization: Plots the candle size as a histogram in a separate indicator window, giving you a quick and visual way to track price movements.
- Universal Compatibility: Works seamlessly on all timeframes (from M1 to MN) and all symbols, including forex, stocks, commodities, and more.
- Lightweight & User-Friendly: Designed to be fast and efficient, with a clean interface that’s easy to understand and use—no complicated setup required!

Why Use SizeInPips?
- Enhance Your Strategy: Use candle size as a filter to confirm trends, identify breakouts, or spot high-volatility periods.
- Make Smarter Decisions: Quickly see how much a candle has moved in pips, helping you gauge market momentum and potential reversals.
- Perfect for All Traders: Whether you're a scalper on the 1-minute chart or a swing trader on the daily chart, SizeInPips adapts to your trading style.
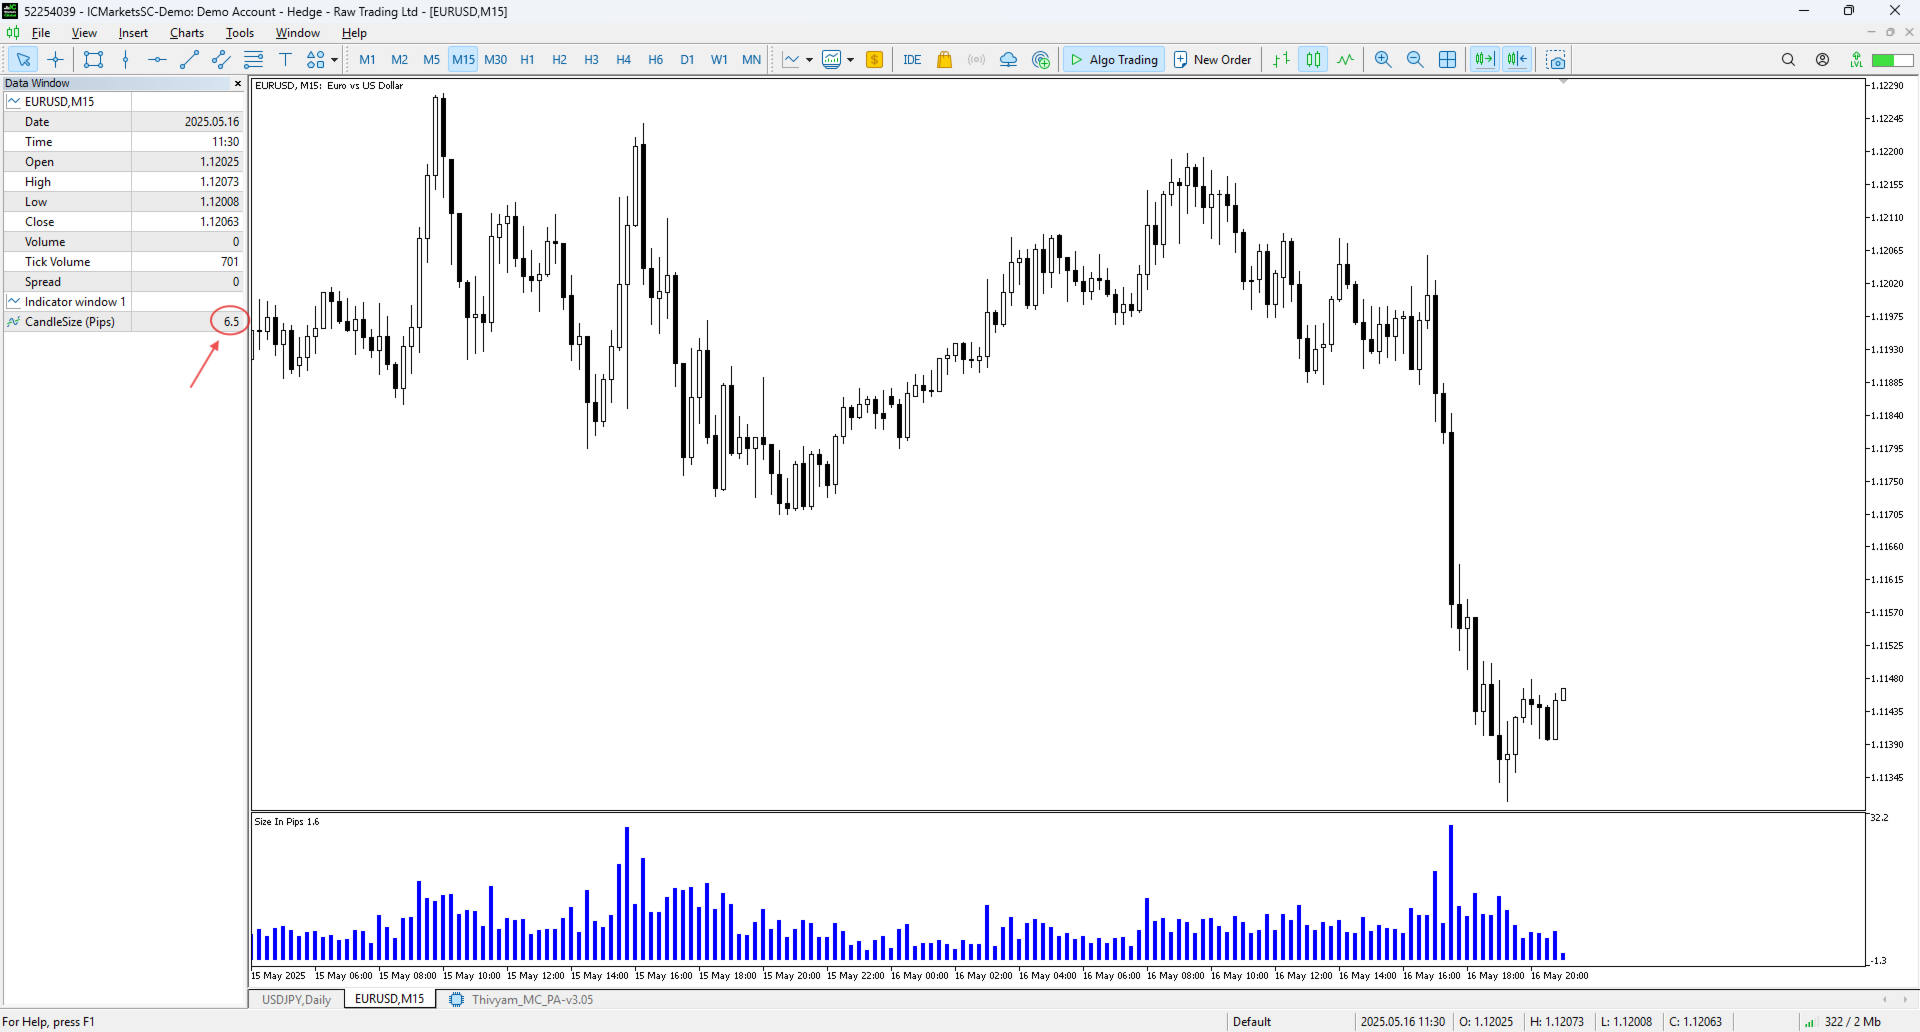
- Data Window Support: View the exact pip size of each candle in the MetaTrader 5 Data Window for deeper analysis.

Version History
- Version 1.00: The first release of SizeInPips, packed with core features like pip size calculation, histogram plotting, and compatibility with all timeframes and symbols.

How to Use It
1. Add the SizeInPips Indicator to your chart in MetaTrader 5.
2. Watch the histogram appear in a separate window, showing the size of each candle in pips.
3. Use the data to filter trades, confirm signals, or analyze market volatility—combine it with your favorite indicators for even better results!

Why Choose SizeInPips?
The SizeInPips Indicator takes the guesswork out of analyzing candle ranges, giving you a clear and visual representation of price action in pips. Its lightweight design ensures it won’t slow down your platform, and its universal compatibility makes it a versatile tool for any market. Start measuring candle sizes like a pro and elevate your trading game today!

Get Started Now!
Download the SizeInPips Indicator and see the difference it makes in your trading. Perfect for traders of all levels, this indicator is your key to understanding price movements with precision and ease.


おすすめのプロダクト
A tool for creating Bill Williams indicators Our tool provides the ability to set Bill Williams indicators on a chart with a mouse click. - The Awesome Oscillator (AO) indicator helps to assess the driving force of the trend. - Alligator indicator — determines the current state of the trend and possible entry and exit points. - Fractals indicator — helps to identify significant levels  - Accelerator Oscillator (AC) indicator — shows the change in trend acceleration. - Market Facilitation Index
FREE
Engulfing Goddess Indicator for MetaTrader 5 Discover the Engulfing Goddess Indicator , a technical analysis tool for MetaTrader 5 (MT5) that helps traders identify engulfing candlestick patterns. This indicator is designed to provide visual signals that correspond to common patterns used in market analysis. The Engulfing Goddess Indicator is built to detect various types of engulfing patterns. It includes a range of optional filters to refine pattern detection, giving you the flexibility to cu
MT5 Session Indicator: Track Global Market Hours with Precision Boost your trading strategy with this FREE Session Indicator for MetaTrader 5 , designed to help you effortlessly identify active trading sessions across global markets. Perfect for forex, stocks, and commodities traders, this tool highlights key market hours (Asian, European, North American, and overlaps) directly on your chart, ensuring you never miss high-liquidity periods. Key Features: Visual Session Overlays : Clear color-c
FREE
マルチタイムフレーム移動平均線インジケーター マルチタイムフレーム移動平均線インジケーターで、市場のトレンドをより深く理解しましょう。この強力なMQL5ツールを使用すると、5つの異なる時間足の移動平均線を1つのチャートに同時に表示できます。複数のインジケーターをワークスペースに表示することなく、さまざまな視点から価格のダイナミクスに関する包括的な洞察を得ることができます。 主な機能: マルチタイムフレーム分析: 1つのチャートに、異なる時間足(例:M15、H1、H4、D1、W1)から最大5つの移動平均線を表示します。 カスタマイズ可能な期間: 表示されるすべての線に対して、希望する移動平均線の期間を簡単に設定できます。 多様なMAタイプ: 単純移動平均 (SMA)、指数移動平均 (EMA)、平滑化移動平均 (SMMA)、線形加重移動平均 (LWMA) など、幅広い移動平均線タイプから選択できます。 調整可能な時間足: 監視したい任意の5つの時間足を選択でき、比類のない柔軟性を提供します。 クリーンな視覚化: 複数のトレンドの視点を一目で確認でき、時間足間の合致点や乖離を特定するのに役立
It is very easy to use the Fibrillar indicator, since the simplest is to look at the chart and act according to the indications of the colored arrows. The algorithm takes into account the measurement of prices, and this method also focuses on measuring each of the price drops (H / C, H / O, LC, LO) - which gives more detailed information, but also more averaged. When calculating this indicator, logarithmic gains are first calculated at the closing price, which allows you to filter out the tren
Candle Timer Countdown to Next Bar is a MetaTrader 5 indicator that displays the remaining time until the current candle closes directly on the chart. The indicator shows a real-time countdown for the active bar. During the final 10 seconds before the candle closes, the timer changes color and blinks to indicate an upcoming bar close. Functionality Displays remaining time until the current bar closes Updates automatically in real time Visual blinking alert during the last 10 seconds of the candl
FREE
Pip Movement Alert MT5で市場のモメンタムを先取りしましょう。この多通貨対応の汎用インジケーターは、複数のシンボルにおける正確なピップの動きを追跡し、トレーダーにアラートを提供するために設計されており、外国為替、株式、暗号通貨、商品取引に最適です。Forex FactoryやRedditのr/Forexなどのトレーディングコミュニティで称賛され、InvestopediaやTradingViewの議論でも急激な市場変動を検出する能力で注目されており、価格の急激な変動を活用しようとするトレーダーにとって必須のツールです。ユーザーは、ピップベースの重要な動き(例:10ピップ単位)を最大95%の信頼性で特定し、リアルタイムアラートを活用してボラティリティの急上昇を捉えることで、取引タイミングが20-30%改善したと報告しています。主な利点には、多通貨モニタリング、カスタマイズ可能なピップ閾値、チャートを常に分析せずに追跡を簡素化する軽量デザインが含まれ、スカルパー、デイトレーダー、スイングトレーダーに最適です。 Pip Movement Alert MT5は、ユーザー定義の
FREE
DhanrangSMC
Dharagauri Niteshkumar Rangani
SMC Indicator for MT5 – Trade Like Institutions Unlock the power of institutional trading with the Smart Money Concepts (SMC) Indicator for MetaTrader 5 . Designed for traders who want to go beyond retail strategies, this advanced tool helps you identify market structure shifts, order blocks, liquidity zones, and fair value gaps with precision and clarity. Key Features: Automatic Market Structure Detection : Instantly spot Breaks of Structure (BOS), CHoCH, and trend shifts. Multi-Timeframe
VSA Smart Money
Eduardo Da Costa Custodio Santos
The VSA Smart Money indicator tracks the movement of professional traders, institutional trades and all compound man movements. The VSA Smart money Indicator reads bar by bar, being an excellent tool for those who use VSA, Wyckoff, PVA and Any other analysis that uses price and volume. There are 10 indications that you will find in your Chart: *On Demand *Climax *UT Thrust *Top Reversal bar *Stop Volume *No Supply *Spring *Reversal Bottom *Shakeout *Bag Holding Using this indicator you will be o
Knowledge of the strength and weakness of each currency is vital for every forex trader. Our   Currency Strength Meter indicator   measures the strength of eight major currencies (USD, EUR, GBP, CHF, JPY, CAD, AUD, NZD) by using the Relative Strength Index indicator, also known as RSI. The Currency Strength Meter indicator shows you, simply and quickly, when a currency is oversold, overbought, or in "normal area". This way, you can identify which currency is the strongest and the weakest. Our
ZIVA TrendX
Hassan Abdullah Hassan Al Balushi
ZIVA TrendX is a professional trend-oriented indicator engineered to provide a clear and structured assessment of market direction through a cloud-based analytical framework. The indicator analyzes price behavior relative to dynamically derived trend boundaries, forming a continuous cloud structure that visually represents the prevailing market bias. This structure enables traders to maintain alignment with dominant directional conditions while filtering short-term market noise. All internal ca
Trade Details Tracker   is a lightweight yet powerful chart-panel designed to give traders instant visibility into their open positions. Instead of checking multiple terminal tabs, this indicator displays   real-time trade statistics directly on the chart , helping you manage risk, monitor exposure, and make faster decisions.   Key Features   Real-Time Trade Overview Instantly view Buy & Sell trade counts for the active symbol.   Automatic Breakeven Calculation Volume-weighted breakeven
FREE
The SMC ICT Indicator integrates the key concepts of Smart Money Concepts and Inner Circle Trader into a practical and precise tool. It displays essential levels and patterns on the chart for clear analysis according to the ICT approach. Optimized for agile processing, it allows smooth backtesting with no repainting, freezes, or delays—ensuring precision and efficiency in your trading. Included Concepts It includes Fair Value Gap (FVG), Order Blocks, Imbalance, Gap, Equal High and Equal Low, a
Candle Close Timer Matrix – MT5 Candle Countdown Indicator Candle Close Timer Matrix is a lightweight and powerful MetaTrader 5 (MT5) candle countdown indicator that shows exactly how many minutes and seconds are left before the current candle closes on any symbol and any timeframe. Live Signals & Products Whether you are a scalper , intraday trader or swing trader , knowing the exact candle close time helps you: Time your entries on candle close Avoid impulsive mid-candle decisions Sync your tr
FREE
Koala Trend Line
Ashkan Hazegh Nikrou
4.33 (6)
コアラトレンドラインがバージョン1.2にアップグレードされました 最終アップグレードの改善:ユーザーがトレンドラインを2番目、3番目、またはX番目の最高点または最低点に接続できるようにする新しいパラメーターが追加されました。 私の要求 : **親愛なるお客様はコアラトレンドラインであなたのレビューをリリースしてください、そしてあなたのフィードバックによって私に改善させてください。 コアラのトレンドラインが無料の指標である理由 無料の指標は適格なツールでなければならないと私は信じています。 他の無料製品についてはどうですか? 緑のコアラのロゴが入った商品はすべて私の無料商品です https://www.mql5.com/en/users/ashkan.nikrou/seller#products コアラトレンドラインの紹介: トレーダーがトレンドをよりよく見つけるのを助けるためにこのインジケーターを作成しました。このインジケーターは現在のトレンドラインを示すことができます。 ご存知のように、トレンドラインは2つの最高点または最低点の間に描画する必要があります。 したがっ
FREE
Xtrade Trend Detector is an indicator capable of finding the best opportunities to take a position in any stock market. Indeed, it is a great tool for scalpers but also for Daytraders. You could therefore use it to identify areas to trade, it fits easily on a chart. I use it to detect trends on Big timeframes and take positions on Small timeframes. Don't hesitate to give me a feedback if you test it.
Congestion Breakout MT5
CARLO FINANCIAL SOFTWARE TECHNOLOGY LLC
3 (1)
Introducing "Congestion Breakout MT5" - the indicator that helps you identify congestion zones in your chart and alerts you when the price breaks through them.   Traders know that congestion zones can be key areas of price action and can indicate potential turning points in the market. However, spotting these zones and anticipating breakouts can be a difficult and time-consuming task. That's where "Congestion Breakout" comes in. This powerful indicator uses advanced algorithms to analyze the pri
Identify Engulfing   candle pattern  with Arrows & Alert ( built-in   RSI filter). This indicator helps you to identify Engulfing candle pattern or Outside bar (OB) on the chart with arrows, along with an alert when a new Engulfing candle appears. Engulfing candle pattern is one of the most important reversal Price Action signals. You can choose between standard Engulfing (Engulfing based on candle body) or non standard Engulfing (Engulfing based on candle high - low ) Alerts can be turned on
Range Bar Pro Indicator for MetaTrader 5 Visualize market trends, levels and other features with Range Bar Pro, an innovative indicator that draws a unique, standalone candle on the right side of any MT5 chart. This single candle is generated from an analysis of price over a specified range, providing you with a powerful snapshot of the market. Key Features: Single-Candle Visualization: Gain quick insights with a single, specially derived candle that reflects comprehensive price movement over a
Engulfing Pattern Indicator Introducing the Engulfing Pattern Indicator! Are you ready to take your trading strategy to the next level? The Engulfing Pattern Indicator is your ultimate tool to spot powerful market reversals and trends based on the time-tested Engulfing Candlestick Pattern. This indicator is crafted to provide you with actionable insights, but remember: it’s not optimized—you have the freedom to optimize it to suit your trading needs! Why the Engulfing Pattern? The Engulfing Pat
Trade Sessions Visualizer – Professional Session Indicator for MT5 Overview Trade Sessions Visualizer is a powerful, lightweight indicator that plots major global trading sessions directly on your chart. Each session is displayed as a clearly colored rectangle spanning its actual high and low prices, with an optional overlap highlighting and customizable labels. Gain instant visual insight into when and where the market is most active—perfect for Forex, indices, commodities, and crypto traders.
Adaptive Trend Lines
Henri Salvatore Bigatti
4.76 (25)
This indicator shows the TLH and TLL and some trendlines that allow us to estimate the trend of market.  It also shows the values of the angles of the lines in percentage in points (pip) , the standard deviation, and the trend of each line, and when it breaks the lines of support and resistance (TLH and TLL). And finally, it also shows the points identified as supports and resistances through the fractal algorithm in the graph. The high and low trend lines are supported by the highs and lows, th
FREE
Trading Signal for MetaTrader5 PC platform The Signal is based on the Investologic EA trend strategy .  Trend following indicator’s and oscillator’s, can work with any symbol or market in MT5 platform    FOREX, GOLD, OIL, STOCKS, INDEXES, NASDAQ SPX500   The strategy the strategy uses multi time frame combination of indicators and  moving averages to find the best entry point wen the fast MA  slow MA Crossover  And Stochastic , RSI  , Average Directional Movement Index ,combined together to
FREE
Easy Buy Sell is a market indicator for opening and closing positions. It becomes easy to track market entries with alerts. It indicates trend reversal points when a price reaches extreme values ​​and the most favorable time to enter the market. it is as effective as a Fibonacci to find a level but it uses different tools such as an algorithm based on ATR indicators and Stochastic Oscillator. You can modify these two parameters as you wish to adapt the settings to the desired period. It cannot
FREE
LZ Candle Timer displays the remaining time before the current bar closes and a new bar forms. It helps you manage entries and exits around candle closes. The indicator uses server time, updates every second, and is optimized for smooth display with minimal CPU use. Feature highlights - Selectable location: place the timer in any of the four chart corners (Upper Left, Upper Right, Lower Left, Lower Right). Offsets and padding are configurable. - Alarm colour: when fewer than X seconds remain
FREE
Previous Candle Levels MT5
Wachinou Lionnel Pyrrhus Sovi Guidi
1 (1)
Previous Candle Levels MT5 shows the previous candle levels, it shows the previous candle Open High Low Close levels (OHLC Levels) in different time frame. It's designed to help the trader to analyse the market and pay attention to the previous candle levels in different time frame.  We all know that the OHLC Levels in Monthly, Weekly and Daily are really strong and must of the time, the price strongly reacts at those levels. In the technical analysis, the user can use them as a support and res
FREE
Unlock the power of trend analysis with the Candle Trend Bars Indicator – your go-to tool for identifying and understanding market trends like never before. This innovative indicator transforms traditional candlestick charts into a dynamic and visually intuitive representation of market trends. Key Features: Trend Clarity: Gain a clear and concise view of market trends with color-coded bars that instantly convey the direction of price movements. User-Friendly Design: The indicator is designed wi
FREE
Range Directional Force Indicator – Designed for You to Optimize! The Range Directional Force Indicator is a cutting-edge tool designed to empower traders by visualizing market dynamics and directional strength. Built to offer insights into market trends and reversals, this indicator is an invaluable asset for traders seeking precision in their strategies. However, it is important to note that this indicator is not optimized, leaving room for you to tailor it to your unique trading preferences.
CRT Pro Dashboard – Multi Timeframe Candle Range Theory Tool CRT Pro Dashboard is a professional multi-timeframe Candle Range Theory (CRT) analysis tool designed for traders who focus on range-based market behavior, liquidity interaction, and structured price expansion . The indicator continuously scans multiple timeframes to detect valid CRT formations , tracks their progression in real time, and displays their status through a clean, intuitive dashboard directly on the chart. What the indic
アナリティクスダッシュボードは、過去と現在の取引を分析し、詳細ビューとして円グラフを追加した分析ダッシュボードを作成するインジケーターです。 分析は主に4つのカテゴリーに分けられます。1)パフォーマンス指標、2)取引行動指標、3)約定品質指標、4)ポジションレベル指標です。 これら4つの一般的な分析指標は、さらに以下のように具体的な指標に分類されています。 パフォーマンス指標: 粗利益 粗損失 全体利益率 全体期待値 全体勝率 平均リスクリワードレシオ 最大ドローダウン 最大ランアップ これらすべてについて、円グラフを用いたチャート形式の指標表示も可能です。 取引行動指標: 総取引数 総勝ち数 総損失数 平均ホールド時間合計 平均取引サイズ SL到達により停止された取引総数 TP到達により停止された取引総数 手動ストップ注文合計 これらの指標は、平均取引サイズを除き、チャート形式でも表示されます。 約定品質指標: 平均スリッページ 平均エントリースプレッド 平均エグジットスプレッド 合計手数料 + スワップ手数料 粗利益への影響 粗損失への影響 これらの指標は、チャー
FREE
このプロダクトを購入した人は以下も購入しています
SuperScalp Pro
Van Minh Nguyen
4.53 (19)
SuperScalp Pro — 高度なマルチフィルター対応スキャルピングインジケーターシステム SuperScalp Pro は、クラシックな Supertrend と複数のインテリジェントな確認フィルターを組み合わせた高度なスキャルピング用インジケーターシステムです。M1〜H4 のすべての時間足で効率的に機能し、特に XAUUSD、BTCUSD、および主要なFX通貨ペアに適しています。単体のシステムとして、また既存の取引戦略へ柔軟に統合して使用できます。 本インジケーターは 11 以上のフィルターを統合しており、短期・長期の EMA、トレンド判定に用いる 3 本の EMA、EMA スロープ(EMA slope)、RSI、ADX、出来高、VWAP、ボリンジャーバンドのブレイクアウト、MACD ダイバージェンスフィルターなどを含みます。スマートキャンドルフィルターはローソク足の終値を確認して弱いシグナルを排除し、3 本の EMA と MACD ダイバージェンスを組み合わせたトレンド認識メカニズムにより勝率の高いシグナルの選別を支援します。 SuperScalp Pro は ATR に基
Entry In The Zone and SMC Multi Timeframe is a real-time 2-in-1 market analysis tool that combines market structure analysis and a No Repaint BUY / SELL signal system into a single indicator, built on Smart Money Concepts (SMC) — a widely adopted framework used by professional traders to understand market structure. This indicator helps you see the market more clearly, make decisions based on structure rather than guesswork, and focus on high-probability zones where price is more likely to react
Azimuth Pro
Ottaviano De Cicco
5 (6)
Azimuth Pro V2:MT5向けシンセティック・フラクタル構造分析と確認済みエントリー 概要 Azimuth Pro は Merkava Labs によるマルチレベルスイング構造インジケーターです。4つのネストされたスイングレイヤー、スイングアンカーVWAP、ABCパターン検出、3タイムフレーム構造フィルタリング、そして確定バーでの確認済みエントリー — 1つのチャートで、ミクロスイングからマクロサイクルまでを網羅するワークフロー。 これはブラインドシグナル製品ではありません。ロケーション、コンテキスト、タイミングを重視するトレーダーのための構造ファーストワークフローです。 V2発売記念オファー — Azimuth Pro V2をUSD 399で(次の100本)。最終価格:USD 499。 1. V2での変更点 シンセティック・マルチタイムフレームエンジン 上位タイムフレーム分析をMeridian Proと同じ独自のシンセティックアーキテクチャで一から再構築。よりクリーンなHTFコンテキスト、安定したライブ動作、従来のMTF同期問題なし。シンセティックエンジンは 固定比率タ
Power Candles – あらゆる市場に対応した強度ベースのエントリーシグナル Power Candles は、Stein Investments が長年培ってきた強度分析を価格チャート上に直接反映します。価格だけに反応するのではなく、各ローソク足は実際の市場の強さに基づいて色分けされ、モメンタムの蓄積、強度の加速、明確なトレンド転換を瞬時に把握できます。 すべての市場に共通する単一ロジック Power Candles は すべての取引シンボル で自動的に動作します。現在のシンボルが Forex か非 Forex 市場かを自動判別し、内部で適切な強度モデルを適用します。 Forex および Gold :FX Power のデルタ値を使用(絶対値レンジ最大 100) 指数、暗号資産、CFD :IX Power の強度値を使用(絶対値レンジ最大 50) 必要な強度計算は Power Candles に直接組み込まれています。ローソク足のカラーリングやシグナルロジックに、追加のインジケーターは不要です。 価格ノイズではなく「強度状態」 各ローソク足は、以下の 9 つの明確に定義された強
このインジケーターを購入された方には、以下の特典を 無料 で提供しています: 各トレードを自動で管理し、ストップロスとテイクプロフィットを設定し、戦略ルールに基づいてポジションを決済する補助ツール 「Bomber Utility」 様々な銘柄に合わせたインジケーターの設定ファイル(セットファイル) 「最小リスク」、「バランスリスク」、「待機戦略」 の3つのモードで使用できる Bomber Utility 用の設定ファイル このトレーディング戦略をすぐに導入・設定・開始できる ステップバイステップのビデオマニュアル ご注意: 上記の特典を受け取るには、MQL5のプライベートメッセージシステムを通じて販売者にご連絡ください。 オリジナルのカスタムインジケーター 「Divergence Bomber(ダイバージェンス・ボンバー)」 をご紹介します。これは、MACDのダイバージェンス(乖離)戦略に基づいた 「オールインワン」型のトレーディングシステム です。 このテクニカルインジケーターの主な目的は、価格とMACDインジケーターの間に発生するダイバージェンスを検出 し、将来の価格の動きを示す
Gold Entry Sniper – ゴールドスキャルピング&スイングトレード用プロフェッショナル多時間足ATRダッシュボード Gold Entry Sniper は、XAUUSDや他の銘柄向けに正確な 売買シグナル を提供する、MetaTrader 5用の高度なインジケーターです。 ATRトレーリングストップロジック と 多時間足分析ダッシュボード を搭載し、スキャルピングからスイングトレードまで対応します。 主な特徴と利点 多時間足シグナル分析 – M1、M5、M15 のトレンドを同時表示。 ATRベースのトレーリングストップ – ボラティリティに応じて動的に調整。 プロ仕様のチャートダッシュボード – シグナル状況、ATRレベル、回帰線、売買方向を表示。 明確な売買マーカー – 自動矢印とテキストラベル。 エグジットアラートとトレード管理 – 利益確定のための自動検出。 完全カスタマイズ可能 – パネル位置、色、フォント、ATR/回帰設定を調整可能。 ゴールド(XAUUSD)に最適化 – M1〜M15のスキャルピングに最適、FXや指数、暗号資産にも対応。 Gold Entry
OmniSync Projection
Antonio-alin Teculescu
5 (1)
Chronos Fractal Engine is an innovative price projection indicator for MetaTrader 5, designed to transform your technical analysis by intelligently identifying and projecting historical price patterns. Built upon an advanced correlation algorithm and the fractal principles of the market, this powerful tool visualizes potential future price movements, giving you a unique edge in your trading decisions. What is Chronos Fractal Engine? At its core, the Chronos Fractal Engine employs a sophisticat
このインジケーターを購入すると、プロ仕様のトレードマネージャーを無料で差し上げます。 まず第一に、このトレーディングシステムがノンリペイント、ノンリドロー、ノンラグのインジケーターであることを強調する価値がある。これにより、手動取引とロボット取引の両方に理想的なものになっています。 オンラインコース、マニュアル、プリセットのダウンロード。 「スマートトレンドトレーディングシステム MT5」は、新規および経験豊富なトレーダー向けにカスタマイズされた包括的なトレーディングソリューションです。10以上のプレミアムインジケーターを組み合わせ、7つ以上の堅実なトレーディング戦略を備えており、多様な市場状況に対応する多目的な選択肢となっています。 トレンドフォロー戦略:トレンドを効果的に乗り越えるための正確なエントリーとストップロス管理を提供します。 リバーサル戦略:潜在的なトレンドの反転を特定し、トレーダーがレンジ相場を活用できるようにします。 スキャルピング戦略:高速で正確なデイトレードおよび短期取引のために設計されています。 安定性:すべてのインジケーターはノンリペイント、ノンリドロー、ノ
トレンド スクリーナー インジケーターでトレンド取引の力を解き放ちます。ファジー ロジックと複数通貨システムを活用した究極のトレンド取引ソリューションです。 ファジー ロジックを活用した革新的なトレンド インジケーターである Trend Screener を使用して、トレンド取引を向上させます。 これは、13 を超えるプレミアム ツールと機能、および 3 つの取引戦略を組み合わせた強力なトレンド追跡インジケーターであり、Metatrader をトレンド アナライザーにする多用途の選択肢となります。 期間限定オファー : トレンド スクリーナー インジケーターは、わずか 100 ドルで生涯ご利用いただけます。 (元の価格 50$ ) (オファー延長) Trend Screener の 100% 非再描画精度の揺るぎない精度を体験して、取引の決定が過去の価格変動の影響を受けないようにしてください。 マルチタイムフレームおよびマルチ通貨機能の多用途性を解放し、比類のない自信を持って外国為替、商品、暗号通貨、インデックスの世界を取引できるようにします。 Trend Screener の包括的な
Meridian Pro
Ottaviano De Cicco
5 (1)
Meridian Pro:MT5用プロフェッショナル・マルチタイムフレーム・トレンドマトリックス 概要 Meridian Pro は Merkava Labs が開発したマルチタイムフレーム・トレンドマトリックスで、方向性の状態、強度、モメンタムの状況、マトリックスの合意をひとつのコンパクトなパネルに集約します。ひとつのアダプティブエンジンがM1からW1まで一貫して適用されます。シンボルごとの調整は不要。インジケーターの積み重ねも不要。すべてのアセットとすべてのタイムフレームをカバーするひとつの構造化された読み取りです。 発売キャンペーン — Meridian Proを USD 99 (導入価格)で入手。通常価格:USD 149 。 1. Meridian Proが他と異なる理由 ひとつのエンジン、バラバラなインジケーターのダッシュボードではない 多くのMTFダッシュボードは、タイムフレームごとに生のインジケーター値を繰り返すだけです。Meridian Proはマトリックス全体でひとつのアダプティブ・トレンドエンジンを使用するため、パネルの各行が同じ構造化フレームワークから導出されます
Quantum TrendPulse を ご紹介します。これは、   SuperTrend   、   RSI   、および Stochastic のパワーを 1 つの包括的なインジケーターに組み合わせて、取引の可能性を最大限に引き出す究極の取引ツールです。精度と効率を求めるトレーダー向けに設計されたこのインジケーターは、市場のトレンド、勢いの変化、最適なエントリー ポイントとエグジット ポイントを自信を持って特定するのに役立ちます。 主な特徴: SuperTrend 統合: 現在の市場動向に簡単に追従し、収益性の波に乗ることができます。 RSI精度: 買われすぎと売られすぎのレベルを検出し、市場の反転のタイミングに最適で、SuperTrendのフィルターとして使用されます。 確率的精度: 確率的振動を活用して、変動の激しい市場で隠れたチャンスを見つけます。SuperTrend のフィルターとして使用されます。 マルチタイムフレーム分析:   M5 から H1 または H4 まで、さまざまなタイムフレームで市場を常に把握します。 カスタマイズ可能なアラート: カスタム取引条件が満たされ
FX Trend NG:次世代マルチマーケット・トレンドインテリジェンス 概要 FX Trend NG は、複数の時間足に対応したプロフェッショナル向けトレンド分析およびマーケット監視ツールです。 市場全体の構造を数秒で把握することができます。 複数のチャートを切り替える必要はありません。どの銘柄がトレンド中なのか、どこでモメンタムが弱まっているのか、そしてどの時間足で強い整合性があるのかを瞬時に確認できます。 ローンチ特別オファー – FX Trend NG を $30(6ヶ月) または $80 永久ライセンス でご利用いただけます。 すでに Stein Investments のユーザーですか? -> メッセージを送信 して、プライベートグループへアクセスしてください。 セットアップや詳細情報が必要ですか? -> Stein Investments 公式ページ をご覧ください。 1. FX Trend NG が他と異なる理由 3ステート・トレンドロジック ― Buy と Sell だけではない • 多くのインジケーターは Buy または Sell の2状態のみを表示します。
BTMM State Engine Pro is a MetaTrader 5 indicator for traders who use the Beat The Market Maker approach: Asian session context, kill zone timing, level progression, peak formation detection, and a multi-pair scanner from a single chart. It combines cycle state logic with a built-in scanner dashboard so you do not need the same tool on many charts at once. What it does Draws the Asian session range; session times can follow broker server offset or be set in inputs. Tracks level progression (L
Gann Made Easy   は、ミスター・ギャンの理論を使用した取引の最良の原則に基づいた、プロフェッショナルで使いやすい外国為替取引システムです。 W・D・ガン。このインジケーターは、ストップロスとテイクプロフィットレベルを含む正確な買いと売りのシグナルを提供します。 PUSH通知を利用して外出先でも取引可能です。 ご購入後、取引方法の説明と優れた追加インジケーターを無料で入手するには、私にご連絡ください! おそらく、ギャンの取引手法についてはすでに何度も聞いたことがあるでしょう。通常、ギャンの理論は初心者のトレーダーだけでなく、すでにある程度の取引経験がある人にとっても非常に複雑なものです。なぜなら、ギャンの取引手法は理論的にはそれほど簡単に適用できるものではないからです。私はその知識を磨き、最良の原則を私の外国為替インジケーターに組み込むために数年を費やしました。 このインジケーターは非常に簡単に適用できます。必要なのは、それをチャートに添付し、簡単な取引推奨事項に従うだけです。このインジケーターは常に市場分析の仕事を行い、取引の機会を探します。適切なエントリーポイントを検
ARICoin is a powerful trading companion designed to generate high-probability entry signals with dynamic TP/SL/DP levels based on volatility. Built-in performance tracking shows win/loss stats, PP1/PP2 hits, and success rates all updated live. Key Features: Buy/Sell signals with adaptive volatility bands Real-time TP/SL/DP levels based on ATR Built-in MA Filter with optional ATR/StdDev volatility Performance stats panel (Success, Profit/Loss, PP1/PP2) Alerts via popup, sound, push, or email Cust
Trend Ai indicatorは、トレンドの識別と実用的なエントリポイントと反転アラートを組み合わせることで、トレーダーの市場分析を強化する優れたツールです。 この指標は、ユーザーが自信と正確さで外国為替市場の複雑さをナビゲートすることを可能にします トレンドAiインジケーターは、主要なシグナル以外にも、プルバックやリトレースメント中に発生するセカンダリエントリポイントを識別し、トレーダーが確立されたトレンド内の価格修正を活用できるようにします。 重要な利点: *MT4およびMT5の仕事 *明確な買いまたは売りシグナル *再描画しません ·すべての資産で動作します 私はeaやセットをtelegram it詐欺で販売しないように注意してください。 すべての設定はここでブログで無料です。  重要! 指示とボーナスを得るために購入後すぐに私に連絡してください! 私の他のプロダクトと同様、実質操作の監視はここに見つけることができます: https://www.mql5.com/en/users/mechanic/seller&nbsp ; 設定および入力: すべての
あなたのシンボルでどの戦略が実際に機能するか確認しましょう - リアルマネーをリスクにさらす前に。 Power Barは、あらゆるシンボルとあらゆるタイムフレームで 極端な価格バー を検出し、3つの異なるトレード戦略を即座にバックテストします。勝率、プロフィットファクター、損益を並べて比較できます。すべてが1つのインタラクティブなパネルに集約されています。 推測なし。カーブフィッティングなし。データだけです。 Power Barが特別な理由 ほとんどのインジケーターはシグナルを出すだけで、それが機能するかどうかは推測に任されます。Power Barはさらに先を行きます - すべてのシグナルを 3つの戦略 に対してテストし、統計を表示します。FlipFlop、Momentum、Reversalをワンクリックで切り替え、数値が即座に変化するのを確認できます。 FlipFlop - 常にポジションを保有。シグナルでエントリーし、反対シグナルでイグジット。当社のリサーチでは、US30、US500、DAXなどのトレンドのあるインデックスで最も効果的です。 Momentum - シグナルの方向に
まず第一に、この取引ツールはノンリペイント、ノンリドロー、ノンラグの指標であり、プロの取引に理想的ですことを強調する価値があります。 オンラインコース、ユーザーマニュアル、デモ。 スマートプライスアクションコンセプトインジケーターは、新米から経験豊富なトレーダーまで、非常 に強力なツールです。Inner Circle Trader AnalysisやSmart Money Concepts Trading Strategiesなど、20以上の有用な指標を1つに組み合わせています。このインジケーターはスマートマネーコンセプトに焦点を当て、大手機関の取引方法を提供し、彼らの動きを予測するのに役立ちます。 特に、流動性分析に優れており、機関がどのように取引しているかを理解しやすくしています。市場のトレンドを予測し、価格の動きを慎重に分析するのに優れています。機関の戦略とトレードを合わせることで、市場の動向についてより正確な予測ができます。このインジケーターは多目的であり、市場構造を分析し、重要な注文ブロックを特定し、さまざまなパターンを認識するのに優れています。 このインジケーター
Crystal Heikin Ashi Signals - Professional Trend & Signal Detection Indicator Advanced Heikin Ashi Visualization with Intelligent Signal System for Manual & Automated Trading Final Price: $149 ---------> Price goes up $10 after every 10 sales . Limited slots available — act fast . Overview Crystal Heikin Ashi Signals is a professional-grade MetaTrader 5 indicator that combines pure Heikin Ashi candle visualization with an advanced momentum-shift detection system. Designed for both manual traders
FX Power: 通貨の強弱を分析して、より賢い取引を実現 概要 FX Power は主要通貨と金の実際の強弱をあらゆる市場状況で理解するための必須ツールです。強い通貨を買い、弱い通貨を売ることで、 FX Power は取引の意思決定を簡素化し、高い確率の取引機会を見出します。トレンドを追従する場合でも、極端なデルタ値を使用して反転を予測する場合でも、このツールはあなたの取引スタイルに完全に適応します。ただ取引するだけではなく、 FX Power で賢く取引をしましょう。 1. なぜ FX Power がトレーダーにとって非常に有益なのか 通貨と金のリアルタイム強弱分析 • FX Power は主要通貨と金の相対的な強弱を計算し、マーケットダイナミクスに関する明確な洞察を提供します。 • どの資産がリードしているか、または後れを取っているかを監視して、取引するペアを賢く選びましょう。 マルチタイムフレームの包括的なビュー • 短期、中期、長期のタイムフレームで通貨と金の強弱を追跡し、マーケットトレンドに基づいて取引戦略を調整できます。 • スキャルピングからスイングトレード
Auto Optimized Parabolic RSI: 高度な3Dモメンタムエンジン ほとんどのリテール向けインジケーターは、市場のボラティリティが変化した瞬間に破綻する静的な入力値に依存しているため、失敗に終わります。Auto Optimized Parabolic RSIは、自らの数学的優位性を継続的に再計算することで「インジケーターの陳腐化」問題を解決し、機関投資家レベルの定量的適応力をMT5ターミナルに直接もたらします。 最大の強み: カスタムインメモリ3D最適化 標準的な自動最適化ツールは、インジケーターの呼び出しで端末に過負荷をかけるため、頻繁にMT5プラットフォームをフリーズさせます。本ツールは、このボトルネックを完全に回避しています。RAMベースのカスタムネイティブ計算機を内蔵した内部エンジンは、チャートを読み込んだりタイムフレームを変更したりするたびに、超高速の3Dグリッド探索を実行します。RSI期間(頻度)、SARステップ(加速度)、SAR最大値(制限速度)を同時にスイープし、プラットフォームを遅延させることなく、数万通りものパラメーターの組み合わせを絶対的なミ
まず第一に、この取引インジケーターは再描画されず、再描画されず、遅延しないことを強調する価値があります。これにより、手動取引とロボット取引の両方に理想的なものになります。 ユーザーマニュアル:設定、入力、戦略。 アトミックアナリストは、価格の強さとモメンタムを利用して市場でより良いエッジを見つけるためのPA価格アクションインジケーターです。ノイズや誤ったシグナルを除去し、取引ポテンシャルを高めるための高度なフィルターを備えています。複雑なインジケーターの複数のレイヤーを使用して、アトミックアナリストはチャートをスキャンし、複雑な数学的計算をシンプルなシグナルと色に変換します。これにより、どのような初心者トレーダーでも理解して使用し、一貫した取引の決定を行うことができます。 「アトミックアナリスト」は、新規および経験豊富なトレーダー向けにカスタマイズされた包括的な取引ソリューションです。プレミアムインジケーターとトップノッチの機能を1つの取引戦略に組み合わせ、すべてのタイプのトレーダーにとって汎用性のある選択肢にします。 デイリートレーディングとスキャルピング戦略:高速で正確なデイ
Bill Williams Advanced is designed for automatic chart analysis using Bill Williams' "Profitunity" system. The indicator analyzes four timeframes at once. Manual (Be sure to read before purchasing) Advantages 1. Analyzes the chart using Bill Williams' "Profitunity" system. Signals are displayed in a table in the corner of the screen and on the price chart. 2. Finds all known AO and AC signals, as well as zone signals. Equipped with a trend filter based on the Alligator. 3. Finds "Divergence Bar
Smart Stop Indicator – チャート上で実現するインテリジェントなストップロス精度 概要 Smart Stop Indicator は、ストップロスを勘や感情ではなく、明確で体系的に設定したいトレーダーのために設計されています。本ツールは、クラシックなプライスアクション(高値更新・安値切り下げ)と最新のブレイクアウト認識ロジックを組み合わせ、次に来るべき論理的なストップレベルを正確に特定します。トレンド相場、レンジ、急速なブレイクアウト局面のいずれであっても、最適な SL ゾーンとその状態(“new”、“broken”、“valid”)をチャート上に直接表示します。さらに今回、SL 距離の %ADR 表示も新たに追加されています。 主な特徴 マーケット構造に基づく自動ストップ配置 • 市場構造とリアルタイムの値動きに基づき、意味のあるストップロスレベルを自動検出します。 スマートなブレイクアウト感知 • 急激な方向転換やブレイクアウトにも柔軟に対応し、早すぎるストップ調整を避けます。 SL %ADR の表示 • ストップロスまでの距離を ADR(Averag
Introducing Indicator for PainX and GainX Indices Traders on Weltrade Get ready to experience the power of trading with our indicator, specifically designed for Weltrade   broker's PainX and GainX Indices.  Advanced Strategies for Unbeatable Insights Our indicator employs sophisticated strategies to analyze market trends, pinpointing optimal entry and exit points.  Optimized for Maximum Performance To ensure optimal results, our indicator is carefully calibrated for 5-minute timeframe charts on
RelicusRoad Pro: 定量的市場オペレーティングシステム 【期間限定】無制限アクセス 70% OFF - 2,000人超のトレーダーと共に なぜ多くのトレーダーは「完璧な」インジケーターを使っても失敗するのでしょうか? それは、文脈を無視して 単一の概念 だけでトレードしているからです。文脈のないシグナルは単なるギャンブルです。勝ち続けるには、 根拠の重なり(コンフルエンス) が必要です。 RelicusRoad Proは単なる矢印インジケーターではありません。完全な 定量的市場エコシステム です。独自のボラティリティモデリングを用いて、価格が推移する「適正価値の道(Fair Value Road)」をマッピングし、ノイズと真の構造的ブレイクを判別します。 推測はやめましょう。機関投資家レベルの「ロード・ロジック」でトレードを。 コアエンジン:「Road」アルゴリズム システムの中心となる Road Algo は、市場環境にリアルタイムで適応するダイナミックなボラティリティチャネルです。 安全ライン(平衡点) と、価格が数学的に反転しやすい 拡張レベル を投影します。 Si
Berma Bands
Muhammad Elbermawi
5 (8)
Berma Bands (BBs) インジケーターは、市場のトレンドを特定して活用したいトレーダーにとって貴重なツールです。価格と BBs の関係を分析することで、トレーダーは市場がトレンド段階にあるか、レンジ段階にあるかを判断できます。 詳細については、[ Berma Home Blog ] をご覧ください。 バーマ バンドは、上部バーマ バンド、中部バーマ バンド、下部バーマ バンドの 3 つの異なる線で構成されています。これらの線は価格の周りにプロットされ、全体的な傾向に対する価格の動きを視覚的に表します。これらのバンド間の距離から、ボラティリティや潜在的な傾向の反転についての洞察を得ることができます。 バーマ バンドの線がそれぞれ離れると、市場が横ばいまたはレンジ相場の期間に入っていることを示すことがよくあります。これは、明確な方向性の偏りがないことを示しています。トレーダーは、これらの期間中にトレンドを特定するのが難しいと感じる可能性があり、より明確なトレンドが出現するまで待つ場合があります。 バーマ バンドの線が 1 本の線に収束すると、強いトレンド環境の兆候となること
ARIPoint is a powerful trading companion designed to generate high-probability entry signals with dynamic TP/SL/DP levels based on volatility. Built-in performance tracking shows win/loss stats, PP1/PP2 hits, and success rates all updated live. Key Features: Buy/Sell signals with adaptive volatility bands Real-time TP/SL/DP levels based on ATR Built-in MA Filter with optional ATR/StdDev volatility Performance stats panel (Success, Profit/Loss, PP1/PP2) Alerts via popup, sound, push, or email Cu
現在33%オフ 初心者にもエキスパートトレーダーにも最適なソリューション このインジケーターは独自の機能と新しい公式を多数内蔵しており、ユニークで高品質かつ手頃な取引ツールです。このアップデートでは、2つの時間枠ゾーンを表示できるようになります。より長いTFだけでなく、チャートTFとより長いTF(ネストゾーンを表示)の両方を表示できます。すべてのSupply Demandトレーダーの皆さんのお気に召すはずです。:) 重要情報の公開 Advanced Supply Demandの可能性を最大化するには、 https://www.mql5.com/ja/blogs/post/720245 にアクセスしてください。   エントリーまたはターゲットの正確なトリガーポイントを正確に特定できれば取引がどのように改善されるか想像してみてください。新しい基盤となるアルゴリズムに基づいて構築されているため、買い手と売り手の間の潜在的な不均衡をさらに簡単に特定できます。これは、最も強い需要と供給のゾーンと、過去のパフォーマンス(古いゾーンを表示)がグラフィカルに表現されるためです。これらの機能は、最適な
トレンドトレーディング は、タイミングのプルバックとブレイクアウトにより、市場で起こっているトレンドから可能な限り利益を得るように設計された指標です。確立されたトレンドの中で価格が何をしているかを分析することにより、取引の機会を見つけます。 [ インストールガイド | 更新ガイド | トラブルシューティング | よくある質問 | すべての製品 ] 自信を持って効率的に金融市場を取引する むち打ちにならずに確立されたトレンドから利益を得る 収益性の高いプルバック、ブレイクアウト、早期の逆転を認識する この指標は、独自の品質とパフォーマンスを分析します 複数時間枠のダッシュボードを実装します インジケーターは再描画されていません 電子メール/音声/視覚アラートを実装します 確立されたトレンドは多くの取引機会を提供しますが、ほとんどのトレンド指標はそれらを完全に無視しています。インジケーターの解釈はかなり簡単です: (1) トレンドの変化 (2) トレンドの方向への後退 (3) トレンドの方向へのブレイクアウト 赤いダッシュ は下降トレンド中の修正です 青いダッシュ は上昇トレンド中
フィルタ:
レビューなし
レビューに返信