ChannelSignals Indicator

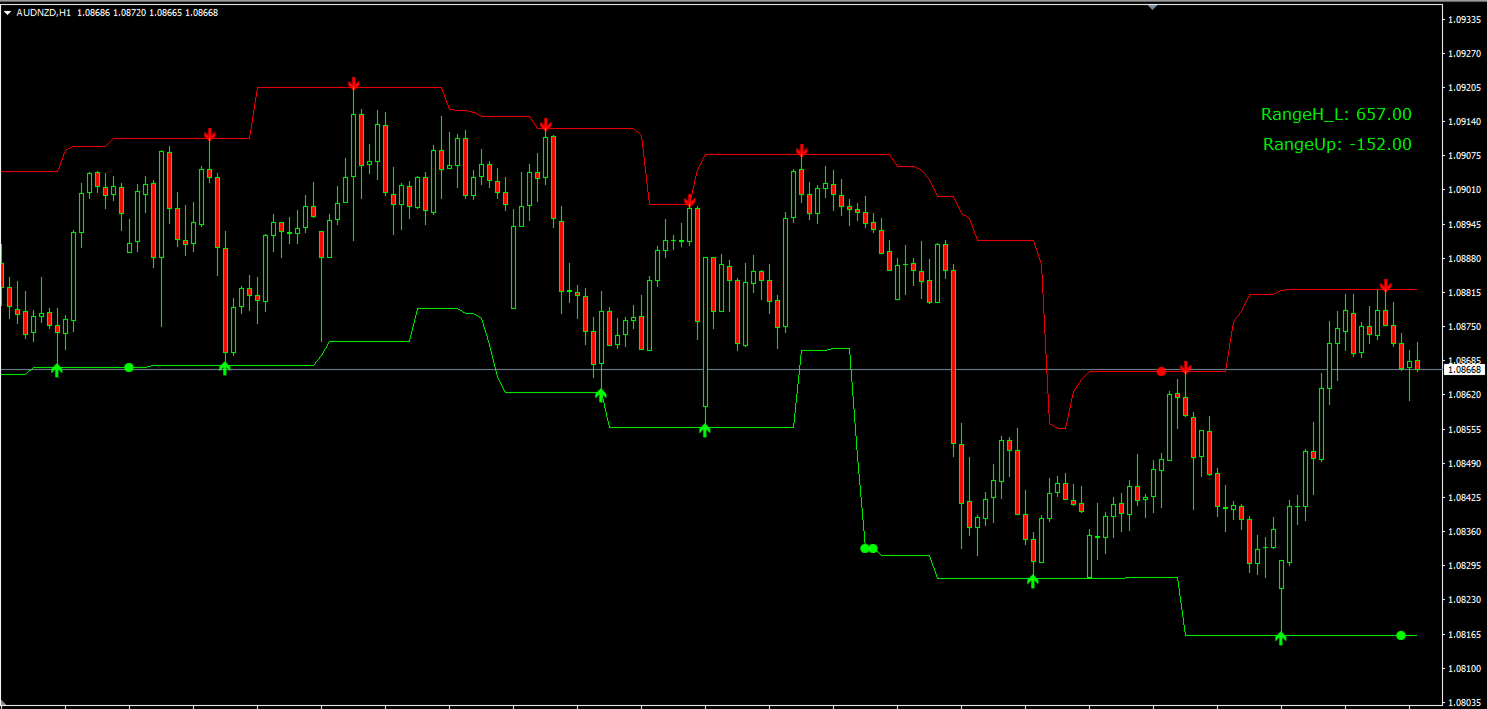
Our modernized version of the popular channel TMA_TRUE  indicator for MT4, which provides information on the main points of trend reversal and momentum exhaustion by drawing a channel on the chart, also draws arrows of signals for buy and sell. As a result, traders can identify bullish and bearish price reversal zones and BUY and SELL accordingly.

This indicator works well on all instruments and on all Timeframes.

This indicator is the basis of our Channel Trigger EA, which you can buy in MQL5:


You can also purchase our Universal Arrow EA, which can work with various arrow indicators, including this ChannelSignals Indicator, or any other that meets the technical requirements for their use in this EA:

https://www.mql5.com/ru/market/product/135506?source=Site+Market+MT4+Search+Rating006%3aUniversal+Arrow+EA


おすすめのプロダクト
Shadow Flare インジケーターは、MetaTrader 4 向けの 非リペイント型トレンド&流動性ツール です。設定可能な移動平均ベースライン(HMA / EMA / SMA / RMA から選択)を計算し、その上下に ATR(Average True Range)エンベロープを巻き付けることで、価格が上側または下側バンドを終値で明確に抜けたときだけ反転する「粘着型(スティッキー)」トレンド状態を生成します。同じトレンドエンジンが自動サプライ・デマンドゾーンモジュールも駆動し、ピボットハイ/ピボットローを検出してその周囲に色付きボックスを描画し、価格が終値ベースでゾーンを抜けた瞬間にそのゾーンをミティゲート(無効化)します。 トレンド状態が反転したバーで買い・売りシグナルが発生し、オプションのボリュームフィルターと RSI フィルターにより、弱いエントリーやモメンタムに逆行するエントリーをブロックできます。内蔵ダッシュボードはリアルタイムでトレンドバイアス、モメンタム(RSI ベース)、ボリューム状態を表示します。ポップアップ、サウンド、モバイルプッシュ、メールからなるフルア
FREE
SR indicator
Alexander Chertnik
5 (3)
SR is a support and resistance indicator, it shows major highs and lows by different colors. The color of a level is changing if the last high or low are touching it. After the closing of a bar above or below level, it will delete it. extern inputs: loop for candles / colors / drawing time *This indicator signal is not perfect and have to be used with other market analysis and confirmations.
FREE
COLORED TREND MA / MACD CANDLES draw MA Candles above/below Moving Average in a single color draw MA as a leading Line like a Supertrend draw MA as a Channel => MA High and Low draw MACD Candles above and below 0 and Signal-Line Your  Advantage: a simple view of the trend direction a simple view over the higher trend direction a calmer chart for the eye clear rules can be defined Settings: Bars to process : 6000 is my default, this value is up to you Value Quick-Set : pre-Settings MACD 12 / 26
FREE
Th3Eng HistoMaster  indicator Free Histogram Indicator to detect the current trend direction. The indicator is based on CCI indicator. Also draw arrows when it detect the trend is strong buy or strong sell, with Alerting system (Popup with sound, Email alerting and mobile notification). Also draws a dashboard shows all Time-Frames' current signal. Requirements works with all pairs, stocks, CFDs and crypto currencies. works with all Spreads works with all Account types works on all Time-Frames
FREE
The Pivot Indicator is a vital tool for technical analysis used by traders in the financial markets. Designed to assist in identifying potential reversal points or trend changes, this indicator provides valuable insights into key levels in the market. Key features of the Pivot Indicator include: Automatic Calculations: The Pivot Indicator automatically calculates Pivot Point, Support, and Resistance levels based on the previous period's high, low, and close prices. This eliminates the complexity
FREE
Description: This indicator draw ZigZag Line in multiple time frame also search for Harmonic patterns before completion of the pattern. Features: Five instances of ZigZag indicators can be configured to any desired timeframe and inputs. Draw Harmonic pattern before pattern completion. Display Fibonacci retracement ratios. Configurable Fibonacci retracement ratios. Draw AB=CD based on Fibonacci retracement you define. You can define margin of error allowed in Harmonic or Fibonacci calculations
FREE
This scanner shows the trend values of the well known indicator SuperTrend for up to 30 instruments and 8 time frames. You can get alerts via MT4, Email and Push-Notification as soon as the direction of the trend changes. This is the FREE version of the indicator: SuperTrend Scanner The free version works only on EURUSD and GBPUSD! Important Information How you can maximize the potential of the scanner, please read here: www.mql5.com/en/blogs/post/718074 With the following FREE indicator you c
FREE
Accuracy Meter
Ashkan Hazegh Nikrou
5 (2)
精度メーターの紹介: 精度メーターは、戦略の勝率を決定する強力なツールであり、メタトレーダー戦略テスターのようなすべてのトレードのエントリーポイントとエグジットポイントを示します。チャート上のインジケーターとしてシンプルなストラテジーテスターを使用し、さまざまなペアとタイムフレームにアタッチして調べることができます。戦略の正確さのパーセンテージ、ストップロスとリスクを報酬要素に変更し、それがトレーディングのアイデアにどのように影響するかを確認します。 Accuracy Meterはシンプルな戦略テスターです。この製品は、戦略テスターと同じチャート上の戦略の入口と出口にアクセスするのに役立ちます。この製品を使用すると、コストを節約し、不利益なEAを構築するためにお金を無駄にすることがありません。 よくある質問 : どのように私はこの指標に私の戦略を定義できますか? 精度メーターには、カスタムインジケーターのパスと名前を調整できる入力設定があり、買いバッファーと売りバッファーの番号も定義できます。 以下の設定を使用できます。     カスタム指標名     バッファ番号を購入
FREE
This classic "old school" MAGIC MACD indicator gives you the cross of the parameters you set. Standart setting is (12,26,9) . The arrows give you a possible change of trend. Be careful and do not use this indicator as a single signal source. FREE version  Please feel free to check out our other REX indicator series. We do have other free indicators.     "OLD BUT GOLD"
FREE
Absolute Bands
Aleksey Ivanov
4.67 (3)
Principles of construction of the indicator.               The Absolute Bands (AB) indicator is reminiscent of the Bollinger Bands indicator with its appearance and functions, but only more effective for trading due to the significantly smaller number of false signals issued to them. This effectiveness of the Absolute Bands indicator is due to its robust nature.               In the Bollinger Bands indicator, on both sides of the moving average - Ma, there are lines spaced from Ma by the standa
FREE
The indicator displays signals according to the strategy of Bill Williams on the chart. Demo version of the indicator has the same features as the paid, except that it can work only on a demo account . Signal "First Wise Man" is formed when there is a divergent bar with angulation.  Bullish divergent bar - with lower minimum and closing price in the upper half. Bearish divergent bar - higher maximum and the closing price at the bottom half. Angulation is formed when all three lines of Alligator
FREE
This is a Multi-Time-Frame Zigzag indicator You can change parameters of Zigzag, include Zigzag Depth, Zigzag Deviation, Zigzag Backstep. You can choose which Time Frame to display Zigzag by turn ShowXXX to true or false (ShowXXX = ShowM1, ShowM5, ShowM15...). Noted: Lower Time Frame Zigzag will not display on Higher Time Frame. Example: Your current Time Frame is H1, you can not see Zigzag of M1 to M30 even you turn them on.
Auto Fibonacci Retracement Indicator — Flexible and Reliable This is not just another Auto Fibonacci Retracement indicator — it’s one of the most flexible and dependable tools available . If you find it useful, please leave a review or comment to support the project. Check out my other helpful tools below: Timeframes Trend Scanner    - Scan the trend of assets in difference timeframes with multiple indicators Market Trend Scanner   - Scan the trend of multiple-assets in with multiple indicators
FREE
Looking for entry points along the local trend without repaint! Arrows indicate entry points. Based on classic indicators. The indicator is easy to use. Settings Наименование Описание Frequency factor Signal frequency. The less, the more often. This affects the quality. Recommendations Recommended for use on major currency pairs. Timeframe from m5, m15, m30 Subscribe to my telegram channel, where we discuss intraday trading, ideas, indicators, etc., a link in my profile contacts.
FREE
"GoldMinerRobot SI 2" is an indicator that is not displayed, but is one of the most important analytical arms of "GoldMinerRobot".  This indicator is free. You can find more information about how this indicator works in the section "MQL5 Market" and section "Experts" and "GoldMinerRobot". "Gold Miner Robot" is specially designed and built for trading on gold (XAUUSD) in MetaTrader 4.
FREE
特別オファー : ALL TOOLS 、各 $35 で提供中! New tools   will be   $30   for the   first week   or the   first 3 purchases !  Trading Tools Channel on MQL5 : Join my MQL5 channel to update the latest news from me Volume Zones Internal Visualizer Multi-Timeframe は、上位足チャートを見ながら下位足のボリューム動向を詳細に把握するための最適なソリューションです。マルチタイムフレーム機能をサポートし、強力かつ直感的にボリューム分析を行いたい方には最適です! MT5バージョンはこちら:  Volume Zones Internal Visualizer MT5 Multi TF その他の製品はこちら:   All P roducts Why Choose Volume Zones Internal Visualizer Multi-Timeframe? 上位足
Fibomathe for MT4
Almaquio Ferreira De Souza Junior
Fibomathe Indicator: Support and Resistance Tool for MT4 The Fibomathe Indicator is a technical analysis tool designed for MetaTrader 4 (MT4) that assists traders in identifying support and resistance levels, take-profit zones, and additional price projection areas. It is suitable for traders who use structured approaches to analyze price action and manage trades. Key Features Support and Resistance Levels: Allows users to define and adjust support and resistance levels directly on the chart. L
FREE
STRUCTURAL TREND LINES - MT4 Indicator Simple indicator that automatically draws trend lines based on market structure. Features: - 3 degrees of structure detection (short, medium, long term) - Configurable swing strength for each degree - Single color per degree for clean visualization - Adjustable number of lines per degree - Customizable colors and line widths How it works: The indicator identifies swing highs and lows based on the strength parameter, then connects these points to create t
FREE
BeST_ Classic Pivot Points is an MT4 Indicator that is based on the widely known and definitely classic Pivot Point of a market prices activity. A pivot point is calculated as an average of significant prices (high,low,close) from the performance of a market in the prior trading period. If the market in the following period trades above the pivot point it is usually evaluated as a bullish sentiment, whereas trading below the pivot point is seen as bearish. A pivot point and the associated suppo
FREE
This is a regression tree indicator for MT4/MT5. This indicator classificate nodes on the time period so that the deviation becomes smaller, and displays regression line and channel for each node. It's free! Attached CartDemo.ex4 and CartDemo.ex5 is a Demo version and has the following limitations: Can't use HighSpeed method (default method is RandomForest) Maximum number of bars is 260 (increase from 200) There is no expiration date and can be started many times, but it stops after an hour.
FREE
Peak Trough Analysis is the great tool to detect peaks and troughs in your chart. Peak Trough Analysis tool can use three different peaks and troughs detection algorithm. The three algorithm include the orignal Fractals Indicator by Bill Williams, the Modified Fractals indicator and ZigZag indicator. You can use this peak and trough analysis tool to detect the price pattern made up from Equilibrium Fractal-Wave process. For further usage, there are good guide line on how to use this peak trough
FREE
Raymond Cloudy Day Indicator for MT4 – Pivot-Based Reversal and Trend Levels Raymond Cloudy Day Indicator is a pivot-based level indicator for MetaTrader 4 (MT4). It was developed by Ngo The Hung based on Raymond’s original idea and is designed to give a structured view of potential reversal zones, trend extensions and support/resistance levels directly on the chart. The default settings are optimised for XAUUSD on the H1 timeframe, but the indicator can be tested and adjusted for other symbols
The "MACD Trend Follower" is an indicator based on the MACD oscillator. It serves to spot the trend direction by giving it a fixed color until the trend changes (the trend direction colors are customizable). The default MACD settings for the indicator has been changed to adapt to the fast moving Forex market, but they can be changed to suit the trader. Recommended settings for the indicator : - MACD Fast EMA : 8 Periods. - MACD Slow EMA : 13 Periods. - MACD SMA : 5 Periods. Indicator inputs :
FREE
Crystal Heikin Ashi – 高度な視覚化 Heikin Ashi (MT4 バージョン) 概要 Crystal Heikin Ashi for MetaTrader 4 はプロフェッショナル向けの Heikin Ashi インジケーターで、チャートの視覚化を強化し、プライスアクショントレーダーやスキャルパー、アナリストに明確さを提供します。 この MT4 バージョンは、純粋な Heikin Ashi ローソク足に焦点を当て、軽量かつ高速なパフォーマンスを実現します。 注: トレンドカラーリングと高度なモメンタム検出は MT5 バージョンにのみ搭載されています: MT5 バージョン → https://www.mql5.com/en/market/product/142042 主な機能 (MT4) ネイティブ Heikin Ashi ローソク足。 ブル/ベアの色をカスタマイズ可能。 標準ローソク足を非表示にするオプション。 ライト/ダークテーマに対応。 長期ヒストリーでも高速処理。 価格の流れや反転を明確に表示。 パラメータ ローソク足スタイル: 標準。 チャートテーマ:
FREE
GBP INDEX The Currency Index Project is ONE part of a thorough Forex study. Many people do not know the theoretical basis that drives currency exchange rates to move on the market. With this set of tools you will be able to have a more complete view of the entire market by analyzing not only the single currency of an exchange, but all the exchange rates that make up that currency by looking at a single window! The indicator faithfully represents the real index of a single currency present in a
FREE
Pivot Points are a classic technical analysis indicator that calculates the central pivot point (PP) as well as support (S1–S3) and resistance (R1–R3) levels based on the previous day’s High, Low, and Close. The indicator allows you to: • identify key zones where the price may bounce or break through • determine the direction of the trend • find good entry points, as well as set stop loss and take profit levels Indicator settings: • enable/disable PP, R1/S1, R2/S2, R3/S3 • enable/disable price l
FREE
With this system you can spot high-probability trades in direction of strong trends. You can profit from stop hunt moves initiated by the smart money! Important Information How you can maximize the potential of the scanner, please read here: www.mql5.com/en/blogs/post/718109 Please read also the blog about the usage of the indicator: Professional Trading With Strong Momentum This FREE Version of the indicator works only on EURUSD and GBPUSD. The full version of the indicator can be found here:
FREE
QualifiedEngulfing - は ProEngulfing インジケーターの無料版です。 ProEngulfing - は Advance Engulf インジケーターの有料版で、 こちらからダウンロードできます。 ProEngulfing の無料版と有料版の違いは何ですか?無料版は1日に1つのシグナルの制限があります。 QualifiedEngulfingをご紹介します - あなたのMT4用のプロフェッショナルエンゴルフパターンインジケーター Precisionの力を解放して、QualifiedEngulfingを使用して外国為替市場での資格のあるエンゴルフパターンを特定および強調する先進的なインジケーターです。MetaTrader 4用に開発されたQualifiedEngulfingは、外国為替市場のエンゴルフパターンを確認およびハイライトするために設計された切り立ったアプローチを提供し、取引の決定に対して最も信頼性の高いシグナルのみを受け取ることを確認します。 QualifiedEngulfingの動作方法: QualifiedEngulfingは、エンゴルフパター
FREE
StrikePin
Mike Pascal Plavonil
1 (1)
The StrikePin indicator is a technical, analytical tool designed to identify trend reversals and find optimal market entries.  The StrikePin indicator is based on the pin bar pattern, which is the Price Action reversal pattern. An entry signal, in a trending market, can offer a very high-probability entry and a good risk to reward scenario. Be careful: the indicator is repainting since it is looking for highest high and lowest lows.  You should avoid to use it in experts but you can use it in
FREE
Updates 9/12/2023 - If you are looking for the Spock EA, I don't sell it anymore. DM me for more info. 24/10/2023  -  Check out my other products. Starting to roll out some EAs & indicators based on this range. Currently there is no MT5 version. I am using MT4 myself. So I will spend my time mostly to develop more extensive stats for the Stats version and maybe even an EA. But I might  develop a MT5 version. All depends on the demand. Meaning, the more people request it, the bigger the chan
FREE
このプロダクトを購入した人は以下も購入しています
Neuro Poseidon is a new indicator by Daria Rezueva. It combines precise trading signals with adaptive TP/SL levels - creating best possible trades as a result! Message me and get  Neuro Poseidon Assistant  as a gift to automize your trading process! What makes it stand out? 1. Proven profitability on all assets and timeframes 2. Only confirmed BUY and SELL signals present on the chart 3. Adaptive TP & SL levels generated by the software for each trade 4. Easy to understand - suitable for all
M1 SNIPER は使いやすいトレーディングインジケーターシステムです。M1時間足向けに設計された矢印インジケーターです。M1時間足でのスキャルピングのためのスタンドアロンシステムとして、また既存のトレーディングシステムの一部としても使用できます。このトレーディングシステムはM1時間足での取引に特化して設計されていますが、他の時間足でも使用できます。元々、この手法はXAUUSDとBTCUSDの取引用に設計しましたが、他の市場においても役立つと考えています。 インジケーターのシグナルは、トレンドの方向と逆方向に取引できます。インジケーターのシグナルを利用して両方向に取引するのに役立つ特別な取引テクニックをご紹介します。この手法は、特別な動的なサポートとレジスタンスの価格帯を利用することに基づいています。 ご購入後、M1 SNIPER矢印インジケーターをすぐにダウンロードできます。さらに、M1 SNIPERツールのすべてのユーザーに、以下のスクリーンショットに表示されているApollo Dynamic SRインジケーターを無料で提供しています。この2つのインジケーターを組み合わせることで
Gann Made Easy は、ミスター・ギャンの理論を使用した取引の最良の原則に基づいた、プロフェッショナルで使いやすい外国為替取引システムです。 W・D・ガン。このインジケーターは、ストップロスとテイクプロフィットレベルを含む正確な買いと売りのシグナルを提供します。 PUSH通知を利用して外出先でも取引可能です。 ご購入後、取引方法の説明と優れた追加インジケーターを無料で入手するには、私にご連絡ください! おそらく、ギャンの取引手法についてはすでに何度も聞いたことがあるでしょう。通常、ギャンの理論は初心者のトレーダーだけでなく、すでにある程度の取引経験がある人にとっても非常に複雑なものです。なぜなら、ギャンの取引手法は理論的にはそれほど簡単に適用できるものではないからです。私はその知識を磨き、最良の原則を私の外国為替インジケーターに組み込むために数年を費やしました。 このインジケーターは非常に簡単に適用できます。必要なのは、それをチャートに添付し、簡単な取引推奨事項に従うだけです。このインジケーターは常に市場分析の仕事を行い、取引の機会を探します。適切なエントリーポイントを検出す
Dynamic Forex28 Navigator - 次世代の Forex 取引ツール。 現在 49% オフ。 Dynamic Forex28 Navigator は、長年人気のインジケーターを進化させたもので、3 つの機能を 1 つにまとめています。 Advanced Currency Strength28 インジケーター (レビュー 695 件)  + Advanced Currency IMPULSE with ALERT (レビュー 520 件) + CS28 コンボ シグナル (ボーナス)。 インジケーターの詳細 https://www.mql5.com/en/blogs/post/758844 次世代の Strength インジケーターが提供するもの  オリジナルで気に入っていたすべての機能が、新機能と精度の向上によって強化されました。 主な機能: 独自の通貨強度計算式。 すべての時間枠でスムーズかつ正確な強度ライン。 トレンドの特定と正確なエントリーに最適です。 ダイナミックマーケットフィボナッチレベル (マーケットフィボナッチ)。 このインジケーターに固有
Scalper Inside PRO Scalper Inside PRO は、MetaTrader 4 向けの短期トレンドおよびスキャルピング用インジケーターです。独自アルゴリズムを用いて、市場の方向性と主要なターゲットレベルを素早く検出します。エントリー、イグジット、複数の利確ターゲットを自動計算し、詳細なパフォーマンス統計を表示することで、さまざまな銘柄やストラテジーがどのように機能してきたかを確認できます。これにより、現在のマーケットコンディションに最も適した取引銘柄を選択するのに役立ちます。さらに、Scalper Inside PRO には、お使いの矢印インジケーターを簡単に接続でき、その統計と過去のパフォーマンスを素早く評価できます。 本インジケーターは、あらゆる銘柄と時間足で動作し(短期トレードには M5 を推奨)、複数の内蔵ストラテジーを備えています。そのため、単体のスキャルピングツールとしても、トレーディングシステム内の強力な分析コンポーネントとしても活用できます。 主な機能 独自アルゴリズム(Next‑Generation Trend Detection Algor
Enigmera
Ivan Stefanov
5 (8)
ENIGMERA: 市場の中心 重要:MQL5.comのデモはStrategy Testerで実行されており、Enigmeraの機能を完全には反映していない場合があります。詳細については、説明、スクリーンショット、ビデオをご確認ください。質問があれば、遠慮なくメッセージを送ってください! インジケーターのコードは完全に書き直されました。バージョン3.0は新機能を追加し、インジケーターの開始以来蓄積されたバグを修正しました。 紹介 このインジケーターとトレーディングシステムは、金融市場への注目すべきアプローチです。ENIGMERAはフラクタルサイクルを使用して、サポートとレジスタンスのレベルを正確に計算します。真の蓄積フェーズを示し、方向と目標を提供します。トレンドでも修正でも機能するシステムです。 動作方法 インジケーターのほとんどの機能は、チャートの左側にあるボタンで制御され、市場の状況に迅速に対応できるようになっています。 ボタン ON/OFF – インジケーター全体を表示または非表示にします。 Channel – サポートチャネルを有効にし、許容範囲の偏差を示します。 Dev
多くの矢印インジケーターは、シグナルだけを表示して、その後の判断はすべてトレーダー任せです。KT Alpha Hunter Arrows は、最初から完成されたトレードプランを提供します。 各シグナル矢印が表示されると、エントリーライン、ストップロス、4つのテイクプロフィット水準、そして現在の銘柄と時間足を今トレードする価値があるかを示すリアルタイムのエッジ判定が、チャート上にまとめて描画されます。付属の Trade Manager EA は、手動でエントリーした後の管理をサポートし、相場が荒れて感情が揺れやすい場面でも、トレードの規律を保ちやすくします。リペイントなし。確定足のみでシグナルを表示。Forex、ゴールド、指数、その他あなたが取引するあらゆる銘柄向けに設計されています。 主な機能 リペイントしない買い・売り矢印。シグナルは足が確定した後にのみ表示されます。 各シグナルにエントリーライン、構造的なストップロス、4つのテイクプロフィット水準を表示。 Edge Dashboard が、現在のチャート上で買いと売りのセットアップを個別に評価。 判定システム:No Edge、Ma
Trend Catcher ind
Ramil Minniakhmetov
5 (2)
トレンドキャッチャーインジケーター トレンドキャッチャーインジケーターは、開発者独自の適応型トレンド分析指標を組み合わせることで、市場価格の動きを分析します。短期的なノイズを除去し、根底にあるモメンタムの強さ、ボラティリティの拡大、価格構造の挙動に焦点を当てることで、真の市場方向性を特定します。また、移動平均線、RSI、ボラティリティフィルターなどの平滑化およびトレンドフィルタリング機能を備えたカスタマイズ指標も使用します。 実際の運用状況のモニタリングやその他の製品については、こちらをご覧ください: https://www.mql5.com/en/users/mechanic/seller ご注意ください。私はTelegramでEAや設定を販売していません。詐欺です。すべての設定はブログで無料で公開しています。 重要!ご購入後すぐにご連絡ください。手順とボーナスをお送りします!
PRO Renko Systemは、特別にRENKOチャートを取引するために設計された高精度の取引システムです。 これは、様々な取引商品に適用することができる普遍的なシステムです。 システムは効果的に正確な逆転信号へのアクセスを与えるいわゆる市場の騒音を中和する。 表示器は非常に使いやすく、信号の生成に責任がある1つの変数だけがあります。 あなたは簡単にお好みの任意の取引ツールとレンコバーのサイズにツールを適応させることができます。 私はいつもあなたが私のソフトウェアで収益性の高い取引を支援するために余分なサポートを提供する準備ができています! 私はあなたに幸せで収益性の高い取引をしたいです! ご購入後にご連絡ください! 私はあなたに私のレンコチャートジェネレータを送信します。 私はまた、私の個人的な推奨事項やシステムの他のモジュールを無料で共有します!
トレンドラインプロ   市場の真の方向転換点を理解するのに役立ちます。この指標は、真のトレンド反転と主要プレーヤーが再び参入するポイントを示します。 分かりますか     BOSライン   複雑な設定や不要なノイズなしに、より長い時間足でのトレンドの変化と重要なレベルを把握できます。シグナルは再描画されず、バーが閉じた後もチャート上に残ります。 VERSION MT 5     -     RFI LEVELS PRO インジケーター と組み合わせることで、その潜在能力を最大限に発揮します。 インジケーターが示す内容: 本当の変化   トレンド(BOSライン) 一度シグナルが現れたら、それは有効です!これは、リペイント機能を持つインジケーターとの重要な違いです。リペイント機能を持つインジケーターは、シグナルを発した後、それを変更し、資金の損失につながる可能性があります。これにより、より高い確率と精度で市場に参入できます。また、矢印が現れた後、目標値(利益確定)に達するか、反転シグナルが現れるまで、ローソク足の色を変更する機能もあります。 繰り返しエントリ       主要プレーヤーの
Genesis Matrix Pro is a professional multi-timeframe trend detection indicator designed to help traders identify high-quality market alignment with clarity and structure. It combines 12 different technical indicators into one visual alignment matrix, allowing traders to quickly see when market conditions are bullish, bearish, or neutral. A signal is generated only when the selected strategies are aligned, helping reduce noise and improve decision-making. PLEASE CONTACT ME AFTER PURCHASE TO GET
この製品は 2026 年の市場向けに更新され、最新の MT5 ビルドに最適化されています。 価格更新のお知らせ: Smart Trend Trading System は現在 $99 で提供されています。 次の 30 件の購入 後、価格は $199 に上がります。 特別オファー: Smart Trend Trading System を購入後、私にプライベートメッセージを送ることで、 Smart Universal EA を無料 で受け取り、Smart Trend のシグナルを自動売買に変えることができます。 Smart Trend Trading System は、リペイントなし、再描画なし、遅延なしの完全なトレーディングシステムです。よりクリーンなシグナル、より明確なトレンド方向、そしてより整理された取引方法を求めるトレーダー向けに作られています。 Online course , manual and download presets . このシステムは、トレンド検出、反転ゾーン、Smart Cloud、トレーリングストップロジック、サポートとレジスタンス、ローソク足の色分け、ア
トレンドトレーディング は、タイミングのプルバックとブレイクアウトにより、市場で起こっているトレンドから可能な限り利益を得るように設計された指標です。確立されたトレンドの中で価格が何をしているかを分析することにより、取引の機会を見つけます。 [ インストールガイド | 更新ガイド | トラブルシューティング | よくある質問 | すべての製品 ] 自信を持って効率的に金融市場を取引する むち打ちにならずに確立されたトレンドから利益を得る 収益性の高いプルバック、ブレイクアウト、早期の逆転を認識する この指標は、独自の品質とパフォーマンスを分析します 複数時間枠のダッシュボードを実装します インジケーターは再描画されていません 電子メール/音声/視覚アラートを実装します 確立されたトレンドは多くの取引機会を提供しますが、ほとんどのトレンド指標はそれらを完全に無視しています。インジケーターの解釈はかなり簡単です: (1) トレンドの変化 (2) トレンドの方向への後退 (3) トレンドの方向へのブレイクアウト 赤いダッシュ は下降トレンド中の修正です 青いダッシュ は上昇トレンド中
Step into the world of Forex trading with confidence, clarity, and precision using   Gold Indicator   a next-generation tool engineered to take your trading performance to the next level. Whether you’re a seasoned professional or just beginning your journey in the currency markets, Gold Indicator equips you with powerful insights and help you trade smarter, not harder. Built on the proven synergy of three advanced indicators, Gold Indicator focuses exclusively on medium and long-term trends eli
スイングトレーディング は、トレンドの方向のスイングと可能な反転スイングを検出するように設計された最初のインジケーターです。トレーディングの文献で広く説明されているベースラインスイングトレーディングアプローチを使用します。インディケータは、いくつかの価格と時間のベクトルを調査して、全体的なトレンドの方向を追跡し、市場が売られ過ぎまたは買われ過ぎて修正の準備ができている状況を検出します。 [ インストールガイド | 更新ガイド | トラブルシューティング | よくある質問 | すべての製品 ] むち打ちを起こさずに市場スイングの利益 インジケーターは常にトレンドの方向を表示します 色付きの価格帯は機会のベースラインを表します 色付きのダッシュは、可能な反転スイングを表します この指標は、独自の品質とパフォーマンスを分析します 複数時間枠のダッシュボードを実装します カスタマイズ可能なトレンドおよびスイング期間 電子メール/サウンド/プッシュアラートを実装します インジケータは再描画またはバックペインティングではありません Swing Tradingとは Swing Tradingは
Current event:  https://c.mql5.com/1/326/A2SR2025_NoMusic.gif A. A2SR とは何ですか ?   * 先行テクニカル指標です (塗り直しなし、ラグなし)。 -- ガイダンス : -- https://www.mql5.com/en/blogs/post/734748/page4#comment_16532516 -- そして https://www.mql5.com/en/users/yohana/blog A2SR には、サポート (需要) とレジスタンス (供給) のレベルを決定する特別な手法があります。 ネットで見かける通常の方法とは異なり、A2SR は実際の SR レベルを決定する独自のコンセプトを持っています。 元の手法はインターネットから取得されたものではなく、インターネット上で公開されたこともありません。 A2SR は、取引スタイルに応じて SR レベルを自動選択します。 時間枠を変更しても、SR レベルはその位置にとどまります。 実際のSRは、使用する時間枠から取得されるわけではないため. A2SR
BTMM State Engine Pro is a MetaTrader 4 indicator for traders who use the Beat The Market Maker approach: Asian session context, kill zone timing, level progression, peak formation detection, and a multi-pair scanner from a single chart. It combines cycle state logic with a built-in scanner dashboard so you do not need the same tool on many charts at once. What it does Draws the Asian session range; session times can follow broker server offset or be set in inputs. Tracks level progression (L
「 Dynamic Scalper System 」インジケーターは、トレンド波の中でスキャルピング取引を行う手法のために設計されています。 主要通貨ペアと金でテスト済みで、他の取引商品との互換性があります。 トレンドに沿った短期的なポジションオープンのシグナルを提供し、追加の価格変動サポートも提供します。 インジケーターの原理 大きな矢印はトレンドの方向を決定します。 トレンド波の中では、小さな矢印の形でスキャルピングシグナルを生成するアルゴリズムが機能します。 赤い矢印は強気方向、青い矢印は弱気方向です。 トレンドの方向には敏感な価格変動ラインが描かれ、小さな矢印のシグナルと連動します。 シグナルは次のように機能します。適切なタイミングでラインが現れるとエントリーシグナルが形成され、ラインが開いている間はポジションが保持され、完了すると取引が終了します。 推奨される動作時間枠はM1~H4です。 矢印は現在のローソク足に形成され、次のローソク足が開いている場合は、前のローソク足の矢印は再描画されません。 入力パラメータ Trend Wave Period - トレンド方向
Price & Time Market Structure Indicator A professional market structure tool that analyzes waves through both price and time — not price alone. Main Description NeoWave PRO is a professional market structure indicator for MetaTrader 4 designed for traders who want to move beyond traditional one-dimensional wave tools such as ZigZag, swing indicators, and basic high/low systems. Most wave indicators analyze only one thing: Price. But a real market wave is not only a price movement. A true wave de
MonsterDash Harmonic Indicator is a harmonic pattern dashboard. It recognizes all major patterns. MonsterDash is a dashboard that displays all detected patterns for all symbols and (almost) all timeframes in sortable and scrollable format. Users can add their own user defined patterns . MonsterDash can open and update charts with the pattern found. Settings MonsterDash's default settings are good enough most of the time. Feel free to fine tune them to your needs. The color settings are for thos
Apollo SR Master は、サポート/レジスタンスゾーンを利用した取引をより容易かつ確実にする特別な機能を備えたサポート/レジスタンスインジケーターです。このインジケーターは、ローカル価格の高値と安値を検出することで、タイムラグなしでリアルタイムにサポート/レジスタンスゾーンを計算します。そして、新たに形成されたSRゾーンを確認するために、インジケーターは特別なシグナルを表示します。このシグナルは、SRゾーンを実際の売りまたは買いシグナルとして考慮して使用できることを示します。この場合、SRゾーンの強度が高まり、SRエリアからの取引が成功する確率も高まります。これがこのインジケーターの基本的な考え方です。 SRゾーンは、ストップロスとテイクプロフィットの設定を容易にします。シグナルの方向に応じて、SRゾーンの上または下のスペースをストップロスとして設定できます。さらに、反対側のSRゾーンは、潜在的なテイクプロフィットエリアとして設定できます。 また、Apollo SRマスターインジケーターをご利用のすべてのユーザーには、「Apollo Price Action System」
現在40%オフ 初心者やエキスパートトレーダーに最適なソリューション! このインジケーターは、独自の機能と新しい計算式を取り入れた、ユニークで高品質、かつ手頃な価格のトレーディングツールです。たった1枚のチャートで28の為替ペアの通貨強度を読み取ることができます。新しいトレンドやスキャルピングチャンスの引き金となるポイントを正確に特定することができるので、あなたのトレードがどのように改善されるか想像してみてください。 ユーザーマニュアルはこちら  https://www.mql5.com/en/blogs/post/697384 これが最初の1本、オリジナルだ! 価値のないクローンを買わないでください。 特別な サブウィンドウの矢印で強い通貨の勢いを表示 GAPがあなたのトレードを導く! 基準通貨や気配値が売られすぎ・買われすぎのゾーン(外相フィボナッチレベル)にあるとき、個別チャートのメインウィンドウに警告表示。 通貨がレンジの外側から反落した場合、プルバック/リバーサルのアラート。 クロスパターンの特別なアラート 複数の時間枠を選択可能で、トレンドを素早く確認できます
Auto Optimized Parabolic RSI: 高度な3Dモメンタムエンジン ほとんどのリテール向けインジケーターは、市場のボラティリティが変化した瞬間に破綻する静的な入力値に依存しているため、失敗に終わります。Auto Optimized Parabolic RSIは、自らの数学的優位性を継続的に再計算することで「インジケーターの陳腐化」問題を解決し、機関投資家レベルの定量的適応力をMT5ターミナルに直接もたらします。 最大の強み: カスタムインメモリ3D最適化   標準的な自動最適化ツールは、インジケーターの呼び出しで端末に過負荷をかけるため、頻繁にMT5プラットフォームをフリーズさせます。本ツールは、このボトルネックを完全に回避しています。RAMベースのカスタムネイティブ計算機を内蔵した内部エンジンは、チャートを読み込んだりタイムフレームを変更したりするたびに、超高速の3Dグリッド探索を実行します。RSI期間(頻度)、SARステップ(加速度)、SAR最大値(制限速度)を同時にスイープし、プラットフォームを遅延させることなく、数万通りものパラメーターの組み合わせを絶対的
Advanced Supply Demand
Bernhard Schweigert
4.91 (300)
現在40%オフ 初心者にもエキスパートトレーダーにも最適なソリューション このインジケーターは独自の機能と新しい公式を多数内蔵しており、ユニークで高品質かつ手頃な取引ツールです。このアップデートでは、2つの時間枠ゾーンを表示できるようになります。より長いTFだけでなく、チャートTFとより長いTF(ネストゾーンを表示)の両方を表示できます。すべてのSupply Demandトレーダーの皆さんのお気に召すはずです。:) 重要情報の公開 Advanced Supply Demandの可能性を最大化するには、 https://www.mql5.com/ja/blogs/post/720245 にアクセスしてください。   エントリーまたはターゲットの正確なトリガーポイントを正確に特定できれば取引がどのように改善されるか想像してみてください。新しい基盤となるアルゴリズムに基づいて構築されているため、買い手と売り手の間の潜在的な不均衡をさらに簡単に特定できます。これは、最も強い需要と供給のゾーンと、過去のパフォーマンス(古いゾーンを表示)がグラフィカルに表現されるためです。これらの機能は、最適な
このインジケーターは、エリオット波動理論と組み合わせて作動し、2つの方法で使用されます: 自動モード: このモードでは、インジケーターがチャート上の全ての5つのモーティブ波を自動的に検出し、予測とポテンシャルな逆転ゾーンを提供します。また、アラートやプッシュメッセージを生成する能力も備えています。この自動機能により、エリオット波動パターンの識別と分析のプロセスが効率化されます。 手動モード: このオプションは、エリオット波動理論を手動で扱いたいトレーダー向けです。9つの段階を使用して波を描画することができます。各段階は、表示された後に描画されたラインを調整して個別に定義できます。この機能により、手動で波を描画するプロセスがより効率的になります。重要な点として、すべての描画データが将来の参照のためにプラットフォームのデータフォルダに保存されることに注意してください。 パラメータ: Name: インジケーターの名前。 Use_System_Visuals: インジケーターのテーマを有効または無効にして、取引プラットフォーム全体の外観に合わせます。 Explain_Comment: 波の番号
Introduction to Fractal Pattern Scanner Fractal Indicator refers to the technical indicator that makes use of the fractal geometry found in the financial market. Fractal Pattern Scanner is the advanced Fractal Indicator that brings the latest trading technology after the extensive research and development work in the fractal geometry in the financial market. The most important feature in Fractal Pattern Scanner is the ability to measure the turning point probability as well as the trend probabi
Send us a message after your purchase to receive more information on how to get your  BONUS  for FREE  that works in great combination with Bull vs Bear ! Bull versus Bear is an easy-to-use Forex indicator that gives traders clear and accurate signals based on clear trend retests . Forget about lagging indicators or staring at charts for hours because  Bull vs Bear provides real-time entries with no lag and no repaint, so you can trade with confidence. Bull vs Bear  helps you enter trades during
Scalper Vault は、スキャルピングを成功させるために必要なすべてを提供するプロフェッショナルなスキャルピング システムです。このインジケーターは、外国為替およびバイナリー オプションのトレーダーが使用できる完全な取引システムです。推奨される時間枠は M5 です。 システムは、トレンドの方向に正確な矢印シグナルを提供します。また、トップとボトムのシグナルとギャン マーケット レベルも提供します。 インジケーターは、プッシュ通知を含むすべてのタイプのアラートを提供します。 インジケータの購入後にご連絡ください。私の個人的な取引の推奨事項と素晴らしいボーナス指標を無料で共有します! 幸せで有益な取引をお祈りします!
The Propfolio Master Suite is the ultimate all-in-one analytical workstation for professional traders. Combining the power of the Beat The Market Maker (BTMM) methodology, Smart Money Concepts (SND/Liquidity), and Advanced Volume Profile, this suite replaces multiple different indicators with one optimized engine. Monitor up to 14 pairs simultaneously from a single chart, instantly identify market cycles, and seamlessly map institutional footprints with the click of a button. The Command Center
Introduction Harmonic Patterns are best used to predict potential turning point. Traditionally, Harmonic Pattern was identified manually connecting peaks and troughs points in the chart. Manual harmonic pattern detection is painfully tedious and not suitable for everyone. You are often exposed under subjective pattern identification with manual pattern detection. To avoid these limitations, Harmonic Pattern Plus was designed to automate your harmonic pattern detection process. The functionality
作者のその他のプロダクト
The TMA Centered Bands Indicator for MT5 draws bands on the chart and shows the overall price trend. It displays three bands - the lower and upper boundaries of the channel and the median.   The bands are made up of moving averages, and each of them has an MA period. The name TMA comes from triangular moving averages, as the indicator draws triangular bands.   The price will fluctuate between these ranges whenever the trend changes direction, thus creating entry and exit points.   How to trade
FREE
This universal advisor is based on its own Algorithm, which is an incredibly effective tool due to the simultaneous operation of a trading strategy based on our  Indicator " Channel Sgnals ProfRoboTrading" and our proprietary signal filter system together with the Martingale method, which together work out a very interesting hedging system. Traders are also given the opportunity to set up their own risk management system with two filters to control deposit drawdowns . The advisor's algorithm is
The Channel Sgnals ProfRoboTrading Indicator for MT5 is an effective Forex trading tool designed to track market movements.   The MT5 signal point indicator effectively detects trend reversals after they have already occurred. This Indicator   is a fully automated technical tool that includes a number of parameters to track market trends.   It automatically examines the ever-changing price dynamics of the market, compares the information with earlier data and generates a trading signal. Because
FREE
Bollinger Bands Stop Indicator holds significant importance for traders navigating the complex world of financial markets. Its relevance lies in several key aspects. Firstly, it aids in trend identification. By analyzing price movements relative to the Bollinger Bands, traders can discern whether the market is in an uptrend, downtrend, or ranging phase. Secondly, the indicator provides valuable insights into market volatility. Wider bands indicate higher volatility, while narrower bands suggest
FREE
The Extreme Spike PRT Indicator   is an effective tool for identifying   sharp market fluctuations .   It performs its calculations using the ATR (Average True Range) indicator and displays candles with extreme volatility in two categories:   primary spikes   and   secondary spikes , within the Metatrader platform oscillator window. This tool assists traders in detecting   intense price movements   and conducting more precise   analyses   based on these fluctuations. Time Frame 15-minute - 1-ho
The TrendOscillator Indicator is an upgraded version of the traditional Stochastic Oscillator.   It comprises two lines: %K and %D.   The %K line represents the current market position.   In contrast, the %D line is a moving average of the %K line used to generate signals and identify potential entry or exit points. The good thing is the indicator works on all timeframes like the traditional Stochastic.   However, to avoid any false signals, applying the indicator on longer timeframes is better
FREE
Regression_Channel_mod Indicator that expands our standard linear regression channel by adding support and resistance lines. Easy to integrate into other indicators. The linear regression channel consists of several parallel lines equidistant from the upper and lower part of the linear regression trend line. The distance between the channel boundaries and the regression line is equal to the deviation of the maximum closing price from the regression line.
The TrendChannelTracker Indicator is an innovative Forex trading tool. This indicator, which is based on the standard Stochastic Oscillator, provides traders with a unique and simplified method for observing market trends. In contrast to the traditional Stochastic Oscillator, which is shown at the bottom of the chart, the TrendChannelTracker Indicator is built into the price action itself. This removes the need for traders to continually switch their attention between the oscillator and the pri
FREE
The Kalires Channel Indicator is a technical indicator used to evaluate trend direction and potential trading opportunities. This is a hybrid indicator that combines Kauffman Adaptive Moving Average (KAMA), linear regression and smoothing. The Kalires Channel Indicator consists of two lines: one central and two outer bands. The central line is a smoothed KAMA modified according to the direction of the trend. The outer bars represent two linear regression lines drawn above and below the center l
FREE
The TMA Centered Bands indicator for MT4 draws bands on the chart and reports the overall price trend, as well as gives arrows signals to buy and sell when the bar closes outside the channel. Unlike many TMAs, our version uses the calculation part of the algorithm without redrawing, and also adds the ability to select a symbol. The bands are made up of moving averages, and each of them has an MA period. The name TMA comes from triangular moving averages, as the indicator draws triangular bands
FREE
The Forex Gangster Indicator allows you to determine the current trend. If the Forex Gangster Indicator line has moved below the price and turned blue, then you should open deals for an increase. If the Forex Gangster Indicator line has appeared above the price and turned red, then you should open deals for a decrease: The indicator is suitable for any time frames, but it needs to be supplemented with filtering indicators, since by itself it is late and does not have time to give an accurate si
FREE
The Red Dragons Support and Resistance Levels indicator automatically determines support and resistance levels using the proprietary algorithm based on historical and current data, so the levels are dynamic, which allows you to adjust trading targets based on the current price movement. For this reason, we use this indicator in our advisors, for example, Red Dragons, which you can purchase here: https://www.mql5.com/en/market/product/128713?source=Site +Market+MT4+New+Rating006 The panel also
FREE
This indicator works by plotting fractals on the chart as arrows that can be used as buy or sell signals. It is a great tool for both new and experienced traders as it provides a clear visual representation of the market and helps traders identify fractals. Although it repaints, it can be used quite effectively in conjunction with other tools to filter trading strategies. We use this indicator in this way in our RoyalFractals II Expert Advisor, which you can purchase on the MQL5 Market: https:
FREE
The Teamtrader Channel Stop indicator allows you to determine the current trend. If the Teamtrader Channel Stop indicator line has moved below the price and turned blue, then you should open deals for an increase. If the Teamtrader Channel Stop indicator line has appeared above the price and turned red, then you should open deals for a decrease: The indicator is suitable for any time frames, but it needs to be supplemented with filtering indicators, since by itself it is late and does not have
FREE
This indicator works by plotting fractals on the chart as arrows that can be used as buy or sell signals. It is a great tool for both new and experienced traders as it provides a clear visual representation of the market and helps traders identify fractals. Although it repaints, it can be used quite effectively in conjunction with other tools to filter trading strategies. We use this indicator in this way in our Royal Fractals EA, which you can purchase on the MQL5 Market: https://www.mql5.com
FREE
The BandsFill Indicator is a modified Bollinger Bands with a colored cloud.   It has two adjustable parameters: Period Deviation The cloud is colored as follows: If the price crosses the upper band, the cloud is blue. If the price crosses the lower band, the cloud is pink.   Thanks to this, the BandsFill Indicator provides traders with an easy opportunity to detect various features and patterns in price dynamics that are invisible to the naked eye. Based on this information, traders can predict
FREE
Moving Averages Divergence 3x3    Indicator     uses the crossover technique for signaling the market trend and the trade opportunities as well.     It applies 3 formats of the same indicator and allows them to plot the crossover signals which are interpreted as the trade signals along with the direction of the market trend. Moving Averages Divergence 3x3    Indicator   can be applied to trade all kinds of forex currency pairs within the financial markets.  Although, this indicator works well o
FREE
FOREX GANGSTER is a unique Expert Advisor created by a professional prop trader and financial asset manager with many years of experience. This is a solution for those who strive for stable profits without constant control over each transaction or monitoring the work of a trading advisor. Created for optimal conservative trading and investing through exchange instruments with long-term regular profits and minimal risks. The Expert Advisor algorithm is based on a deep understanding of market pat
The Wolf Wave Finder Indicator is a popular indicator, that is useful in identifying potential trading opportunities.   The indicator works by recognizing the Wolf Wave pattern, which is a well-known pattern used by professional traders to identify potential areas of support and resistance.   The indicator is easy to use and provides traders with an easy way to identify potential trades.   The Wolf Wave Finder Indicator is a great tool for traders who are looking for a reliable and accurate way
This indicator is a fusion of the Parabolic SAR and Fibonacci indicators. Fibo is drawn on the last wave, at the peaks the indicator displays prices for convenience. Parabolic SAR helps to define the market trend and generates trends following trade signals.     On the other hand, Fibonacci plots the price retracement levels so that traders can determine a better and safer place to enter the market. Scalping with Parabolic SAR and Fibonacci Overview. For this strategy, in addition to our indica
This is an easy-to-set-up and easy-to-use Expert Advisor that will help you always have the necessary information about your trading account at hand, sending from MetaTrader 4 to you in Telegram: • Account drawdown • Number of open positions • Volume of open positions • Profit per day, week, month How to get an chat ID: - Chat with BotFather to create Bot and get API Token of Bot. If you had Bot, skip the step. - Chat with bot @userinfobot , then the bot will reply your ID. How to setu
The SYMBOL MANAGER symbol change indicator is an effective tool designed to enhance trading convenience and significantly simplify the trader's experience. This indicator allows users to switch seamlessly between currency pairs and timeframes within a single open window of the trading terminal. Importantly, when switching, the associated template, including indicators and current chart settings, is automatically duplicated, ensuring a consistent trading environment.
Morning Star PRT インジケーターは、朝のフラットブレイクアウト原理を使用します。インジケーターは朝のフラットレベルを表示し、可能なターゲットを示します。 インジケーターには追加のフィボナッチレベルが追加され、設定で指定された両方のターゲットレベルと夜間のフラットレベルの交差点に関するサウンドアラートも追加されました。 Morning Star PRT インジケーターは、夜の終わりに夜間のフラットチャネルと、上下の 2 つのフィボナッチ価格レベルを構築します。これらのレベルは、ターゲットレベルと反転レベルの両方と見なすことができます。 Morning Star PRT インジケーターはすべての時間枠で機能しますが、M15 間隔で使用するのが最も効果的です。 The Morning Star PRT indicator uses the morning flat breakout principle. The indicator displays morning flat levels and shows possible targets. An additiona
インジケーター サプライ & デマンド ゾーン PRT – は、チャートのサプライ ゾーンとデマンド ゾーンのマーキングを実行するために使用されるカスタム ツールです。インジケーターは、抵抗/サポート レベルとサプライ/デマンド ゾーンを強調する線と長方形をチャート上に描画します。便宜上、線と数字は両方とも異なる色で塗られており、シグナルを互いに簡単に区別できます。インジケーターは、まだ使用されていない、価格がまだ突破していない新しいレベルのみを描画します。初心者と経験豊富なトレーダーの両方に最適です。 インジケーターは、スキャルピング、トレンド、カウンタートレンド、その他のトレーディング システムで使用されます。これは、あらゆる戦略の一部に簡単に組み込むことができる汎用アルゴリズムです。すべての時間枠とインストルメントで適切に表示され、オシレーターとうまく組み合わせることができます。 Indicator Supply & Demand zones PRT– is a custom tool that is used to perform supply and demand zon
このインジケーターは、チャートパターンを特定したいトレーダーにとって強力なツールであり、トレーディング戦略に組み込むことのメリットは数多くあります。このツールは、金融市場の潜在的なトレンドと反転を効果的に特定して通知し、トレーディングの収益性を高めます。高度なアルゴリズムのおかげで、インジケーターは市場データを正確に分析し、トレーダーに情報に基づいた決定を下すのに役立つ貴重な情報を提供します。このインジケーターを使用すると、チャートパターンを高精度で自動的に特定するため、より包括的な市場分析が可能になります。これらのパターンは、多くの場合、特定の方向への潜在的な価格変動を示します。したがって、この情報にアクセスできると、トレーダーは、これらのパターンを認識できないか、その意味を理解できない可能性のある他の市場参加者よりも有利になります。 このインジケーターは、強気と弱気のパターン認識機能を幅広く備えています(チャート上の略称は括弧内に表示されます)。 - Rising Star(SS) - Evening Star(E_Star) - Evening Doji Star(E_
This universal expert advisor is based on our own Algorithm, which is based on effective and time-tested Elliot Wave Theory.  This   expert advisor   is ideal for working both on a flat and during sharp or protracted trend movements (thanks to the Martingale method, according to which averaging positions are opened in accordance with the multiplier and distance set in the settings for accepting a new signal). ATTENTION! CAREFULLY STUDY THE OPERATING PRINCIPLE AND AVAILABLE SETTINGS OF THE EXPER
This is the automatic price spike signal indicator for MT4. Plots advance alerts on potential breakouts/pullbacks. Suits forex, stocks & crypto trading strategies. This is a perfect indicator for reversal traders. A spike often indicates a turn-around moment. The best way to use that gauge is to apply it to your favourite trading system as a filter. 這是 MT4 的自動價格飆升訊號指示器。繪製有關潛在突破/回調的預先警報。適合外匯、股票和加密貨幣交易策略。 對於反轉交易者來說,這是一個完美的指標。尖峰通常表示轉變時刻。使用該指標的最佳方法是將其作為過濾器應用到您最喜歡的交易系統中
パラボリック SAR およびサポート/レジスタンス レベルは、潜在的なトレンドの反転やエントリー ポイントとエグジット ポイントを識別するために外国為替取引で使用されるテクニカル分析インジケーターであるだけでなく、既製の自律的な取引戦略でもあります。 このインジケーターは、チャートに動的なサポート レベルとレジスタンス レベルを追加することで PSAR インジケーターを基盤としており、トレーダーが市場が反転する可能性のある主要な価格レベルを特定するのに役立ちます。 このインジケーターを使用すると、トレーダーは市場の強さと方向、および取引の潜在的なエントリー ポイントとエグジット ポイントに関する洞察を得ることができます。 パラボリック SAR およびサポート/レジスタンス レベル インジケーターは、チャートにさまざまなパラボリック サポートとレジスタンス (PSAR) レベルをプロットするテクニカル分析ツールであり、トレーダーに潜在的なトレンドの反転シグナルを提供します。 このインジケーターは、メインの MT4 チャート ウィンドウに一連の水平に並んだ線として表示されるため、トレ
The All Market Channels indicator from ProfRobotrading automatically builds and displays all formed trading channels on the screen. This indicator is very convenient for trading on all existing channel strategies and is applicable to all instruments and timeframes.  Look at the screenshot - it will tell you more :) More information is available on our website ProfRoboTrading. ProfRobotrading の All Market Channels インジケーターは、形成されたすべての取引チャネルを自動的に構築して画面に表示します。このインジケーターは、既存のすべてのチャネル戦略での取引に非常に便利で、す
This is a Bollinger Bands Compression indicator. It detects volatility compression and the release of “suppressed momentum.” It can be used when it coincides with any specific trading entries — released volatility means a higher probability of making a decent profit. There is also a histogram with colored bands symbolizing weakness or strength, and a zero line crossover. Therefore, this indicator can be used both in conjunction with other indicators within trading strategies, and on its own meri
フィルタ:
patrickdrew
3230
patrickdrew 2025.08.13 06:47 
 

ユーザーは評価に対して何もコメントを残しませんでした

Tim Marco Talarowski
642
Tim Marco Talarowski 2025.05.24 07:19 
 

ユーザーは評価に対して何もコメントを残しませんでした

pan898899
534
pan898899 2025.05.23 00:15 
 

ユーザーは評価に対して何もコメントを残しませんでした

レビューに返信