Market Structure
- インディケータ
- バージョン: 1.21
- アップデート済み: 27 2月 2026
- アクティベーション: 20

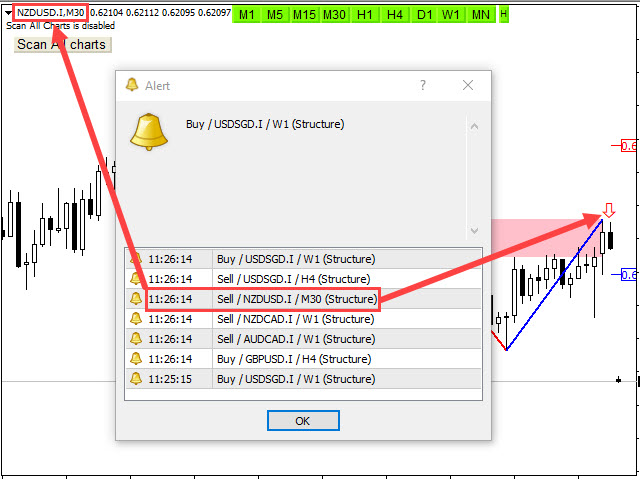
** All Symbols x All Timeframes scan just by pressing scanner button **
Introduction:
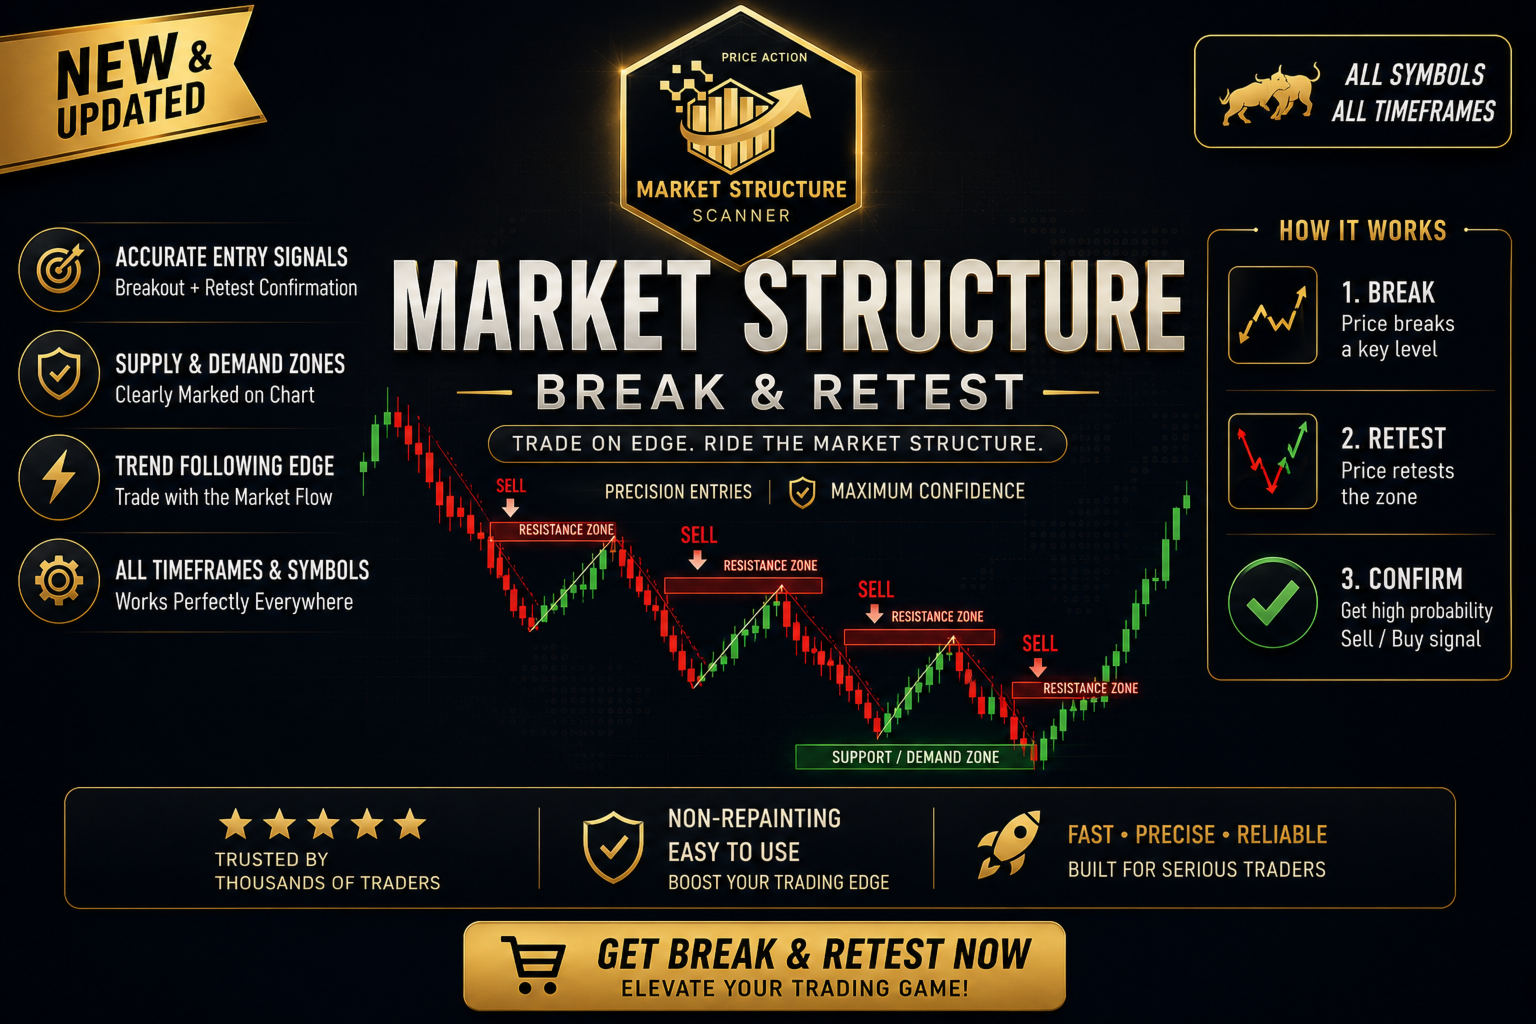
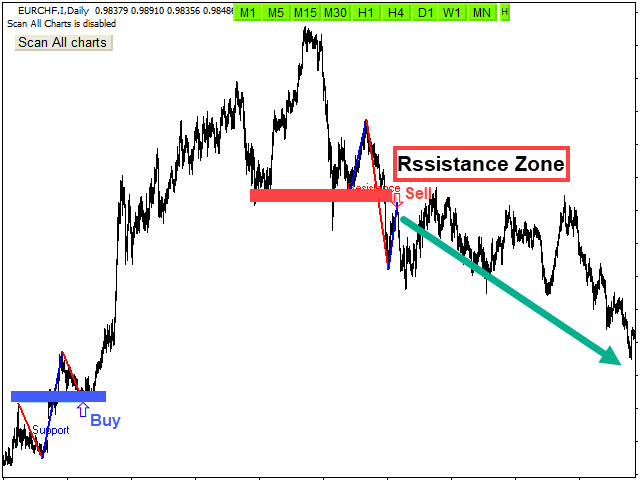
Market structure is important for both new and professional traders since it can influence the liquidity and price action of a market (Breakout and Retest). It’s also one of the most commonly used techniques to understand trends, identify potential reversal points, and get a feel for current market conditions. it provides incredible insight into how the market is behaving. It can provide vital signals about where the price action is heading next.
The Market structure indicator Scans All charts just by pressing one click and has support and resistance with using Fibonacci levels and candlestick checking for best entry point. It finds signals immediately with alarm and notification for easy trading. It is included powerful Cup and Handle pattern.
Main Features:
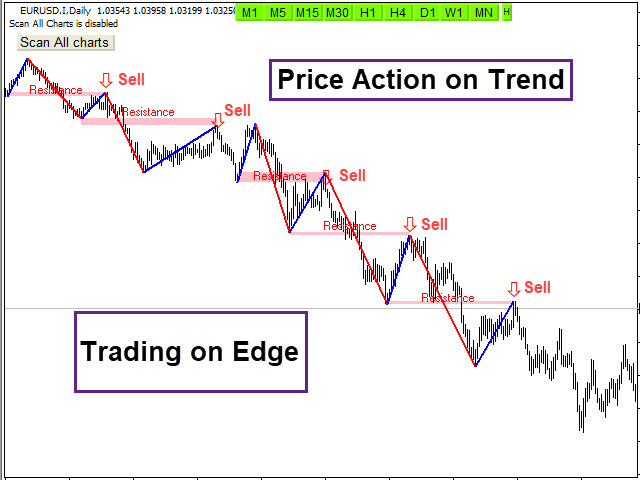
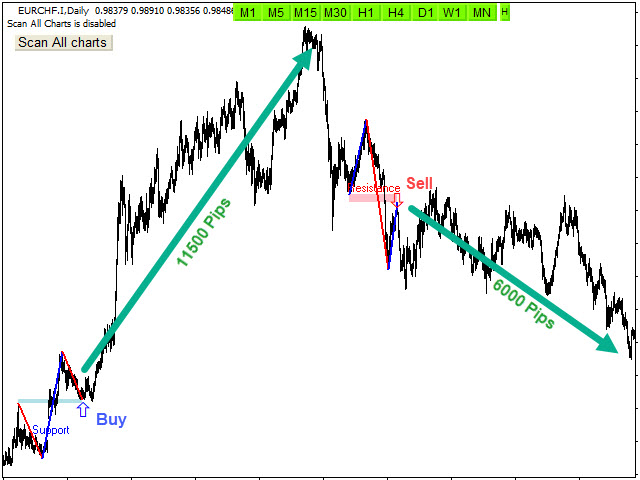
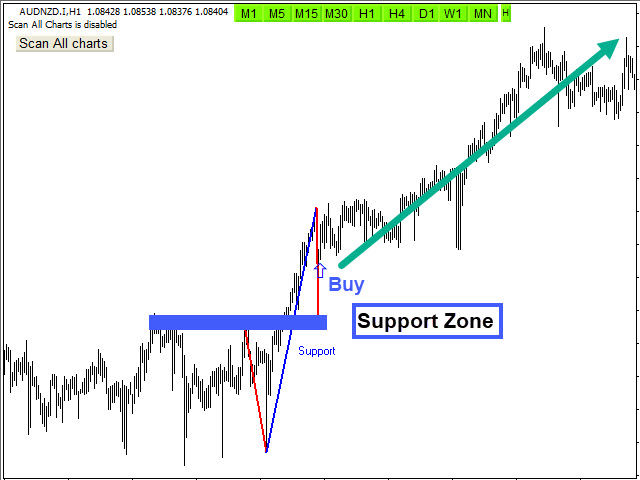
- Detect the best and most successful point of trend or reversal trend
- Easy-to-use and user-friendly indicator
- NO repaint
- Scan All charts button ( Forex, Crypto, Indices and commodities )
- Select and deselect time frames button for scan (M1,M5,M15,M30,H1,H4,D1,W1,MN)
- It displays and pushes notification stop-loss, entry-point levels
- Candlestick check for the best entry point
- Use Fibonacci levels
- Sending the alert and push notification
- method Engulfing/breakout - Engulfing on edge of pattern / Breakout next price level
- Alert enable/disable base on your setting time
- Adjust the pattern setting
Input Parameters :
=========Scanner============
- Scan All Charts – Enable
- Scan the number of candles – Amount of history bars to evaluate
- Re-scan Timer – Re-scan all charts in all time frames after passing time
- mode = Engulfing/breakout - Engulfing on edge of pattern / Breakout next price level
=======Display/style Options============
- Display Options – Display or do not SL & Entry levels
- Stop Loss levels and Breakout Style - Set the Fonts and colors of patterns
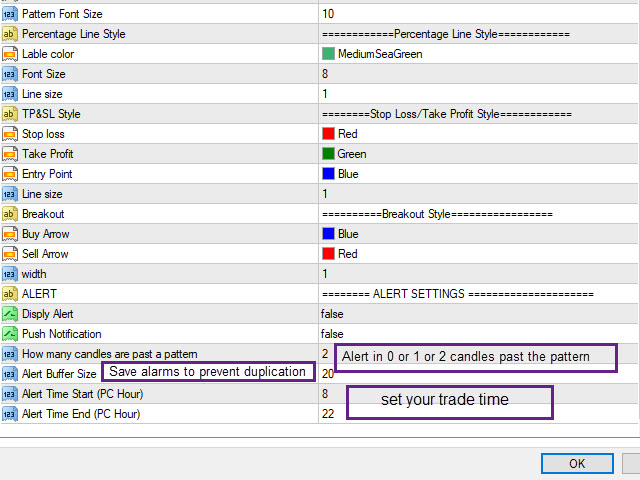
========ALERT SETTINGS ==========
- Display Alert or Push Notification – Enable or disable Alert or Push Notification
- How many candles are past a pattern – Maximum Number of candles Passed from a pattern to allow alert
- Alert Buffer Size – Maximum save alert to prevent duplicate alerts
- Alert start/end time – Determine trading hours based on the computer clock to activate and deactivate the alarm


awesome awesome tool. Great value for the money.