My Fibonacci
- インディケータ
- バージョン: 1.1

An automated Fibonacci indicator that combines ZigZag swing detection with comprehensive Expert Advisor integration through a 20-buffer system.
More details about data specification and EA integration: https://www.mql5.com/en/blogs/post/764109
Core Features
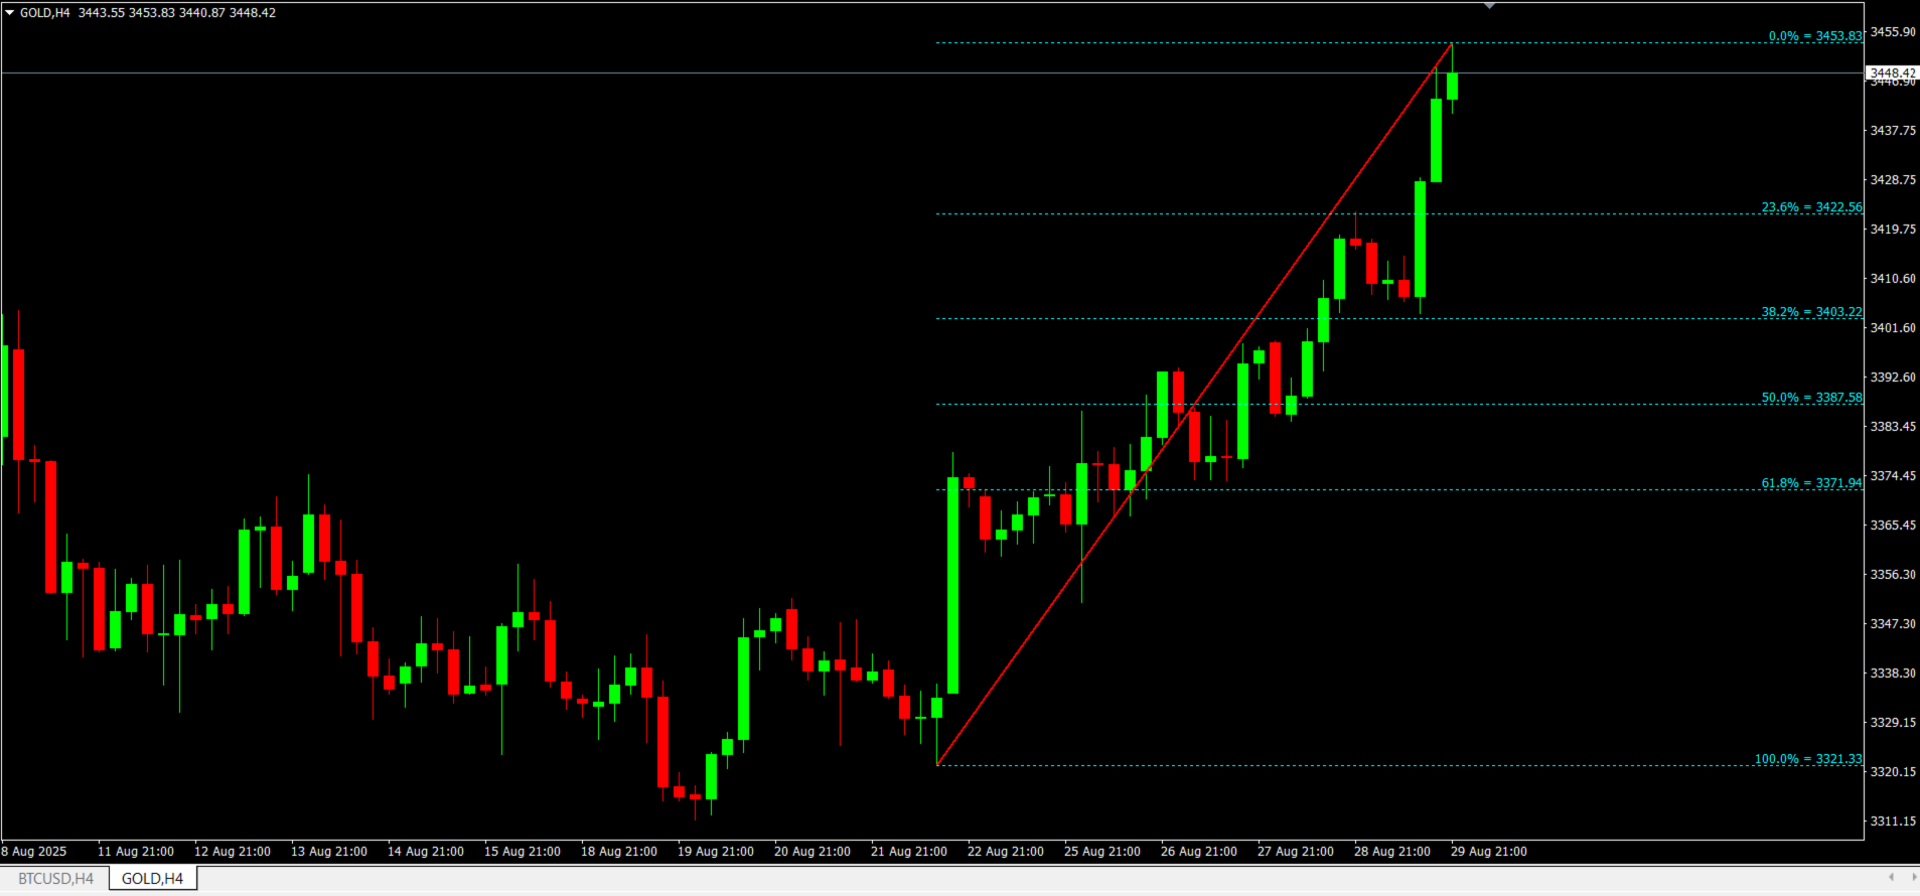
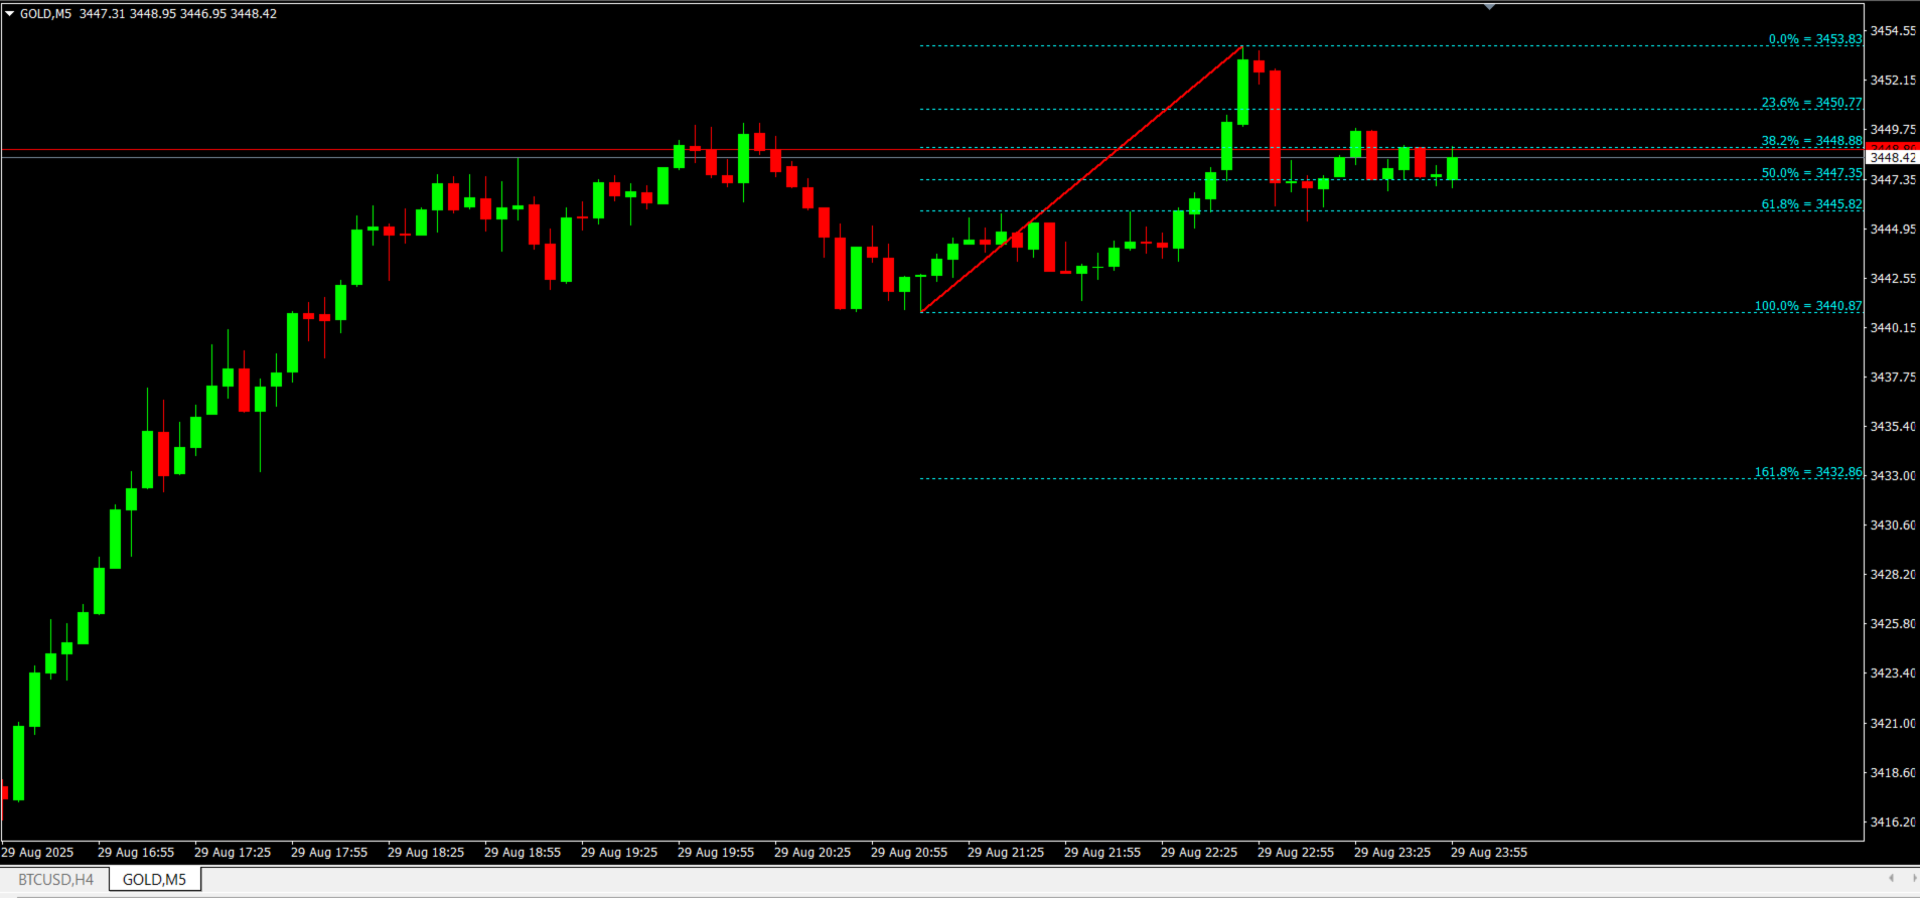
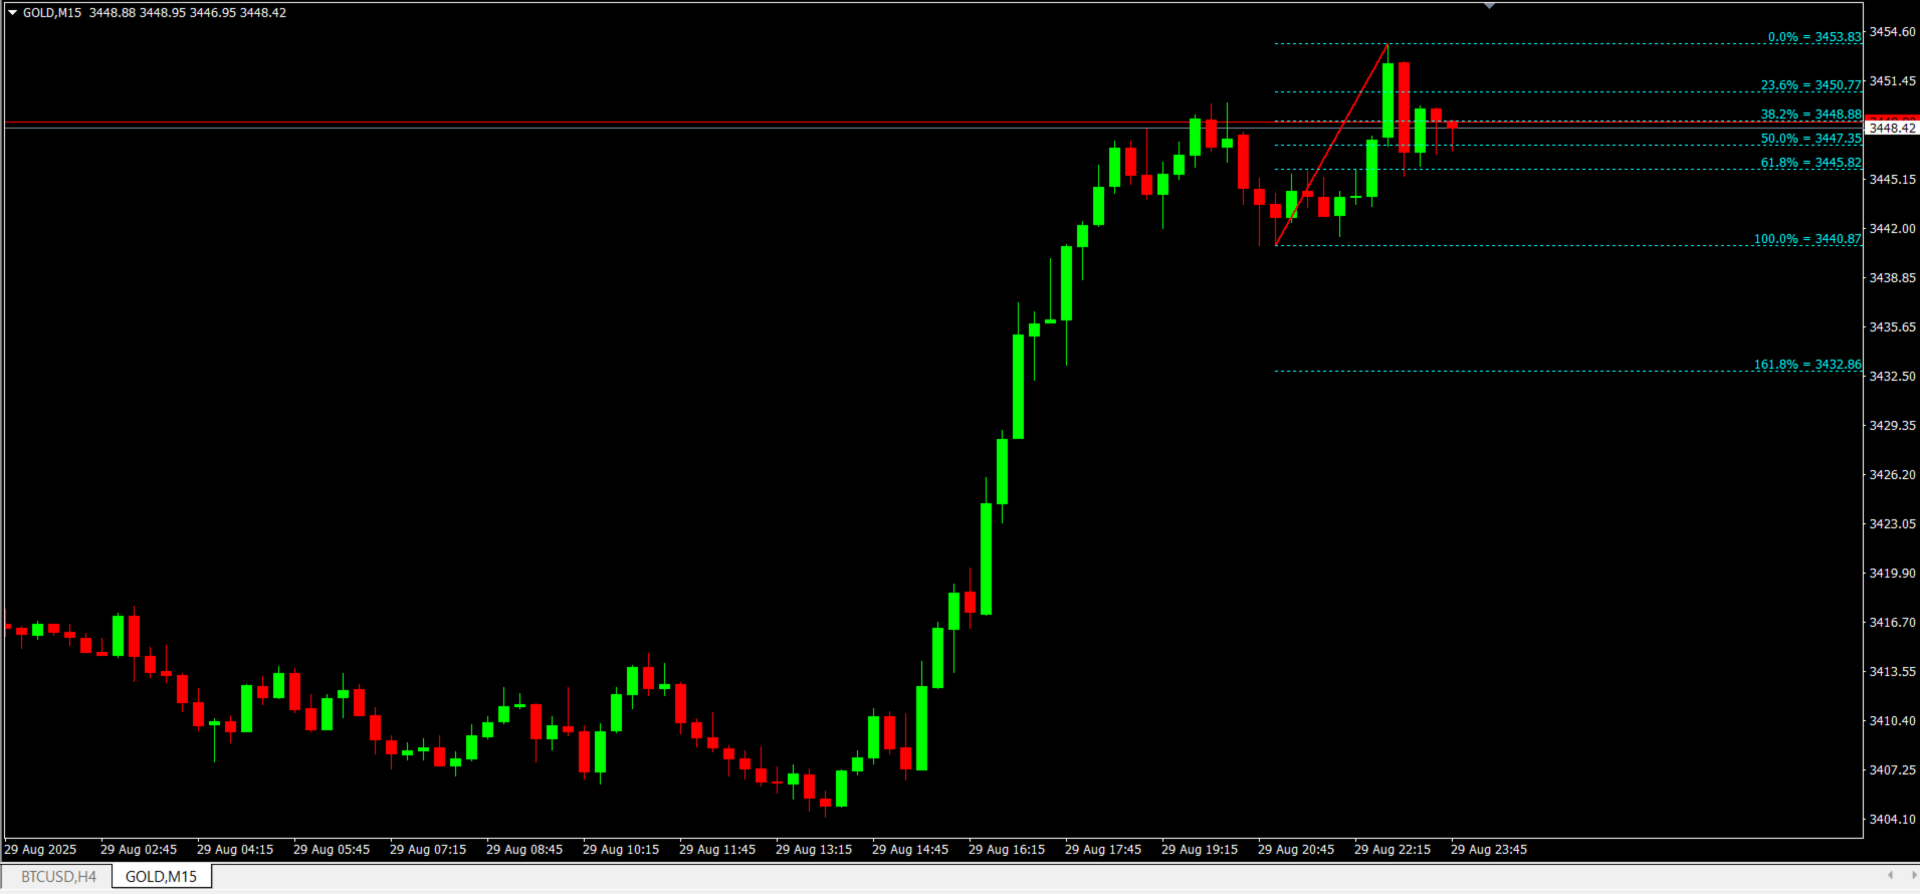
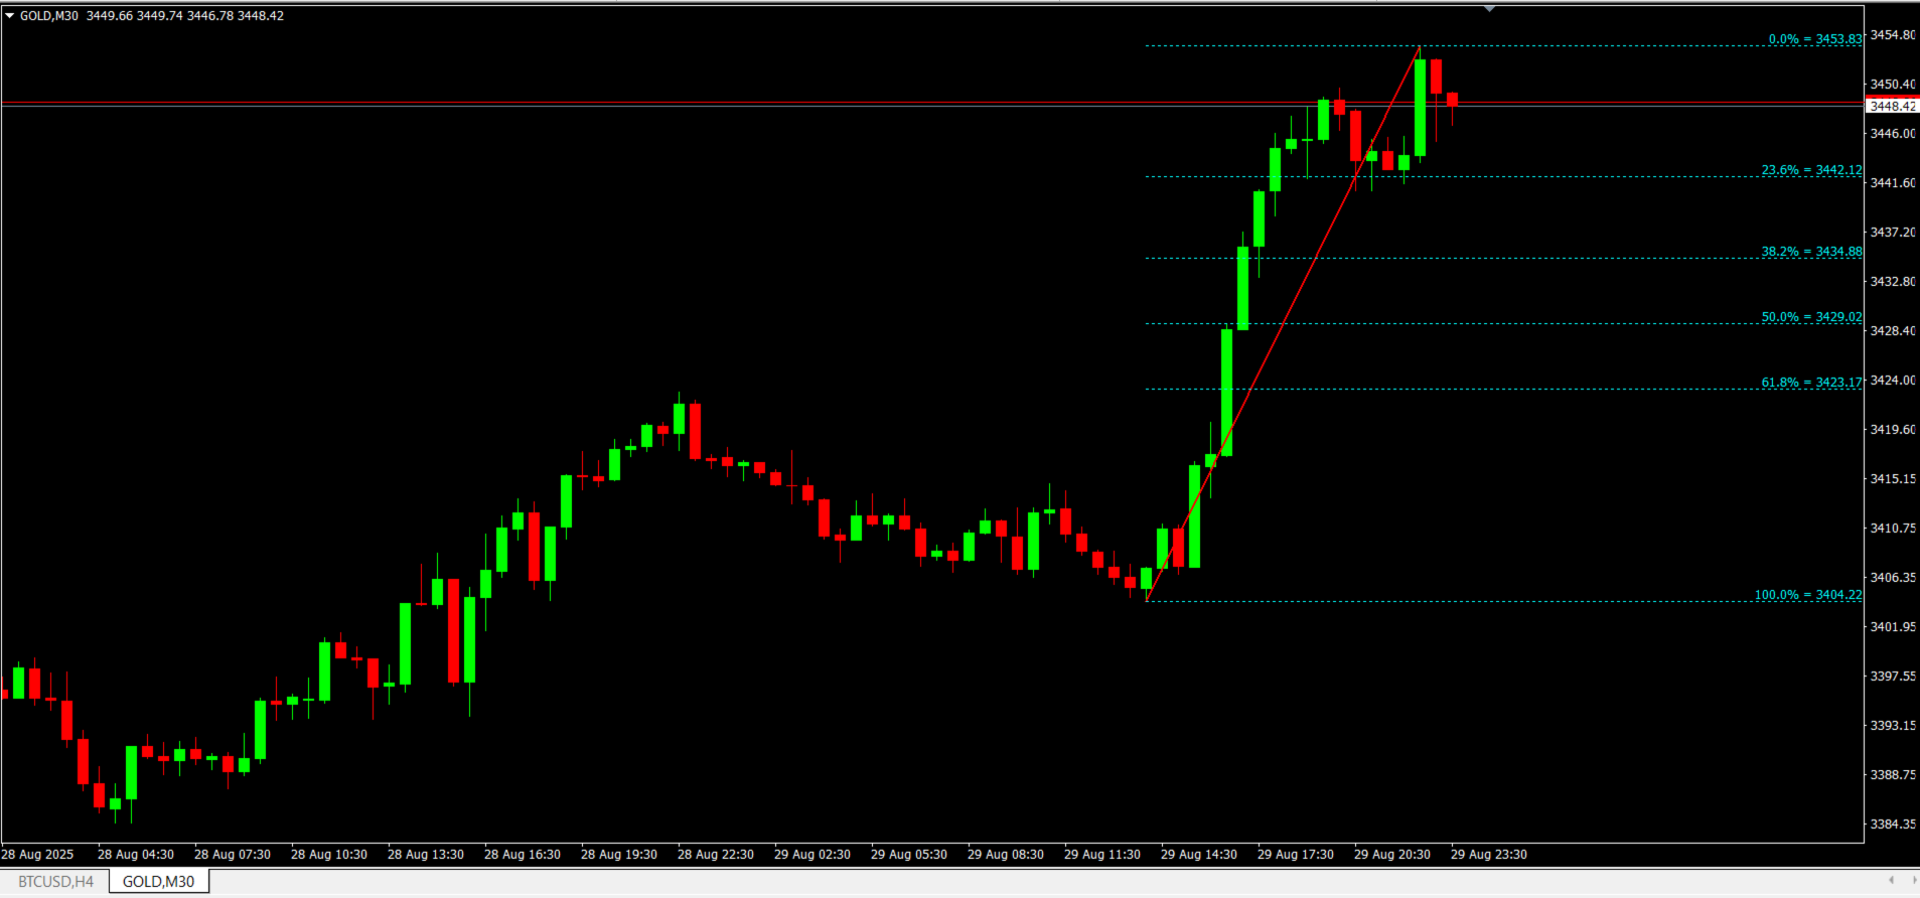
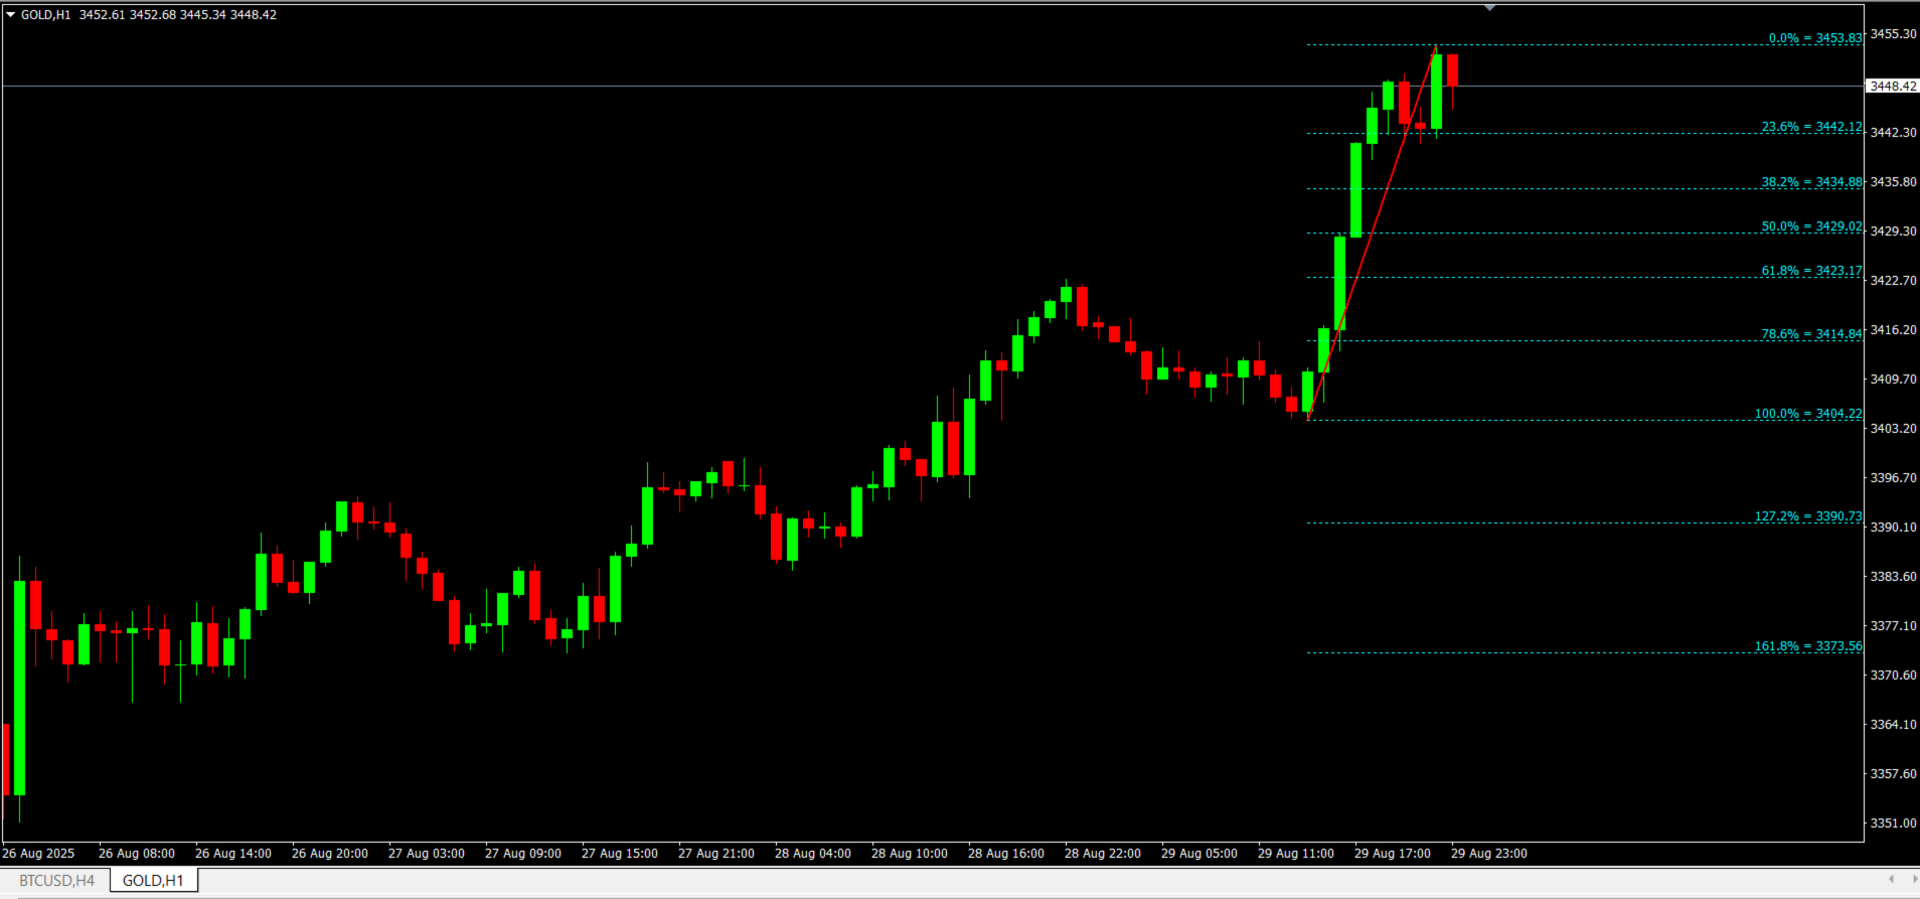
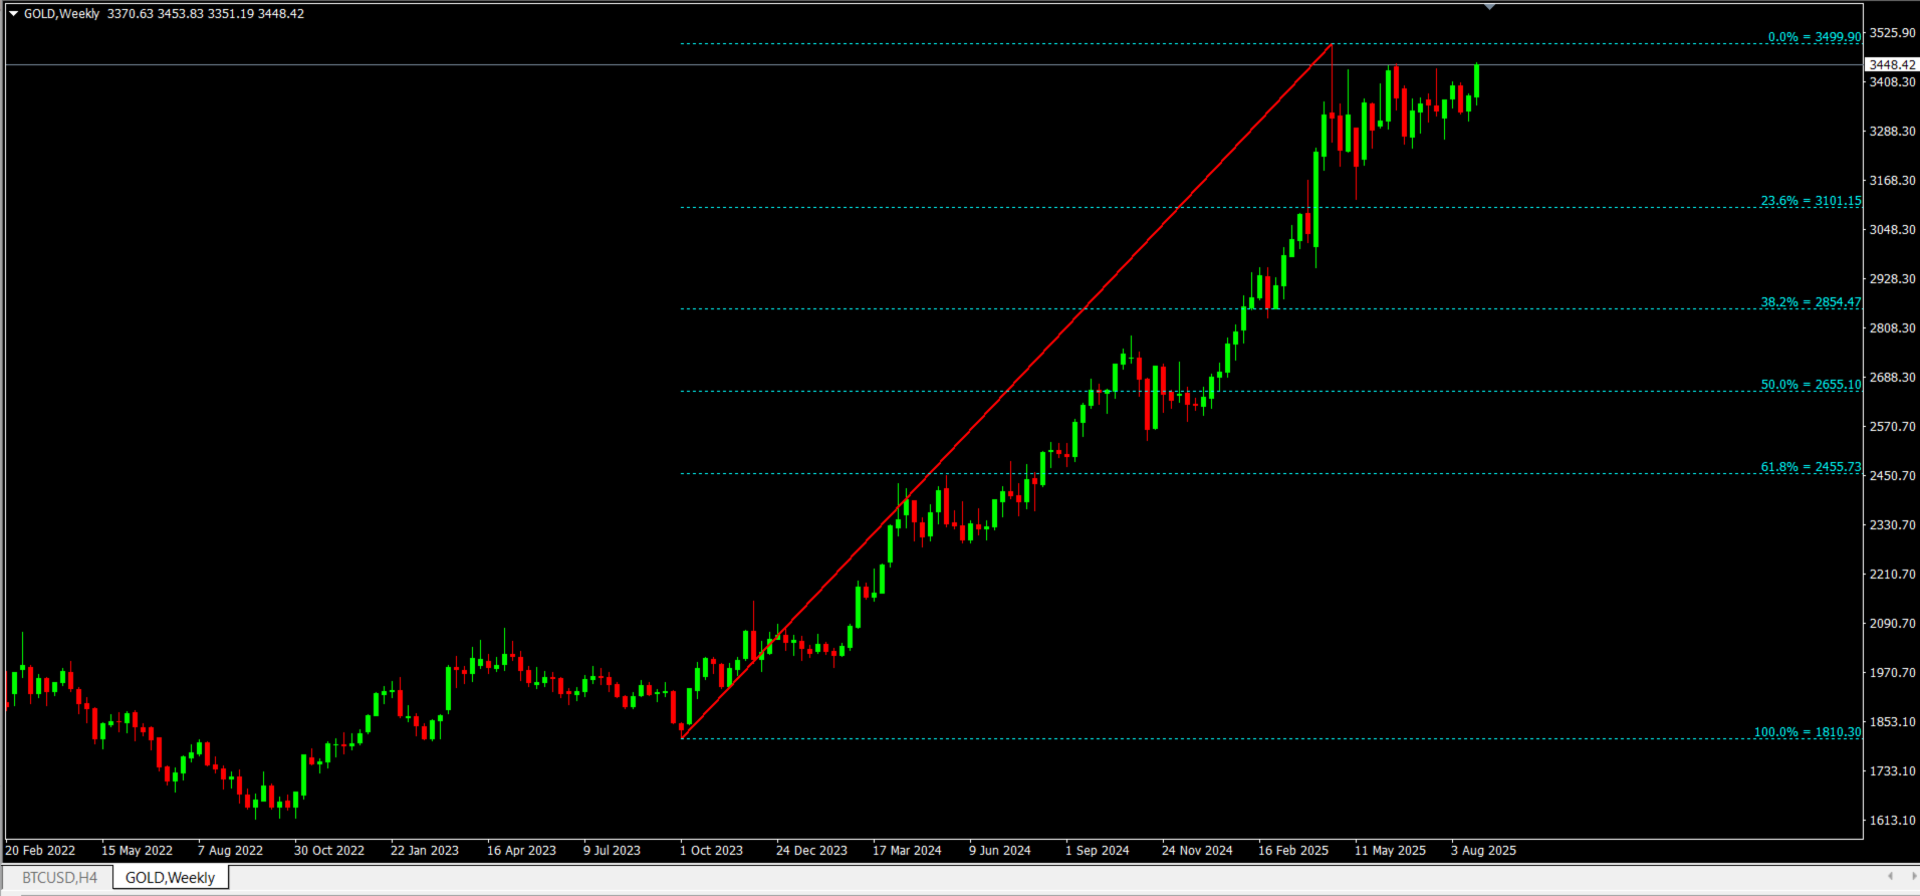
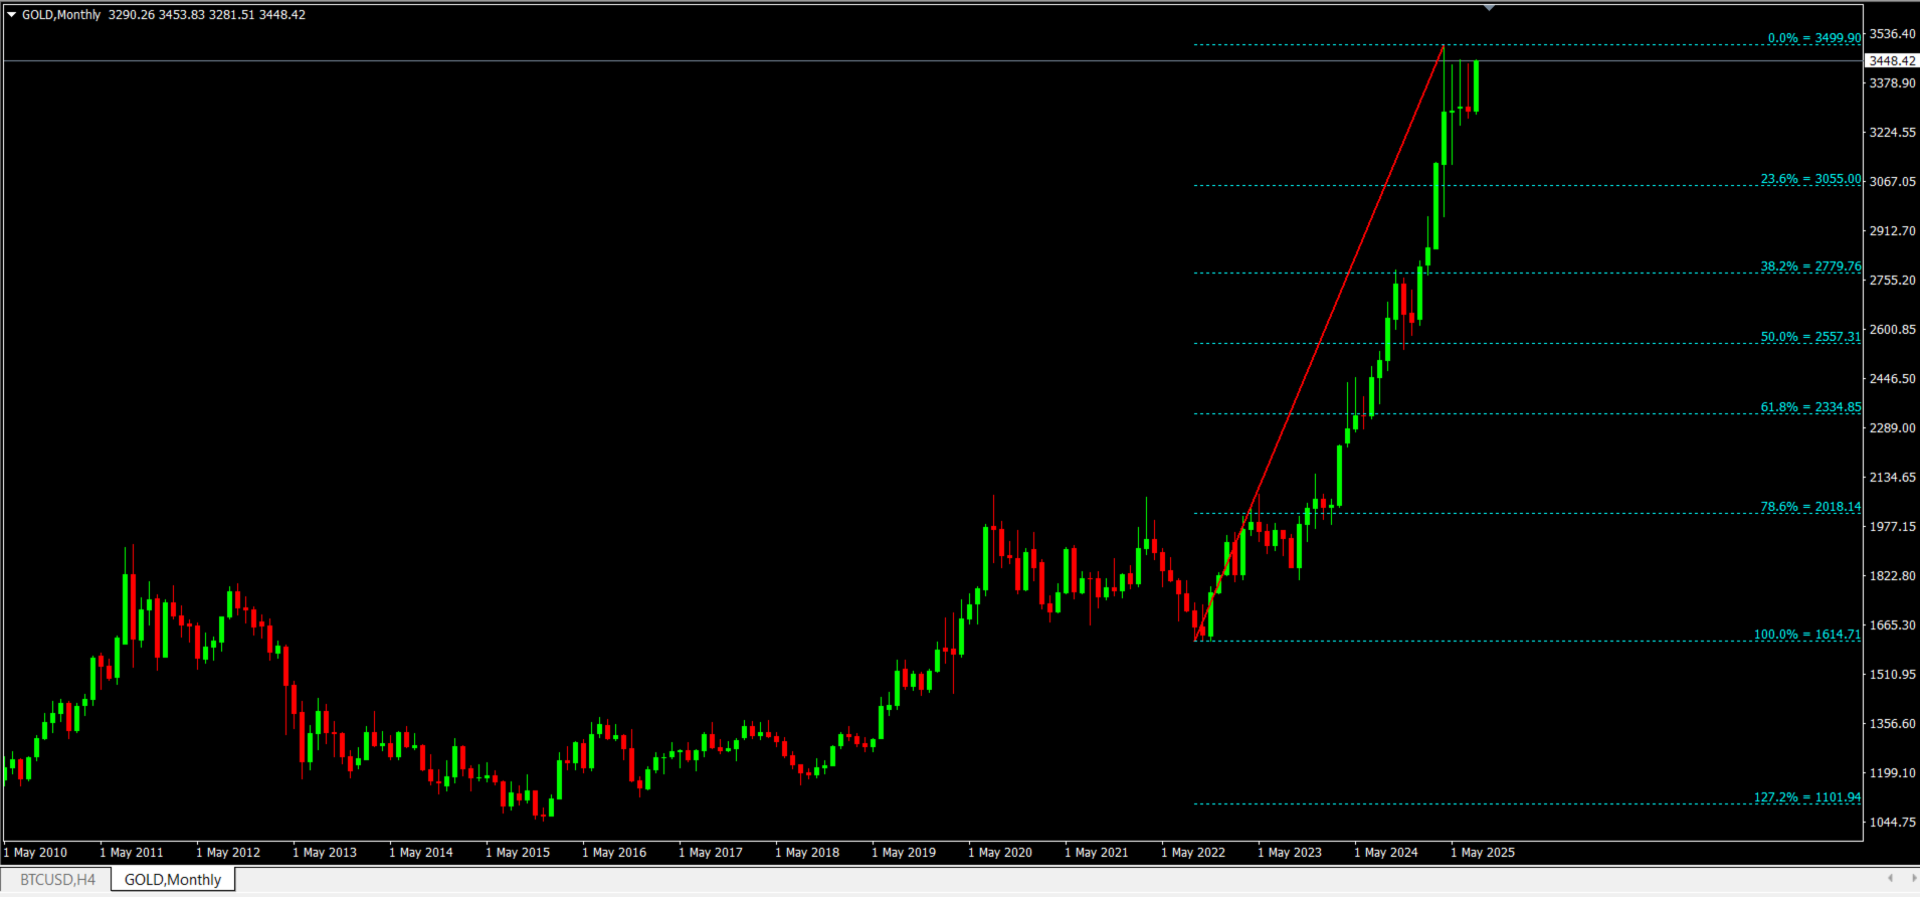
Automated Fibonacci Detection The indicator identifies swing points using configurable ZigZag parameters and draws Fibonacci retracements and extensions automatically. It updates levels as new swing formations develop.
Market Adaptation During high volatility periods, additional Fibonacci levels (78.6% and 127.2%) are activated automatically based on ATR analysis.
Cross-Timeframe Support Works on all timeframes from M1 to Monthly with timeframe-specific optimization.
Key Benefits
- Smart Swing Filtering: Uses ATR-based filtering to reduce market noise
- Real-time Updates: Continuous monitoring and level adjustment
- Clean Visualization: Customizable colors and enhanced emphasis on key levels (38.2%, 50%, 61.8%)
- EA Integration Ready: Complete 20-buffer system for algorithmic trading
Expert Advisor Integration
Buffer System (20 buffers total):
Core Price Levels (Buffers 0-6):
- 0%, 23.6%, 38.2%, 50%, 61.8%, 100%, 161.8%
Market Intelligence (Buffers 7-19):
- Trend direction analysis
- Volatility state assessment
- Active level monitoring
- Support/resistance strength
- Risk/reward calculations
Configuration Options
ZigZag Settings:
- Adjustable Depth, Deviation, BackStep parameters
- Configurable Leg selection
Market Analysis:
- ATR period customization
- Volume analysis integration
- Swing filtering adjustment
Trading Applications
- Retracement Trading: Identify reversal zones at key Fibonacci levels
- Extension Trading: Use 161.8% and 261.8% levels for profit targets
- Risk Management: Built-in risk/reward calculations for position sizing
Installation & Usage
- Install in MT4 Indicators folder
- Apply to chart with default settings
- Customize ZigZag parameters as needed
- Access buffers via iCustom() for EA development
Important Notes
This indicator is provided free for educational and trading purposes. Test thoroughly on demo accounts before live trading. All trading involves risk of loss.