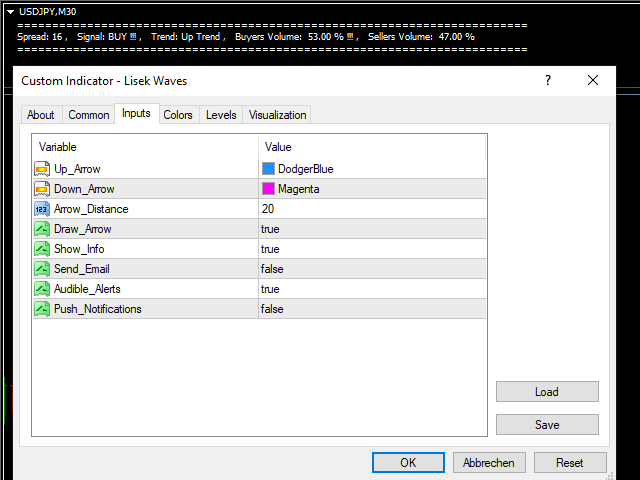
Lisek Waves

4

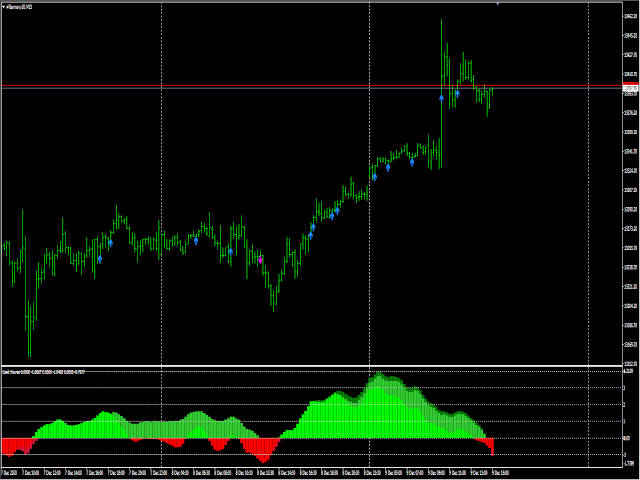
Search for an entry with low risk for trading by Lisek Waves Indicator.

Using Lisek Waves Indicator can improve your trading performance. In it’s simplest form, this trading tool make it easy to search for an entry with low risk and to manage your trade and risk.

Lisek Wave analysis is based on the notion that markets follow specific patterns called waves which are the result of a natural rhythm of crowd psychology that exists in all markets. You can avoid the loss from taking trades that are false breakouts, get better trade location on trade entries and have less initial risk exposure, get out of trades earlier, when you see the Market Makers change direction or stay in winning trades longer, when you see that the Market Makers are staying with the move.


But do not forget that technical analysis is the study of PAST market data only, to forecast the direction of future price movements.

1) Think and analyse in Waves.

2) Trade pullbacks (Range trading).

3) Trade breakouts. 

4) Trade reversals.

​5) Take profits or set stop-loss based on Waves.

6) Set next piramiding order or headging pending order based on Waves.

LOOK FOR LOW RISK ENTRIES !!!


レビュー 2
fenix trading
254
fenix trading 2023.01.19 10:06 
 

I like it a lot, we wait for updates, very appreciated.

おすすめのプロダクト
Free automatic Fibonacci is an indicator that automatically plots a Fibonacci retracement based on the number of bars you select on the BarsToScan setting in the indicator. The Fibonacci is automatically updated in real time as new highest and lowest values appears amongst the selected bars. You can select which level values to be displayed in the indicator settings. You can also select the color of the levels thus enabling the trader to be able to attach the indicator several times with differe
FREE
SX Supply Demand Zones accurately identifies and draws high-probability Supply and Demand zones using a sophisticated algorithm. Unlike traditional indicators that clutter your chart, this indicator is designed with a focus on performance and a clean user experience. New Unique Feature: Interactive Legend System What truly sets this indicator apart from everything else is the Interactive Control Legend. You have a professional dashboard directly on your chart that allows you to: Show/Hide: Ins
FREE
シンプルだが効果的。 反転インジケーター - それは何か? スーパートレンドのロジックと指数曲線技術を組み合わせたトレンドフォロー型オーバーレイインジケーターです。トレンドの方向を検知し、チャート上に動的なチャネルを描画し、トレンドが反転した際にリアルタイムでアラートを送信します。 仕組み ATRとスーパートレンド係数を用いて指数ベースラインを算出。価格がこのベースラインを上抜け/下抜けした時点でトレンド反転を確認。緑矢印は買いトレンド開始、赤矢印は売りトレンド開始を示す。 特徴: ATRベースの動的チャネル付き指数トレンドベースライン 緑/赤で色分けされたトレンドラインと塗りつぶしチャネル トレンド反転時の買い/売り矢印シグナル 内蔵アラート:ポップアップ、プッシュ通知、メール、サウンド 重複アラート防止(1バーあたり1アラート) 完全カスタマイズ可能:色、線幅、矢印サイズ、チャネル幅 遅延のないクリーンなチャートオーバーレイ 入力パラメータ: 指数係数、スーパートレンド係数、ATR期間、チャネル幅 オン/オフ切り替え:チャネル塗りつぶし、矢印、各アラートタイプ 全視覚
FREE
PZ Penta O MT4
PZ TRADING SLU
2.33 (3)
The Penta-O is a 6-point retracement harmonacci pattern which usually precedes big market movements. Penta-O patterns can expand and repaint quite a bit. To make things easier this indicator implements a twist: it waits for a donchian breakout in the right direction before signaling the trade. The end result is an otherwise repainting indicator with a very reliable trading signal. The donchian breakout period is entered as an input. [ Installation Guide | Update Guide | Troubleshooting | FAQ | A
FREE
Line
Andrea Fontanini
free only until the end of the week The following indicator must be used and contextualized according to your trading methodologies. It provides excellent trading insights and identifies rejection zones on the drawn lines. Several parameters can be customized. The indicator will plot three levels above and below the opening price on D1, W1, and MN1. It will provide the daily ADR and display two additional daily sessions (EUROPE session and USA session). The colors of the various lines can be cu
FREE
Renko Chart with Moving Average. Classic Renko charts idea. It is protted on main chart and Moving Average can be applied. Prices for bars are used from a lower timeframe. Parameters: BarsBack - how many bars of lower timeframe to use. If value is zero than it will use all available bars. LTF - lower timeframe. BrickSize - Renko bar in points. BullishColor - color for bull candle. BearishColor - color for bear candle. HideLineChart - if this value is true the line chart when be hidden when sele
FREE
Trend Rising SDEA MT4
Wan Mohd Safwan Bin Wan Daud
Trend Rising is a custom MT4 ( Metatrader 4 ) indicator, use best for scalping on TF M30 and below that analyzes the trend and momentum pattern using Bill William Indicators on multiple timeframes.  As the result, It identifies the beginning and the end of the trend that works for most currency pairs. The Trend Rising indicator is developed based on Accelerator Oscillator and Awesome Indicator.     Key Features Identify the beginning and the end of the trend as display with colors.  Identify eas
FREE
Smart FVG インジケーター MT4 – MetaTrader 4 向け高度なフェアバリューギャップ検出 Smart FVG インジケーター MT4 は、MetaTrader 4 上で Fair Value Gap(FVG)をプロフェッショナルレベルで検出・監視し、アラートまで行うツールです。ATR ベースのフィルタリングと相場構造を考慮したロジックを組み合わせることで、ノイズを取り除き、流動性に応じて適応し、本当に重要な不均衡だけを残して精度の高い判断をサポートします。 主な特長 正確な FVG 検出:単なるローソク足のギャップではなく、市場の本質的な非効率を捉えます。 ATR ベースの精度:市場や時間軸が変わっても、低品質なシグナルを自動的にフィルタリング。 有効性のリアルタイム追跡:価格がゾーンを埋める/ブレイクすると、ゾーンが自動で延長・調整・削除されます。 カスタマイズ可能な表示:色・ラインスタイル・塗りつぶしを自由に設定し、どんなテンプレートにも合わせられます。 実用的なアラート:新規 FVG や、埋められた/無効化されたゾーンをリアルタイム通知。 パフォーマンス
FREE
Follow The Line
Oliver Gideon Amofa Appiah
3.94 (16)
FOLLOW THE LINE GET THE FULL VERSION HERE: https://www.mql5.com/en/market/product/36024 This indicator obeys the popular maxim that: "THE TREND IS YOUR FRIEND" It paints a GREEN line for BUY and also paints a RED line for SELL.  It gives alarms and alerts of all kinds. IT DOES NOT REPAINT and can be used for all currency pairs and timeframes. Yes, as easy and simple as that. Even a newbie can use it to make great and reliable trades. NB: For best results, get my other premium indicators for more
FREE
Hurst Buy and Sell Mt4
Victor Alfonso Molina Botello
Hurst Buy and Sell  This innovative indicator, inspired by xAI Grok intelligence, uses the Hurst exponent to identify the nature of the market and generate buy/sell signals. The EA for this indicator (Hurst Razer PRO EA MT5) is now available, you can see it by clicking here!  https://www.mql5.com/es/market/product/153441?source=Site+Profile+Seller  If you want more signals from the indicator, change the minimum number of bars between consecutive signals. The lower the value, the more signals it
FREE
Auto Fibonacci Retracement Indicator — Flexible and Reliable This is not just another Auto Fibonacci Retracement indicator — it’s one of the most flexible and dependable tools available . If you find it useful, please leave a review or comment to support the project. Check out my other helpful tools below: Timeframes Trend Scanner    - Scan the trend of assets in difference timeframes with multiple indicators Market Trend Scanner   - Scan the trend of multiple-assets in with multiple indicators
FREE
Индикатор "Buy Sell zones x2" основан на принципе "остановка/разворот после сильного движения". Поэтому, как только обнаруживается сильное безоткатное движение, сразу после остановки - рисуется зона покупок/продаж. Зоны отрабатывают красиво. Или цена ретестит зону и улетает в космос, или пробивает зону насквозь и зона отрабатывается с другой стороны так же красиво.  Работает на всех таймфреймах. Лучше всего выглядит и отрабатывает на Н1.    Может использоваться как: индикатор зон, где лучше вс
FREE
Auto Supply and Demand Oscillator is an indicator for MetaTrader 4 and MetaTrader 5 that detects supply and demand zones automatically and displays them as a single oscillator value at the bottom of the chart, instead of drawing rectangles directly on price. Concept Supply zones are price areas where strong selling created a sharp downward move away from a balance area. Demand zones are price areas where strong buying created a sharp upward move. Traditional implementations draw boxes on the
FREE
PZ Fibonacci
PZ TRADING SLU
4.8 (10)
Are you tired of plotting fibonacci retracements or extensions manually? This indicator displays fibonacci retracements or extensions automatically, calculated from two different price points, without human intervention or manual object anchoring.  [ Installation Guide | Update Guide | Troubleshooting | FAQ | All Products  |  Get Help ] Easy to use Manual anchoring is not needed Perfect for price confluence studies The indicator evaluates if retracements or extensions are needed Once drawn, yo
FREE
ピボットポイントフィボRSJは、フィボナッチレートを使用してその日のサポートラインとレジスタンスラインを追跡するインジケーターです。 この壮大な指標は、フィボナッチレートを使用してピボットポイントを通じて最大7レベルのサポートとレジスタンスを作成します。 価格がこのサポートとレジスタンスの各レベルを尊重する方法は素晴らしいです。そこでは、オペレーションの可能な入口/出口ポイントを認識することができます。 特徴 最大7レベルのサポートと7レベルの抵抗 レベルの色を個別に設定します 入力 ピボットタイプ ピボットフィボRSJ1 =フィボ比1の計算 ピボットフィボRSJ2 =フィボ比2の計算 ピボットフィボRSJ3 =フィボ比3の計算 ピボットフィボクラシック=クラシックピボット計算 最小ピボットレベル ピボット3レベル ピボット4レベル ピボット5レベル ピボット6レベル ピボット7レベル それでも質問がある場合は、ダイレクトメッセージで私に連絡してください: https://www.mql5.com/ja/users/robsjunqueira/
FREE
This indicator finds Three Drives patterns. The Three Drives pattern is a 6-point reversal pattern characterised by a series of higher highs or lower lows that complete at a 127% or 161.8% Fibonacci extension. It signals that the market is exhausted and a reversal can happen. [ Installation Guide | Update Guide | Troubleshooting | FAQ | All Products  |  Get Help ] Customizable pattern sizes Customizable colors and sizes Customizable breakout periods Customizable 1-2-3 and 0-A-B ratios It impl
FREE
This indicator has been created for finding the probable reversal points of the symbol price. A small candlestick reversal pattern is used it its operation in conjunction with a filter of extremums. The indicator is not redrawn! If the extremum filter is disabled, the indicator shows all points that have a pattern. If the extremum filter is enabled, the condition works – if the history Previous bars 1 candles back contains higher candles and they are farther than the Previous bars 2 candle, such
FREE
Market Profile 3
Hussien Abdeltwab Hussien Ryad
3 (2)
Market Profile 3 MetaTrader 4 indicator  — is a classic Market Profile implementation that can show the price density over time, outlining the most important price levels, value area, and control value of a given trading session. This indicator can be attached to timeframes between M1 and D1 and will show the Market Profile for daily, weekly, monthly, or even intraday sessions. Lower timeframes offer higher precision. Higher timeframes are recommended for better visibility. It is also possible t
FREE
Aroon Classic インジケーターの概要 Aroon Classic は、チャート上でトレンドの発生と持続性を定量的に把握できるテクニカル指標です。トレンドの強さや転換タイミングを「Aroon Up」と「Aroon Down」という2本のラインで示し、0~100 の範囲で表示されます。Aroon Up が高値圏にあるほど上昇トレンドが強く、Aroon Down が高値圏にあるほど下降トレンドが強いことを意味します。 主な特徴 トレンドの発生から転換までを視覚的に判別可能 カスタマイズ可能な計算期間(デフォルト14期間) 線の色・太さ・スタイルを自由に設定可能 インジケーターのパラメーター パラメーター名 説明 デフォルト値 Period Aroon の計算に使用するバー数 14 Aroon Up Color Aroon Up ラインの色 DodgerBlue Aroon Down Color Aroon Down ラインの色 Tomato Line Width ラインの太さ(ピクセル) 2 インジケーターの計算方法 Aroon Up は、直近期間内の最高値が発生してからのバー数
FREE
Simple RSI Forex Trading Strategy
Victor Manuel Valderrama Zamora
4 (1)
Diversify the risk in your trading account by combining our Expert Advisors. Build your own custom trading system here:   Simple Forex Trading Strategies The expert advisor opens trades when RSI indicator enter in oversold or overbought areas. The Stop Loss, Take Profit, and Trailing Stop are calculated based on the ATR indicator. The recommended currency pair is EURGBP and the recommended timeframe to operate and to do backtests is H4. This Expert Advisor can be profitable in any TimeFrame an
FREE
Head and Shoulders Pattern Indicator - Your Key to Recognizing Trend Reversals Unlock the power of pattern recognition with the "Head and Shoulders Pattern Indicator." This cutting-edge tool, designed for MetaTrader, is your trusted ally in identifying one of the most powerful chart patterns in technical analysis. Whether you're a novice or an experienced trader, this indicator simplifies the process of spotting the Head and Shoulders pattern, allowing you to make informed trading decisions. Key
FREE
This indicator shows the latest untouched support and resistance as horizontal lines. The indicator can show support/resistance from higher timeframes. With this indicator you can e.g. easily see the support/resistance of the timeframes H4, D1 and W1 on a H1 chart, which can be a big advantage while time your entry on H1. This is the FREE version of the indicator: Support Resistance Multi Time Frame The free version works only on EURUSD and GBPUSD! Parameters referenceTF: the timeframe from whi
FREE
Market Shift and FVG
Cruz Molina William Alberto
5 (2)
MT4用 マーケットストラクチャーシフトとフェアバリューギャップ (FVG) インジケーター このMT4インジケーターは、市場構造の変化とフェアバリューギャップ(FVG)を特定し、トレーダーに潜在的な取引機会を提供します。モバイル通知を通じてこれらのイベントをユーザーに警告し、変化する市場状況に迅速に対応できるようにします。 主な特徴: 市場構造シフトの検出: スイング高値/安値のブレイクと、平均と比較して значительный なキャンドル本体サイズに基づいて、強気と弱気の市場構造シフトを識別します。チャート上の上/下矢印で視覚化されます。 フェアバリューギャップ (FVG) の識別: 過去3本のキャンドルの価格アクションに基づいて、強気と弱気のFVGを検出します。 FVGはチャート上で色付きの長方形で強調表示されます。 モバイル通知: マーケットストラクチャーシフトとFVG形成の両方に関するリアルタイムのモバイル通知を受信し、潜在的な取引設定を見逃さないようにします。 カスタマイズ可能なパラメータ: ルックバック期間 (Lookback Period): スイング高値/安値計
FREE
Necessary for traders: tools and indicators Waves automatically calculate indicators, channel trend trading Perfect trend-wave automatic calculation channel calculation , MT4 Perfect trend-wave automatic calculation channel calculation , MT5 Local Trading copying Easy And Fast Copy , MT4 Easy And Fast Copy , MT5 Local Trading copying For DEMO Easy And Fast Copy , MT4 DEMO Easy And Fast Copy , MT5 DEMO The homeopathic indicator is also called the CCI indicator. The CCI indicator was proposed
FREE
Tipu Heikin-Ashi Panel is the modified version of the original Heiken Ashi indicator published by MetaQuotes here . A professional version of this indicator is available here . Features An easy to use Panel that shows the Heiken Ashi trend of selected timeframe. Customizable Buy/Sell alerts, push alerts, email alerts, or visual on-screen alerts. Customizable Panel. The panel can be moved to any place on the chart or minimized to allow more space. Heikin means "the average", and Ashi means "foot
FREE
Basic Harmonic Pattern
Mehran Sepah Mansoor
4.58 (59)
このインディケータは、相場の反転ポイントを予測する最もポピュラーなハーモニックパターンを識別します。これらのハーモニックパターンは、外国為替市場で常に繰り返され ている価格形成であり、将来起こりうる値動きを示唆します。/   MT5無料バージョン さらに、このインジケーターには、市場エントリーシグナルと、様々な利食いと損切りが組み込まれています。ハーモニック・パターン・インディケータは、それ自体で売買シグナルを発 信することができますが、他のテクニカル・インディケータを使用してこれらの シグナルを確認することをお勧めします。例えば、RSIやMACDなどのオシレーターを使用して、トレンドの方向性やモメンタ ムの強さを確認してから売買を行うことを検討するとよいでしょう。 このインディケータのダッシュボードスキャナ: ( Basic Harmonic Patterns Dashboard ) 含まれるハーモニックパターン ガートレー バタフライ バット カニ サメ サイファー ABCD 主な入力 Max allowed deviation (%): このパラメータは、調和的パタ
FREE
This is a reduced version, demo if you like, of the published Elliott Wave Tool 7Pasos . The limitations for this tool vs Elliott Wave Tool 7pasos are the following: Only one account possible, the original tool has 1 principal and 4 alternative accounts. Only one degree (Primary) is available, in the original tool 12 different degrees (6 in micro) are at your disposition. As only one degree is available, the functions to upgrade and downgrade the degree of the selected wave are disabled. Fixed c
FREE
Fibonacci SR Indicator This indicator creates support and resistance lines. This indicator is based on Fibonacci Retracement and Extension levels. It will consider many combinations of the Fibonacci levels and draw support/resistance lines based on these. This indicator uses tops and bottoms drawn by the ZigZag indicator in its calculations. The ZigZag can also be drawn on the chart, if necessary. The indicator considers many combinations of past reversal points and Fibonacci ratio levels, and w
FREE
Description: The indicator measures, through the zigzag indicator, the levels of trend or correction. It shows in the chart the levels of each low or high detected. KEY LINKS:   How to Install  –  Frequent Questions  -  All Products  How is this indicator useful? This indicator determines, depending on Zigzag parameter if a trend is beginning, developing, or ending This indicator determines the direction of the trend Components Levels as positive or negative numbers, depending on the direction
FREE
価格波形パターン MT4へようこそ --(ABCD パターン)--     ABCD パターンは、テクニカル分析の世界で強力で広く使用されている取引パターンです。 これは、トレーダーが市場での潜在的な売買機会を特定するために使用する調和的な価格パターンです。 ABCD パターンを使用すると、トレーダーは潜在的な価格変動を予測し、いつ取引を開始および終了するかについて十分な情報に基づいた決定を下すことができます。 EA バージョン :   Price Wave EA MT4 MT5バージョン: Price Wave Pattern  MT5 特徴 :  ABCDパターンの自動検出。 強気パターンと弱気パターン。  任意のシンボルと任意の時間枠で機能します。 主要なレベルと価格目標。 カスタマイズ可能な設定と繊維レベルの調整。 アラートと通知。 今後さらに多くの機能が追加される予定です。 
FREE
このプロダクトを購入した人は以下も購入しています
Neuro Poseidon is a new indicator by Daria Rezueva. It combines precise trading signals with adaptive TP/SL levels - creating best possible trades as a result! Message me and get  Neuro Poseidon Assistant  as a gift to automize your trading process! What makes it stand out? 1. Proven profitability on all assets and timeframes 2. Only confirmed BUY and SELL signals present on the chart 3. Adaptive TP & SL levels generated by the software for each trade 4. Easy to understand - suitable for all
Gann Made Easy は、ミスター・ギャンの理論を使用した取引の最良の原則に基づいた、プロフェッショナルで使いやすい外国為替取引システムです。 W・D・ガン。このインジケーターは、ストップロスとテイクプロフィットレベルを含む正確な買いと売りのシグナルを提供します。 PUSH通知を利用して外出先でも取引可能です。 ご購入後、取引方法の説明と優れた追加インジケーターを無料で入手するには、私にご連絡ください! おそらく、ギャンの取引手法についてはすでに何度も聞いたことがあるでしょう。通常、ギャンの理論は初心者のトレーダーだけでなく、すでにある程度の取引経験がある人にとっても非常に複雑なものです。なぜなら、ギャンの取引手法は理論的にはそれほど簡単に適用できるものではないからです。私はその知識を磨き、最良の原則を私の外国為替インジケーターに組み込むために数年を費やしました。 このインジケーターは非常に簡単に適用できます。必要なのは、それをチャートに添付し、簡単な取引推奨事項に従うだけです。このインジケーターは常に市場分析の仕事を行い、取引の機会を探します。適切なエントリーポイントを検出す
Dynamic Forex28 Navigator - 次世代の Forex 取引ツール。 現在 49% オフ。 Dynamic Forex28 Navigator は、長年人気のインジケーターを進化させたもので、3 つの機能を 1 つにまとめています。 Advanced Currency Strength28 インジケーター (レビュー 695 件)  + Advanced Currency IMPULSE with ALERT (レビュー 520 件) + CS28 コンボ シグナル (ボーナス)。 インジケーターの詳細 https://www.mql5.com/en/blogs/post/758844 次世代の Strength インジケーターが提供するもの  オリジナルで気に入っていたすべての機能が、新機能と精度の向上によって強化されました。 主な機能: 独自の通貨強度計算式。 すべての時間枠でスムーズかつ正確な強度ライン。 トレンドの特定と正確なエントリーに最適です。 ダイナミックマーケットフィボナッチレベル (マーケットフィボナッチ)。 このインジケーターに固有
M1 SNIPER は使いやすいトレーディングインジケーターシステムです。M1時間足向けに設計された矢印インジケーターです。M1時間足でのスキャルピングのためのスタンドアロンシステムとして、また既存のトレーディングシステムの一部としても使用できます。このトレーディングシステムはM1時間足での取引に特化して設計されていますが、他の時間足でも使用できます。元々、この手法はXAUUSDとBTCUSDの取引用に設計しましたが、他の市場においても役立つと考えています。 インジケーターのシグナルは、トレンドの方向と逆方向に取引できます。インジケーターのシグナルを利用して両方向に取引するのに役立つ特別な取引テクニックをご紹介します。この手法は、特別な動的なサポートとレジスタンスの価格帯を利用することに基づいています。 ご購入後、M1 SNIPER矢印インジケーターをすぐにダウンロードできます。さらに、M1 SNIPERツールのすべてのユーザーに、以下のスクリーンショットに表示されているApollo Dynamic SRインジケーターを無料で提供しています。この2つのインジケーターを組み合わせることで
Scalper Inside PRO Scalper Inside PRO は、MetaTrader 4 向けの短期トレンドおよびスキャルピング用インジケーターです。独自アルゴリズムを用いて、市場の方向性と主要なターゲットレベルを素早く検出します。エントリー、イグジット、複数の利確ターゲットを自動計算し、詳細なパフォーマンス統計を表示することで、さまざまな銘柄やストラテジーがどのように機能してきたかを確認できます。これにより、現在のマーケットコンディションに最も適した取引銘柄を選択するのに役立ちます。さらに、Scalper Inside PRO には、お使いの矢印インジケーターを簡単に接続でき、その統計と過去のパフォーマンスを素早く評価できます。 本インジケーターは、あらゆる銘柄と時間足で動作し(短期トレードには M5 を推奨)、複数の内蔵ストラテジーを備えています。そのため、単体のスキャルピングツールとしても、トレーディングシステム内の強力な分析コンポーネントとしても活用できます。 主な機能 独自アルゴリズム(Next‑Generation Trend Detection Algor
Enigmera
Ivan Stefanov
5 (8)
ENIGMERA: 市場の中心 重要:MQL5.comのデモはStrategy Testerで実行されており、Enigmeraの機能を完全には反映していない場合があります。詳細については、説明、スクリーンショット、ビデオをご確認ください。質問があれば、遠慮なくメッセージを送ってください! インジケーターのコードは完全に書き直されました。バージョン3.0は新機能を追加し、インジケーターの開始以来蓄積されたバグを修正しました。 紹介 このインジケーターとトレーディングシステムは、金融市場への注目すべきアプローチです。ENIGMERAはフラクタルサイクルを使用して、サポートとレジスタンスのレベルを正確に計算します。真の蓄積フェーズを示し、方向と目標を提供します。トレンドでも修正でも機能するシステムです。 動作方法 インジケーターのほとんどの機能は、チャートの左側にあるボタンで制御され、市場の状況に迅速に対応できるようになっています。 ボタン ON/OFF – インジケーター全体を表示または非表示にします。 Channel – サポートチャネルを有効にし、許容範囲の偏差を示します。 Dev
多くの矢印インジケーターは、シグナルだけを表示して、その後の判断はすべてトレーダー任せです。KT Alpha Hunter Arrows は、最初から完成されたトレードプランを提供します。 各シグナル矢印が表示されると、エントリーライン、ストップロス、4つのテイクプロフィット水準、そして現在の銘柄と時間足を今トレードする価値があるかを示すリアルタイムのエッジ判定が、チャート上にまとめて描画されます。付属の Trade Manager EA は、手動でエントリーした後の管理をサポートし、相場が荒れて感情が揺れやすい場面でも、トレードの規律を保ちやすくします。リペイントなし。確定足のみでシグナルを表示。Forex、ゴールド、指数、その他あなたが取引するあらゆる銘柄向けに設計されています。 主な機能 リペイントしない買い・売り矢印。シグナルは足が確定した後にのみ表示されます。 各シグナルにエントリーライン、構造的なストップロス、4つのテイクプロフィット水準を表示。 Edge Dashboard が、現在のチャート上で買いと売りのセットアップを個別に評価。 判定システム:No Edge、Ma
Price & Time Market Structure Indicator A professional market structure tool that analyzes waves through both price and time — not price alone. Main Description NeoWave PRO is a professional market structure indicator for MetaTrader 4 designed for traders who want to move beyond traditional one-dimensional wave tools such as ZigZag, swing indicators, and basic high/low systems. Most wave indicators analyze only one thing: Price. But a real market wave is not only a price movement. A true wave de
PRO Renko Systemは、特別にRENKOチャートを取引するために設計された高精度の取引システムです。 これは、様々な取引商品に適用することができる普遍的なシステムです。 システムは効果的に正確な逆転信号へのアクセスを与えるいわゆる市場の騒音を中和する。 表示器は非常に使いやすく、信号の生成に責任がある1つの変数だけがあります。 あなたは簡単にお好みの任意の取引ツールとレンコバーのサイズにツールを適応させることができます。 私はいつもあなたが私のソフトウェアで収益性の高い取引を支援するために余分なサポートを提供する準備ができています! 私はあなたに幸せで収益性の高い取引をしたいです! ご購入後にご連絡ください! 私はあなたに私のレンコチャートジェネレータを送信します。 私はまた、私の個人的な推奨事項やシステムの他のモジュールを無料で共有します!
トレンドラインプロ   市場の真の方向転換点を理解するのに役立ちます。この指標は、真のトレンド反転と主要プレーヤーが再び参入するポイントを示します。 分かりますか     BOSライン   複雑な設定や不要なノイズなしに、より長い時間足でのトレンドの変化と重要なレベルを把握できます。シグナルは再描画されず、バーが閉じた後もチャート上に残ります。 VERSION MT 5     -     RFI LEVELS PRO インジケーター と組み合わせることで、その潜在能力を最大限に発揮します。 インジケーターが示す内容: 本当の変化   トレンド(BOSライン) 一度シグナルが現れたら、それは有効です!これは、リペイント機能を持つインジケーターとの重要な違いです。リペイント機能を持つインジケーターは、シグナルを発した後、それを変更し、資金の損失につながる可能性があります。これにより、より高い確率と精度で市場に参入できます。また、矢印が現れた後、目標値(利益確定)に達するか、反転シグナルが現れるまで、ローソク足の色を変更する機能もあります。 繰り返しエントリ       主要プレーヤーの
Trend Catcher ind
Ramil Minniakhmetov
5 (2)
トレンドキャッチャーインジケーター トレンドキャッチャーインジケーターは、開発者独自の適応型トレンド分析指標を組み合わせることで、市場価格の動きを分析します。短期的なノイズを除去し、根底にあるモメンタムの強さ、ボラティリティの拡大、価格構造の挙動に焦点を当てることで、真の市場方向性を特定します。また、移動平均線、RSI、ボラティリティフィルターなどの平滑化およびトレンドフィルタリング機能を備えたカスタマイズ指標も使用します。 実際の運用状況のモニタリングやその他の製品については、こちらをご覧ください: https://www.mql5.com/en/users/mechanic/seller ご注意ください。私はTelegramでEAや設定を販売していません。詐欺です。すべての設定はブログで無料で公開しています。 重要!ご購入後すぐにご連絡ください。手順とボーナスをお送りします!
Genesis Matrix Pro is a professional multi-timeframe trend detection indicator designed to help traders identify high-quality market alignment with clarity and structure. It combines 12 different technical indicators into one visual alignment matrix, allowing traders to quickly see when market conditions are bullish, bearish, or neutral. A signal is generated only when the selected strategies are aligned, helping reduce noise and improve decision-making. PLEASE CONTACT ME AFTER PURCHASE TO GET
Current event:  https://c.mql5.com/1/326/A2SR2025_NoMusic.gif A. A2SR とは何ですか ?   * 先行テクニカル指標です (塗り直しなし、ラグなし)。 -- ガイダンス : -- https://www.mql5.com/en/blogs/post/734748/page4#comment_16532516 -- そして https://www.mql5.com/en/users/yohana/blog A2SR には、サポート (需要) とレジスタンス (供給) のレベルを決定する特別な手法があります。 ネットで見かける通常の方法とは異なり、A2SR は実際の SR レベルを決定する独自のコンセプトを持っています。 元の手法はインターネットから取得されたものではなく、インターネット上で公開されたこともありません。 A2SR は、取引スタイルに応じて SR レベルを自動選択します。 時間枠を変更しても、SR レベルはその位置にとどまります。 実際のSRは、使用する時間枠から取得されるわけではないため. A2SR
トレンドトレーディング は、タイミングのプルバックとブレイクアウトにより、市場で起こっているトレンドから可能な限り利益を得るように設計された指標です。確立されたトレンドの中で価格が何をしているかを分析することにより、取引の機会を見つけます。 [ インストールガイド | 更新ガイド | トラブルシューティング | よくある質問 | すべての製品 ] 自信を持って効率的に金融市場を取引する むち打ちにならずに確立されたトレンドから利益を得る 収益性の高いプルバック、ブレイクアウト、早期の逆転を認識する この指標は、独自の品質とパフォーマンスを分析します 複数時間枠のダッシュボードを実装します インジケーターは再描画されていません 電子メール/音声/視覚アラートを実装します 確立されたトレンドは多くの取引機会を提供しますが、ほとんどのトレンド指標はそれらを完全に無視しています。インジケーターの解釈はかなり簡単です: (1) トレンドの変化 (2) トレンドの方向への後退 (3) トレンドの方向へのブレイクアウト 赤いダッシュ は下降トレンド中の修正です 青いダッシュ は上昇トレンド中
Step into the world of Forex trading with confidence, clarity, and precision using   Gold Indicator   a next-generation tool engineered to take your trading performance to the next level. Whether you’re a seasoned professional or just beginning your journey in the currency markets, Gold Indicator equips you with powerful insights and help you trade smarter, not harder. Built on the proven synergy of three advanced indicators, Gold Indicator focuses exclusively on medium and long-term trends eli
この製品は 2026 年の市場向けに更新され、最新の MT5 ビルドに最適化されています。 価格更新のお知らせ: Smart Trend Trading System は現在 $99 で提供されています。 次の 30 件の購入 後、価格は $199 に上がります。 特別オファー: Smart Trend Trading System を購入後、私にプライベートメッセージを送ることで、 Smart Universal EA を無料 で受け取り、Smart Trend のシグナルを自動売買に変えることができます。 Smart Trend Trading System は、リペイントなし、再描画なし、遅延なしの完全なトレーディングシステムです。よりクリーンなシグナル、より明確なトレンド方向、そしてより整理された取引方法を求めるトレーダー向けに作られています。 Online course , manual and download presets . このシステムは、トレンド検出、反転ゾーン、Smart Cloud、トレーリングストップロジック、サポートとレジスタンス、ローソク足の色分け、ア
Scalper Vault は、スキャルピングを成功させるために必要なすべてを提供するプロフェッショナルなスキャルピング システムです。このインジケーターは、外国為替およびバイナリー オプションのトレーダーが使用できる完全な取引システムです。推奨される時間枠は M5 です。 システムは、トレンドの方向に正確な矢印シグナルを提供します。また、トップとボトムのシグナルとギャン マーケット レベルも提供します。 インジケーターは、プッシュ通知を含むすべてのタイプのアラートを提供します。 インジケータの購入後にご連絡ください。私の個人的な取引の推奨事項と素晴らしいボーナス指標を無料で共有します! 幸せで有益な取引をお祈りします!
スイングトレーディング は、トレンドの方向のスイングと可能な反転スイングを検出するように設計された最初のインジケーターです。トレーディングの文献で広く説明されているベースラインスイングトレーディングアプローチを使用します。インディケータは、いくつかの価格と時間のベクトルを調査して、全体的なトレンドの方向を追跡し、市場が売られ過ぎまたは買われ過ぎて修正の準備ができている状況を検出します。 [ インストールガイド | 更新ガイド | トラブルシューティング | よくある質問 | すべての製品 ] むち打ちを起こさずに市場スイングの利益 インジケーターは常にトレンドの方向を表示します 色付きの価格帯は機会のベースラインを表します 色付きのダッシュは、可能な反転スイングを表します この指標は、独自の品質とパフォーマンスを分析します 複数時間枠のダッシュボードを実装します カスタマイズ可能なトレンドおよびスイング期間 電子メール/サウンド/プッシュアラートを実装します インジケータは再描画またはバックペインティングではありません Swing Tradingとは Swing Tradingは
BTMM State Engine Pro is a MetaTrader 4 indicator for traders who use the Beat The Market Maker approach: Asian session context, kill zone timing, level progression, peak formation detection, and a multi-pair scanner from a single chart. It combines cycle state logic with a built-in scanner dashboard so you do not need the same tool on many charts at once. What it does Draws the Asian session range; session times can follow broker server offset or be set in inputs. Tracks level progression (L
「 Dynamic Scalper System 」インジケーターは、トレンド波の中でスキャルピング取引を行う手法のために設計されています。 主要通貨ペアと金でテスト済みで、他の取引商品との互換性があります。 トレンドに沿った短期的なポジションオープンのシグナルを提供し、追加の価格変動サポートも提供します。 インジケーターの原理 大きな矢印はトレンドの方向を決定します。 トレンド波の中では、小さな矢印の形でスキャルピングシグナルを生成するアルゴリズムが機能します。 赤い矢印は強気方向、青い矢印は弱気方向です。 トレンドの方向には敏感な価格変動ラインが描かれ、小さな矢印のシグナルと連動します。 シグナルは次のように機能します。適切なタイミングでラインが現れるとエントリーシグナルが形成され、ラインが開いている間はポジションが保持され、完了すると取引が終了します。 推奨される動作時間枠はM1~H4です。 矢印は現在のローソク足に形成され、次のローソク足が開いている場合は、前のローソク足の矢印は再描画されません。 入力パラメータ Trend Wave Period - トレンド方向
MonsterDash Harmonic Indicator is a harmonic pattern dashboard. It recognizes all major patterns. MonsterDash is a dashboard that displays all detected patterns for all symbols and (almost) all timeframes in sortable and scrollable format. Users can add their own user defined patterns . MonsterDash can open and update charts with the pattern found. Settings MonsterDash's default settings are good enough most of the time. Feel free to fine tune them to your needs. The color settings are for thos
Apollo SR Master は、サポート/レジスタンスゾーンを利用した取引をより容易かつ確実にする特別な機能を備えたサポート/レジスタンスインジケーターです。このインジケーターは、ローカル価格の高値と安値を検出することで、タイムラグなしでリアルタイムにサポート/レジスタンスゾーンを計算します。そして、新たに形成されたSRゾーンを確認するために、インジケーターは特別なシグナルを表示します。このシグナルは、SRゾーンを実際の売りまたは買いシグナルとして考慮して使用できることを示します。この場合、SRゾーンの強度が高まり、SRエリアからの取引が成功する確率も高まります。これがこのインジケーターの基本的な考え方です。 SRゾーンは、ストップロスとテイクプロフィットの設定を容易にします。シグナルの方向に応じて、SRゾーンの上または下のスペースをストップロスとして設定できます。さらに、反対側のSRゾーンは、潜在的なテイクプロフィットエリアとして設定できます。 また、Apollo SRマスターインジケーターをご利用のすべてのユーザーには、「Apollo Price Action System」
地震計マーケット クエイク検出器。 Description in English : https://www.mql5.com/en/market/product/113869?source=Site+Market+Product+Page#description How to use the Seismograph : https://www.mql5.com/en/market/product/113869#!tab=comments&page=2&comment=52806941 Create an EA : https://www.mql5.com/en/market/product/113869#!tab=comments&page=3&comment=52816509 どのような取引方法であれ、流動性の低い市場への参入は避けたいものです。 地震計は、市場が上昇する前に市場に参入する適切なタイミングに役立ちます。 しかし、忙しいはずの市場時間帯にエントリーするようにしたにもかかわらず、流動性の低い市場に閉じ込められてしまう人が多いのが実情です。 数時間待った後、
現在40%オフ 初心者やエキスパートトレーダーに最適なソリューション! このインジケーターは、独自の機能と新しい計算式を取り入れた、ユニークで高品質、かつ手頃な価格のトレーディングツールです。たった1枚のチャートで28の為替ペアの通貨強度を読み取ることができます。新しいトレンドやスキャルピングチャンスの引き金となるポイントを正確に特定することができるので、あなたのトレードがどのように改善されるか想像してみてください。 ユーザーマニュアルはこちら  https://www.mql5.com/en/blogs/post/697384 これが最初の1本、オリジナルだ! 価値のないクローンを買わないでください。 特別な サブウィンドウの矢印で強い通貨の勢いを表示 GAPがあなたのトレードを導く! 基準通貨や気配値が売られすぎ・買われすぎのゾーン(外相フィボナッチレベル)にあるとき、個別チャートのメインウィンドウに警告表示。 通貨がレンジの外側から反落した場合、プルバック/リバーサルのアラート。 クロスパターンの特別なアラート 複数の時間枠を選択可能で、トレンドを素早く確認できます
Auto Optimized Parabolic RSI: 高度な3Dモメンタムエンジン ほとんどのリテール向けインジケーターは、市場のボラティリティが変化した瞬間に破綻する静的な入力値に依存しているため、失敗に終わります。Auto Optimized Parabolic RSIは、自らの数学的優位性を継続的に再計算することで「インジケーターの陳腐化」問題を解決し、機関投資家レベルの定量的適応力をMT5ターミナルに直接もたらします。 最大の強み: カスタムインメモリ3D最適化   標準的な自動最適化ツールは、インジケーターの呼び出しで端末に過負荷をかけるため、頻繁にMT5プラットフォームをフリーズさせます。本ツールは、このボトルネックを完全に回避しています。RAMベースのカスタムネイティブ計算機を内蔵した内部エンジンは、チャートを読み込んだりタイムフレームを変更したりするたびに、超高速の3Dグリッド探索を実行します。RSI期間(頻度)、SARステップ(加速度)、SAR最大値(制限速度)を同時にスイープし、プラットフォームを遅延させることなく、数万通りものパラメーターの組み合わせを絶対的
Advanced Supply Demand
Bernhard Schweigert
4.91 (300)
現在40%オフ 初心者にもエキスパートトレーダーにも最適なソリューション このインジケーターは独自の機能と新しい公式を多数内蔵しており、ユニークで高品質かつ手頃な取引ツールです。このアップデートでは、2つの時間枠ゾーンを表示できるようになります。より長いTFだけでなく、チャートTFとより長いTF(ネストゾーンを表示)の両方を表示できます。すべてのSupply Demandトレーダーの皆さんのお気に召すはずです。:) 重要情報の公開 Advanced Supply Demandの可能性を最大化するには、 https://www.mql5.com/ja/blogs/post/720245 にアクセスしてください。   エントリーまたはターゲットの正確なトリガーポイントを正確に特定できれば取引がどのように改善されるか想像してみてください。新しい基盤となるアルゴリズムに基づいて構築されているため、買い手と売り手の間の潜在的な不均衡をさらに簡単に特定できます。これは、最も強い需要と供給のゾーンと、過去のパフォーマンス(古いゾーンを表示)がグラフィカルに表現されるためです。これらの機能は、最適な
このインジケーターは、エリオット波動理論と組み合わせて作動し、2つの方法で使用されます: 自動モード: このモードでは、インジケーターがチャート上の全ての5つのモーティブ波を自動的に検出し、予測とポテンシャルな逆転ゾーンを提供します。また、アラートやプッシュメッセージを生成する能力も備えています。この自動機能により、エリオット波動パターンの識別と分析のプロセスが効率化されます。 手動モード: このオプションは、エリオット波動理論を手動で扱いたいトレーダー向けです。9つの段階を使用して波を描画することができます。各段階は、表示された後に描画されたラインを調整して個別に定義できます。この機能により、手動で波を描画するプロセスがより効率的になります。重要な点として、すべての描画データが将来の参照のためにプラットフォームのデータフォルダに保存されることに注意してください。 パラメータ: Name: インジケーターの名前。 Use_System_Visuals: インジケーターのテーマを有効または無効にして、取引プラットフォーム全体の外観に合わせます。 Explain_Comment: 波の番号
Introduction to Fractal Pattern Scanner Fractal Indicator refers to the technical indicator that makes use of the fractal geometry found in the financial market. Fractal Pattern Scanner is the advanced Fractal Indicator that brings the latest trading technology after the extensive research and development work in the fractal geometry in the financial market. The most important feature in Fractal Pattern Scanner is the ability to measure the turning point probability as well as the trend probabi
Send us a message after your purchase to receive more information on how to get your  BONUS  for FREE  that works in great combination with Bull vs Bear ! Bull versus Bear is an easy-to-use Forex indicator that gives traders clear and accurate signals based on clear trend retests . Forget about lagging indicators or staring at charts for hours because  Bull vs Bear provides real-time entries with no lag and no repaint, so you can trade with confidence. Bull vs Bear  helps you enter trades during
The Propfolio Master Suite is the ultimate all-in-one analytical workstation for professional traders. Combining the power of the Beat The Market Maker (BTMM) methodology, Smart Money Concepts (SND/Liquidity), and Advanced Volume Profile, this suite replaces multiple different indicators with one optimized engine. Monitor up to 14 pairs simultaneously from a single chart, instantly identify market cycles, and seamlessly map institutional footprints with the click of a button. The Command Center
作者のその他のプロダクト
Lisek ATR Levels
Darius Hans Lischka
5 (3)
Are you looking for  ATR Levels,   ATR Trend, ATR Support and Resistance  Indicators ? Now you have all in one !!!  Info on your chart is showing you: where current price and levels are, what is current trend and signals. Search for an entry with low risk for trading by Lisek ATR Indicator. There are many ways to trade with Lisek ATR Indicator: Trade Support and Resistance Levels. Trade pullbacks (Range trading). Trade breakouts. Trade reversals. Take profit or set stop-loss based on ATR Levels.
FREE
Lisek Levels EA
Darius Hans Lischka
4.4 (5)
Simple but powerfull Trend and Hedge EA for Lisek Levels and Channels Indicator . 1. Download Lisek Levels and Channels Indicator . 2. Backtest and optimize in Strategy Tester. 3. For Agressive Tick Mode set your Chart to M1 Time Frame. 4. To speed up Strategy Tester, set "Show Info" to   false   ! 5. After backtesting, it’s important to analyse the test results  (best profit and smallest drawdown). 6. Test your EA settings on Demo Account. Happy Trading !!!
FREE
フォレックス取引のシャーロック・ホームズになる準備はできていますか?️‍️ 究極のトレーディングツール、 Lisek Levels and Channels インジケーターの登場です!!! サーカスの芸のように複数のインジケーターを扱うのは忘れてください。必要なものをすべて一つの素晴らしいショーにパッケージングしました: 価格レベル?チェック済み! 価格チャネル?間違いなし! 価格VWAP?もちろん! オンバランスボリューム?全部ここにあります! そして、お楽しみはこれだけではありません!ダブルエスプレッソよりも素早く目を覚まさせるアラームとプッシュ通知!️ あなたのチャートはトレーディングチャンスの宝の地図に変身します: 現在の価格がどこにあるか、すべてのクールなレベル、チャネル、VWAPと一緒に見てください。 オンバランスボリュームを評価しましょう - ベアダンスを踊っていますか、それともブルタンゴですか?買い手と売り手、どちらが動きを持っているか見てみましょう。 フォレックスのレイブパーティーのように上下を指す矢印?これは買い手または売り手の増加するボリ
FREE
Lisek Stochastic
Darius Hans Lischka
2.83 (6)
Lisek Stochastic   oscillator indicator with Alarm, Push Notifications and e-mail  Notifications. The Stochastic indicator is a momentum indicator that shows you how strong or weak the current trend is. It helps you identify overbought and oversold market conditions within a trend. The Stochastic indicator is lagging indicator, which means it don't predict where price is going, it is only providing data on where price has been !!! How to trade with Stochastic indicator: Trend following: As long
FREE
Simple ATR Stop Loss :市場のボラティリティを示す羅針盤です。トレーディングの荒波を乗り切り、より賢い ストップロス を設定し、トレーディングの忍者のように見せてくれます(マントは含まれません)。 トレーディング愛好家と市場の達人の皆さん、注目してください! Simple ATR Stop Loss インジケーターの登場です – 荒々しいトレーディングの世界における新しい親友です。 2ピースパズルよりも簡単で、カフェイン漬けの牛が陶器店に入ったときよりも強力です。 ATRトレーディングチートシート(または市場の波に乗って沈まない方法)‍️: ATR:市場のムードデコーダー ️‍️ ATRを市場のTwitterフィードだと考えてください。高い値?ツイートの嵐モードです。 低い値?サイレントモードです。 この情報を使って、飛び込むか岸から見守るか決めましょう。‍️ サイジングと狙いを正確に ATRをあなたのトレーディングの仕立て屋とターゲット練習のコーチにしましょう。 弟や妹の服を着ているような感
FREE
Lisek Weis Wave
Darius Hans Lischka
5 (3)
This Weis Wave Volume indicator is a tool to help traders identify the current price trend.  Understanding volume can provide insight into a market's behavior to help you determine its overall health. The most important rule is this: volume precedes price. Typically, before a market price moves, volume comes into play. It has 2 main colors histogram which are green and red. – Green indicates an upward wave. The more the price increases, the bigger the green volume gets. – The red color shows a d
FREE
Lisek Multi MA
Darius Hans Lischka
5 (1)
Search for an entry with low risk for trading by Lisek Moving Average Indicator. There are many ways to trade with Lisek Moving Average Indicator: Trend continuation (Trend trading). Trade pullbacks (Range trading). Trade breakouts. Trade reversals. Take profits or set stop-loss based on your MA. Moving Averages are a frequently used technical indicator in forex trading, especially over 10, 50, 100, and 200 periods. Moving Averages are lagging indicators, which means they don't predict where p
FREE
ATR Pyramid ️: ステロイド注射されたジェンガの塔よりも高く利益を積み上げるチケット 、市場のボラティリティをトレンドサーフィン ‍️とポジション追加パーティー に変える、最初のトレードだけが大損のリスクがある中 、残りはストップロスをエレベーターのように上げて守り 、エスプレッソを飲んだウサギより速くあなたのフォレックス口座を増やす唯一の本当の方法となる快適ゾーンを作り出す!!! 利益積み上げ屋とトレンドサーファーの皆さん、注目! ‍️ この ATR Pyramid インジケーターは、金融ピラミッドを構築するのが好きな方々のためのものです(合法的なものだと約束します )。 ATRは市場のボラティリティしか示さないって言われてるの知ってる? でも、どんでん返し - それが全てじゃないんだ! この賢い小さなツールは、カフェイン中毒のブラッドハウンドより速くトレンドの方向を嗅ぎ分けられるんだ。 そして何を思う? 食べ放題バイキングのように、これを使って利益を積み上げているんだ。 ️ でも、まだあ
FREE
フィルタ:
fenix trading
254
fenix trading 2023.01.19 10:06 
 

I like it a lot, we wait for updates, very appreciated.

ThorstenKock
2584
ThorstenKock 2021.05.18 17:48 
 

ユーザーは評価に対して何もコメントを残しませんでした

レビューに返信